
Over the past few weeks, I’ve published several articles about private colleges in the US. My first post discussed two articles by Daniel Greenstein, whose research of more than 1,000 private colleges indicated that enrollment scale and admissions selectivity were key indicators for these institutions’ ongoing financial success or financial risk.
To analyze the reasonableness of Mr. Greenstein’s findings, I assessed data from College Navigator for 13 private colleges in Maryland. I subsequently analyzed data from private colleges in Virginia, Florida, Pennsylvania, and Iowa. If you evaluated the enrollment scalability of the 100+ colleges I reviewed, more than half are at the highest level of risk based on Mr. Greenstein’s bright line of 2,500 students. If you evaluated them for admissions selectivity, the percentage was far greater.
From a risk perspective, Mr. Greenstein determined that when the acceptance rate of private colleges exceeds 50%, a college loses its pricing flexibility and is forced to adjust its pricing to match the market.
Tuition Discounting as a Threat to Financial Stability
But as any higher ed insider knows, there’s a big difference between the published price of tuition and fees and the actual price, thanks to tuition discounting. I’ve never been a proponent of tuition discounting. Its original purpose was to allow an institution to recruit and enroll students with higher incoming credentials (GPA, SAT/ACT scores, etc.) by offering merit aid, but this purpose has long been forgotten. Now that tuition discount percentages greater than 50% are prevalent, many institutions provide aid awards to 100% of all entering freshmen, regardless of their financial situation.
I discussed this issue in several articles in 2023 including one about a proposal to increase the number of Pell students at Ivy League institutions. I pointed out that Ivy League institutions (and a few others with very large endowments) have policies that waive tuition for families whose income falls below $100,000 or a higher amount. The Ivies have a net price for the lowest income students that is close to zero, which is what it should be when families’ incomes are below $30,000 or $48,000 or $75,000 (the high end of the three lowest income quintiles.
I pointed out that the mean net price for the Ivy League institutions was half of the mean net price for an analysis of admissions and financial aid practices at community colleges that I had reported earlier that year. The high selectivity (low acceptance rate) of the Ivies and other elite institutions allowed them to cover nearly 100 percent of the costs for low income students whereas community colleges and almost every other college with high acceptance rates failed to meet 100 percent of the low income students’ financial needs.
Some people may ask how the Ivies and other institutions can fully cover the costs of attendance for low income students when their costs of attendance; primarily tuition, room and board; are so high. Several reasons come to mind. They have very large endowments (in the billions), some of which is dedicated to financial aid. They are highly selective with low single digit acceptance rates from a pool of 40,000 or more. Their tuition is high, enabling them to dedicate a small portion of it to merit aid (tuition discounting). In short, they have a better business model than most institutions.
For institutions without endowment balances in the billions that are non-selective (using Daniel Greenstein’s definition of accepting more than 50 percent of applicants), the choice is to strategically award institutional aid (tuition discounts) to students who can afford to pay the most since that increases the amount of cash coming in to cover the expenses of operating the college. Much of that data is accessible to non-researchers through the Department of Education’s College Navigator website.
Tuition Discounting as Reported by College Navigator
There’s a multi-step process that I use to review the prevalence of merit aid at an institution. It begins by accessing College Navigator and entering the institution’s name and the state where it is located.
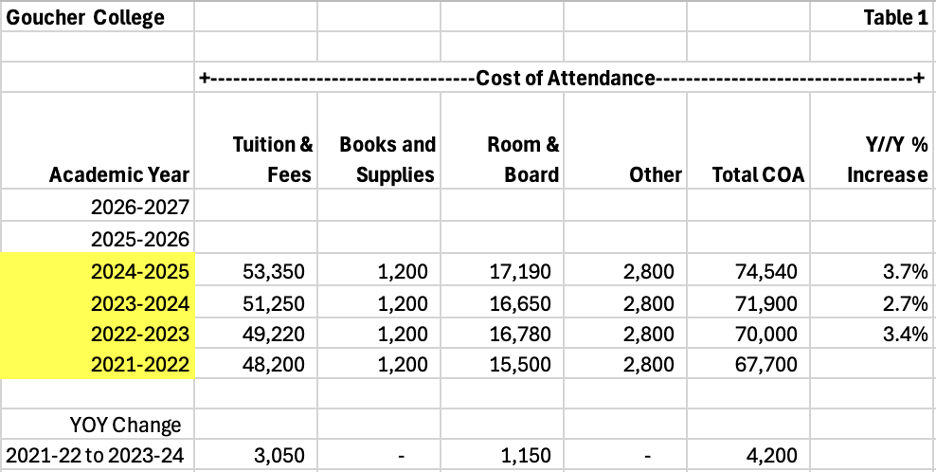
My next step is to click the Tuition, Fees, and Estimated Student Expenses tab. A four-year comparison of Tuition and Fees, Books and Supplies, On Campus Food and Housing, and Other Expenses is listed with the most recent data in the next-to-far-right column. The last column calculates the change in each line item from the previous year to the most recent year. Note that the most recent year is usually not the current year but is a year ago (Fall of 2024, in this case).
The sum of those line items is calculated and listed as Total Expenses broken out by On Campus, Off Campus, or Off Campus with Family. For public institutions, the expenses are also calculated for in-state and out-of-state students. Total Expenses, also known as Cost of Attendance, is usually what I label those totals in my charts.
For illustration purposes, I selected a private college that I included in a review of Maryland Independent College and Universities’ (MICUA) members, Goucher College, and built a four-year table of the components of its Cost of Attendance. As shown in Table 1 below, Goucher’s annual increases have averaged 3.3% over the four-year period. I also calculated the two-year change (from Fall 2021 to Fall 2023) in dollars. I’ll explain why a little later.
Net Price
I usually skip over the Financial Aid tab (with a plan to return later) and click on the Net Price tab. Net Price, as published by College Navigator, is the average net price for full-time, beginning students (commonly known as freshmen). The definition is further refined by the Department of Education as “average net price is generated by subtracting the average amount of federal, state/local government, or institutional grant or scholarship aid from the total cost of attendance.” As mentioned earlier, “total cost of attendance is the sum of published tuition and required fees, books and supplies, and the weighted average for Food and Housing and other expenses.”
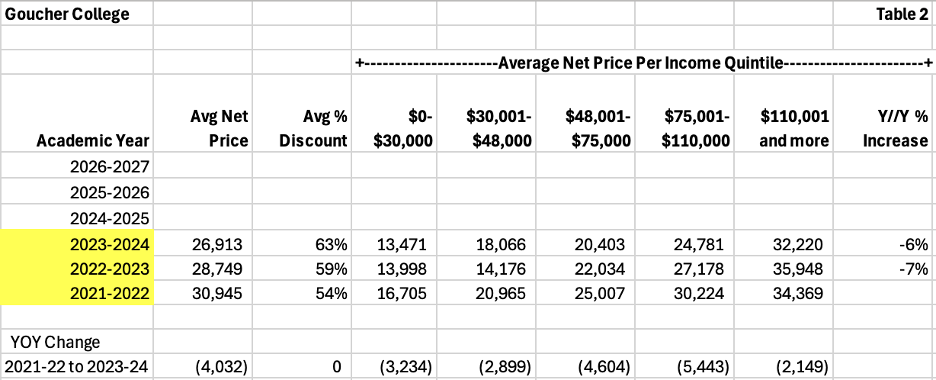
Table 2 below presents the overall published average net price and the average net price by income quintile for the three-year period currently published for Goucher in College Navigator. It does not match the same four-year period published for Total Expenses (Cost of Attendance). Anyone using the data for comparative purposes must make sure the years match. I also calculated the average discount percentage based upon the following formula: 1 minus the fraction of the average net price divided by the total cost of attendance.
There are several interesting datapoints in Table 2. First, note that the average net price has declined over the three-year period. While the total cost of attendance increased at an average rate of 3.3% per year, the average net price declined by 6.5% per year. Unless Goucher is increasing its undergraduate or graduate enrollments, that differential is unhealthy (note – Goucher has increased its number of graduate students, many of whom are enrolled as online students).
The second datapoint is the average discount percentage. It increased from 54% in the Fall of 2021 to 63% in the Fall of 2023. Assuming the enrollment management team is doing the best they can to minimize the amount of merit aid awarded, that implies fierce competition for undergraduate students.
The third datapoint is the dollar change in overall average net price, as well as the dollar change in average net price by income quintile. Note that the average net price for each of the three years in Table 2 falls between the fourth and fifth quintiles. That indicates that the number of students receiving grant aid is weighted more heavily in these income quintiles than in the lowest income quintile.
While the average net price is lowest for the lowest family income quintile ($0-$30,000) and moves higher as income increases, the most recent year’s average net price of $13,471 exceeds what I believe any family in that income category can afford to pay (and mirrors what I have previously written that the Ivy League institutions and handful of other elite institutions with large endowments cover almost 100% of the costs for their lowest income students). In 2023-2024, federal student loan limits were capped for freshmen at $5,500 for a dependent student and $9,500 for an independent student. Since Pell grants have already been deducted, the lower income students have out-of-pocket costs that, in my opinion, are too steep.
After discussing this observation with a friend of mine who works for a Maryland college, I was informed that the state of Maryland has several need-based programs for low income students. The programs provide college expense funding for the first two years for a Maryland resident attending a Maryland college including private colleges. I was hopeful that one of those programs would fund the $13,471 “gap.” Then I remembered that the definition of net price includes the subtraction of federal and state grant programs. If low income Goucher students receive state aid as well as Federal Pell grants, those amounts have been deducted in order to calculate net price.
College Navigator doesn’t publish the number of students in each quintile. Still, the weighting of the overall average net price between the fourth and fifth income quintiles indicates that the largest number of students at Goucher are in the highest income quintile. It’s also important to remember that the published number in each quintile is an average. While that may not make a difference in the first four quintiles, because the last quintile has no theoretical income cap, the distribution of students in that quintile can influence the average.
Average Net Grants
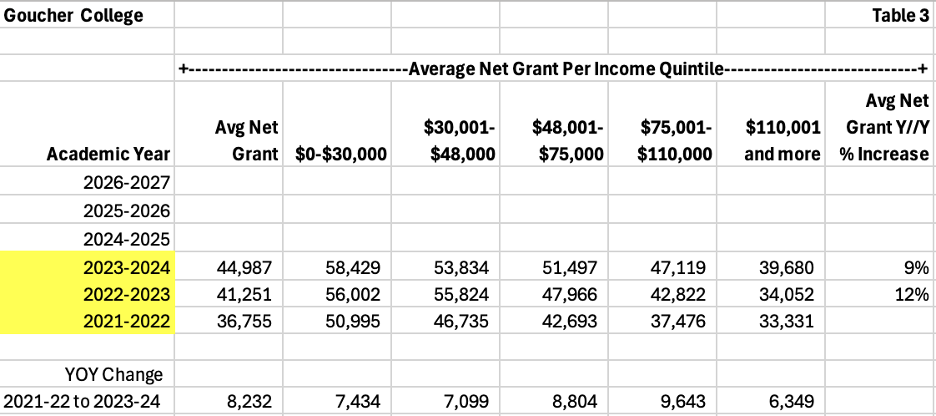
Table 3 shows the average net grant per income quintile. It’s my understanding that institutions submit the average net grant per income quintile along with the number of students in each quintile to support the calculation. College Navigator does not publish grants by income quintile, but it does publish the total grant funding and average grant per student for freshmen and all underclassmen under Financial Aid.
I calculated the average net grant per income quintile by subtracting the average net price per income quintile from the total cost of attendance for the appropriate period. I think there are several important observations.
It makes sense that if the average net price declined, the average net grant increased, which it did. Because the average net price was weighted between the fourth and fifth quintiles, it is not surprising that the average net grant is similarly weighted.
It is interesting to me that the $8,232 increase in the average net grant is distributed across the second and third income quintiles. That’s likely because the dollar increase for the highest income quintile was $6,349, which pulls down the other averages if more students are in that quintile.
It’s also important to note that while the average net grant for the highest income quintile students increased by less than $1,000 from Fall 2021 to Fall 2022, the average net grant for that quintile increased by more than $5,000 from Fall 2022 to Fall 2023. I suspect it’s another indicator of increased competition for higher-income students, driven by the prevalence of merit aid.
Lastly, I compared my calculated average net grant with the average grant for entering freshmen published under the financial aid tab. The Financial Aid tab shows an average grant of $43,791, which is close to the calculated average net grant. I suspect the difference is due to College’s Navigator’s Cost of Attendance (COA) calculation using a “weighted average for Food, Housing, and other expenses.” I used the published amounts in each category. Goucher may have a higher percentage of students who live at home and not on campus, so the weighting of COA is different than the “on campus” totals that I used.
Financial Aid Awards
At private colleges, particularly those with a high tuition discount percentage (greater than 50%), the other components of financial aid aren’t as significant because of the Federal caps on each. I already mentioned the loan cap. The Pell grant cap for a full-time freshman with a Student Aid Index (SAI) score of $0 (used to be Expected Family Contribution – EFC) was $7,395 in 2023-2024.
The percentage of freshmen receiving Pell grants at Goucher in 2023-2024 was 35%, with an average grant of $6,333 (not many students had an SAI of $0). The percentage of freshmen receiving loans at Goucher in 2023-2024 was 54% with an average federal loan of $6,495. The Pell grant percentage is surprisingly high based on my experience. Usually, the high cost of attendance at private colleges keeps the percentage of students receiving Pell grants below 20%.
If the most recently published net price for its lowest income students is $13,471 and the cap on student loans is $5,500 (dependent student) or even $9,500 (independent student), you may ask how does a student pay for the shortfall? Unfortunately, it’s likely to mean that their parents borrow that money and a likely source is the Parent PLUS loan program. I first wrote about the Parent PLUS program in 2021 and have consistently called for it to be terminated because it harms low income families and enables institutions to maintain high net prices. Believe it or not, the shortfall at Goucher is less than many other private colleges.
Before I conclude, I want to note that I used Goucher as a useful example from the data available in College Navigator and not for any other reasons. While its tuition discounting percentage appears to be higher than published averages for private colleges, it has hundreds of grad students as well as a decent endowment balance (nearly $300 million as of June 30, 2024 which places it in the top 15% of private college endowments.
Time to Rethink Tuition Discounting
Many people, including Daniel Greenstein, have written that a significant percentage of private colleges are at risk of closure or merger. The reasons vary from low enrollment, declining enrollment, low endowment balances, fixed costs in a declining enrollment environment, outdated curriculum, and on and on.
I like to help non-researchers access public data that provides key indicators of items related to an institution’s costs, selectivity, financial aid policies, and aspects of its financial risk profile. Naturally, there are always risk offsets, such as having a substantial endowment or a sizable population of graduate students. Even with those offsets, the number of institutions in trouble continues to increase.
Trustees should be well-versed in financial statements and the importance of a breakeven budget when there are few funds to offset substantial losses. Mergers, after all, are not easy and don’t occur frequently. Pulling off a merger successfully when you have few assets to contribute is even more difficult.
Years from now, I suspect a historian will chronicle the advent of merit aid funded through tuition discounts as one of the leading contributors to the financial downfall of many small, private colleges. I wonder how many colleges have recently increased merit aid for the highest-income students, as in the example above. As you may have surmised, it’s not a good sign, and when there is more than one indicator going in the wrong direction, that’s a problem that needs to be fixed.


