
For nearly a decade, the Federal Reserve Bank of New York has published quarterly and annual reports on labor market outcomes for recent college graduates. A footnote to the most recent report cites a NBER paper from 2016 that provided a foundation for the FRBNY report.
The authors of that 2016 working paper, Jaison Abel and Richard Deitz, examined why many recent college graduates were underemployed. Among their key findings were:
- Underemployment rose sharply, even as the economy recovered in the years following the Great Recession
- Underemployed does not mean that graduates are working in service jobs
- The likelihood of underemployment varies significantly by program major
- Underemployment is often temporary, not a permanent phase
- Initial job placement can play a critical role in long-term career trajectory
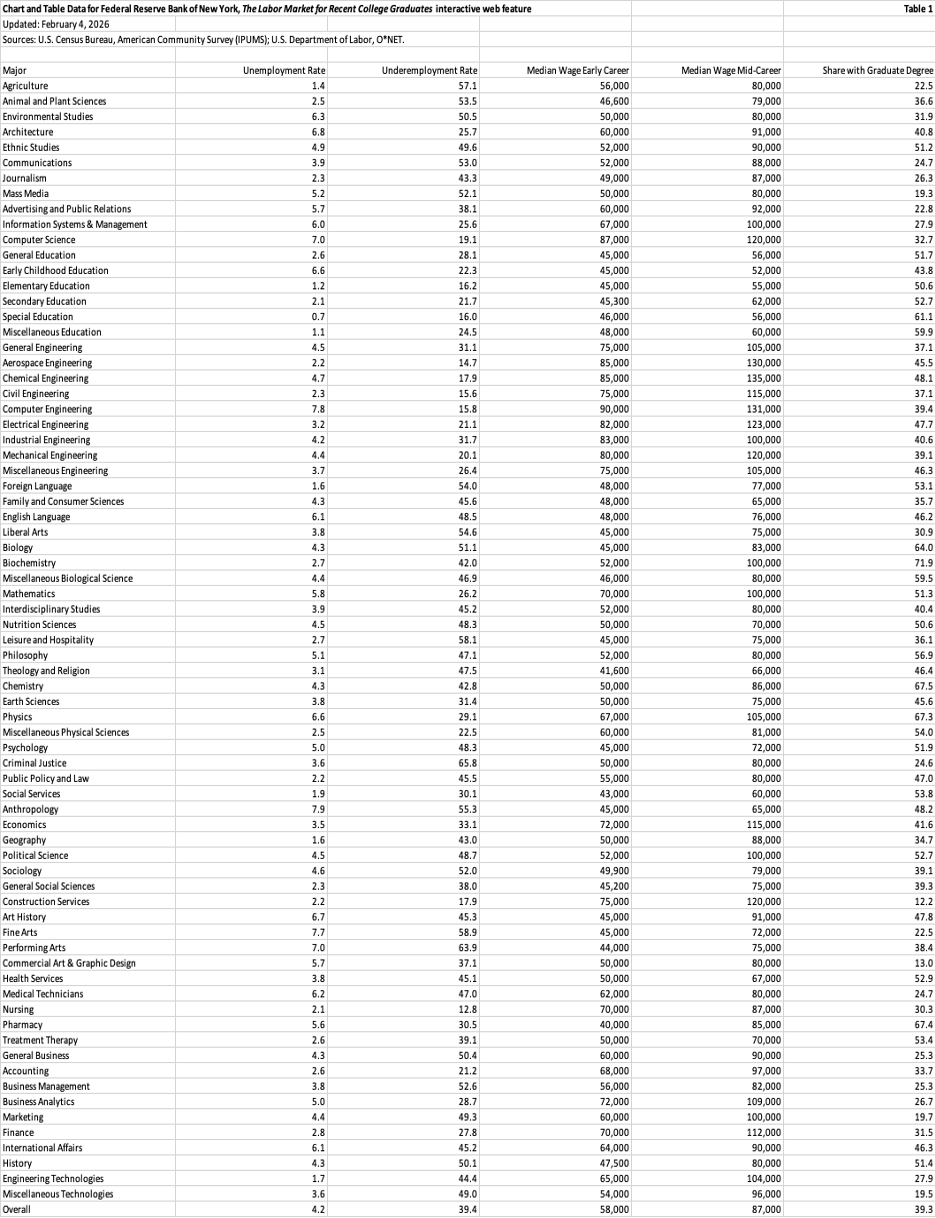
It’s not surprising that the New York Fed’s report organizes its data by program major based on the findings of Abel and Dietz. With data from recent graduates of 73 programs, the Fed Report provides the following five columns of data points for each program:
- Unemployment rate
- Underemployment rate
- Median wage early career
- Median wage mid-career
- Share with graduate degree
Table 1 below lists the program majors in the order in which the report downloaded them. Tables 2 through 6 that follow will look at the top 15 (20%) and bottom 15 (20%) for each of the five categories.
Unemployment Rates by Program Major
Table 2A provides the 15 lowest (best) program major unemployment rates. It’s not surprising, given the national teacher shortage, that four of the five education majors are among the programs with the lowest unemployment rates. The exception is the early childhood education major. Engineering, Construction Services, Nursing, Agriculture, and Social Services are programs tailored to specific occupations as well.
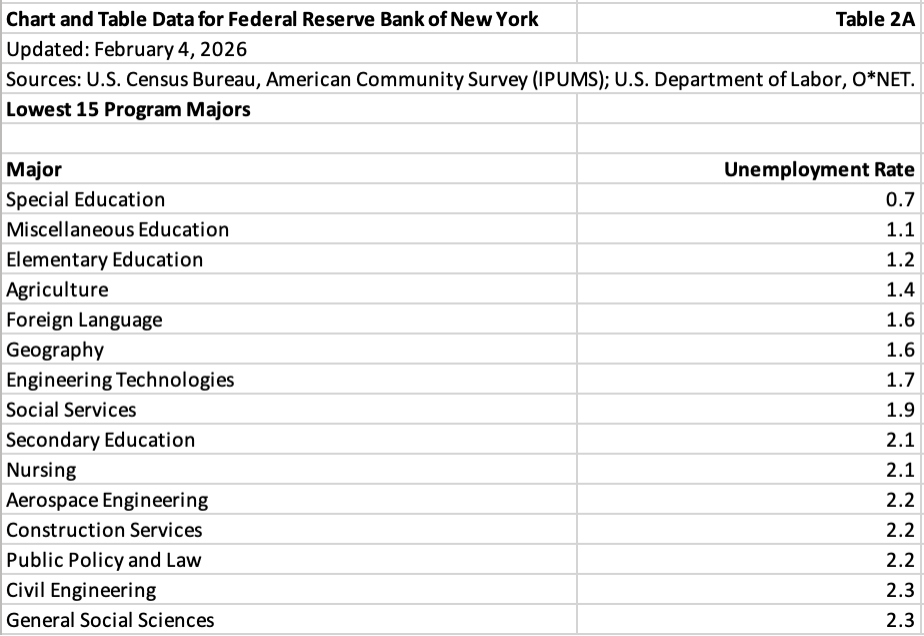
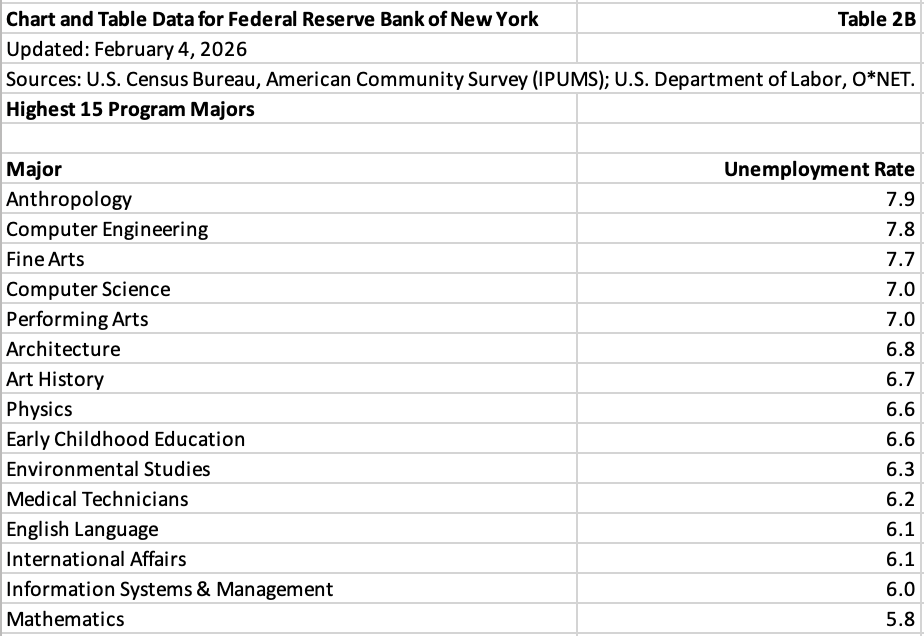
Table 2B provides the 15 highest (worst) program major unemployment rates. It did not surprise me that Anthropology majors had the highest unemployment rate, but it surprised me that six of the fifteen majors in this grouping were STEM programs. One explanation for the STEM programs in this table is that graduates of these programs may be more inclined to enroll in graduate school.
Underemployment Rates by Program Major
Table 3A provides the 15 lowest (best) program major underemployment rates. One key observation is that all but one of these programs (Miscellaneous Physical Sciences) match specific careers.
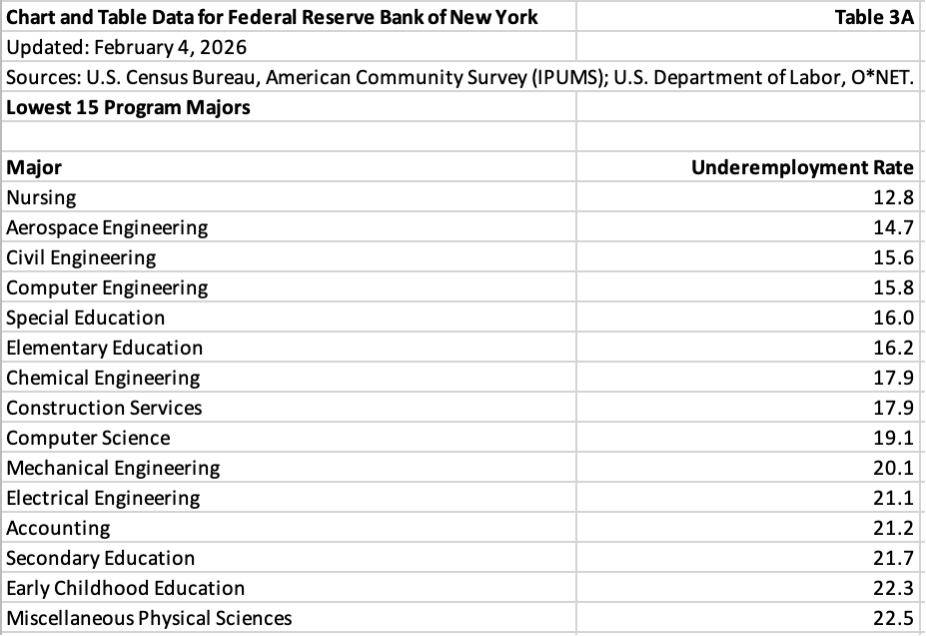
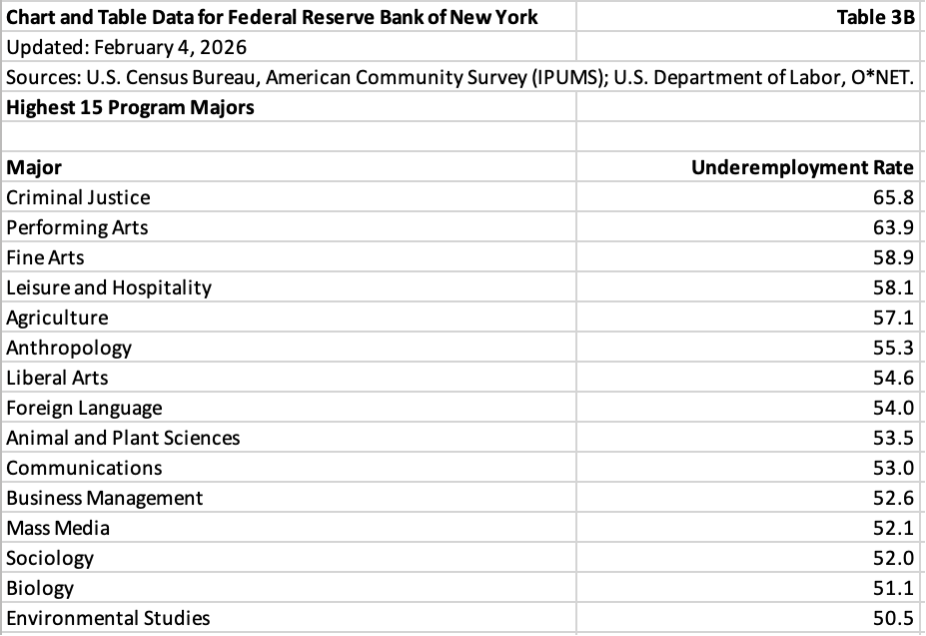
Table 3B provides the 15 highest (worst) underemployment program major underemployment rates. Notably, only one STEM program (Biology) was included in this table. Sadly, all 15 of these programs selected had underemployment rates greater than 50 percent, with Criminal Justice and Performing Arts the two highest at 65.8 percent and 63.9 percent. An explanation for Criminal Justice majors being in this grouping is that many police officers are hired without college degrees and are admitted into their respective city or state police academies assuming that they pass the physical fitness test. Criminal Justice program majors may be overqualified for those entry-level policy academy jobs.
Median Wage Early Career
Table 4A provides the 15 lowest (worst) median wage early-career program majors. Pharmacy and Biology were the only STEM programs included, and both require graduate degrees to achieve higher earnings. It was not surprising to see that education program majors were included in this group, as were social services and theology programs.
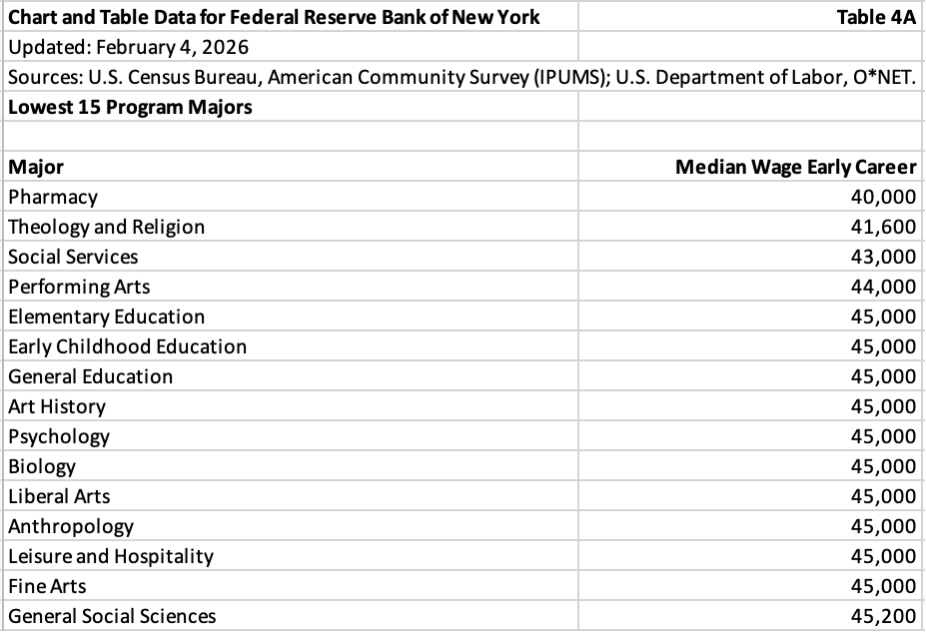
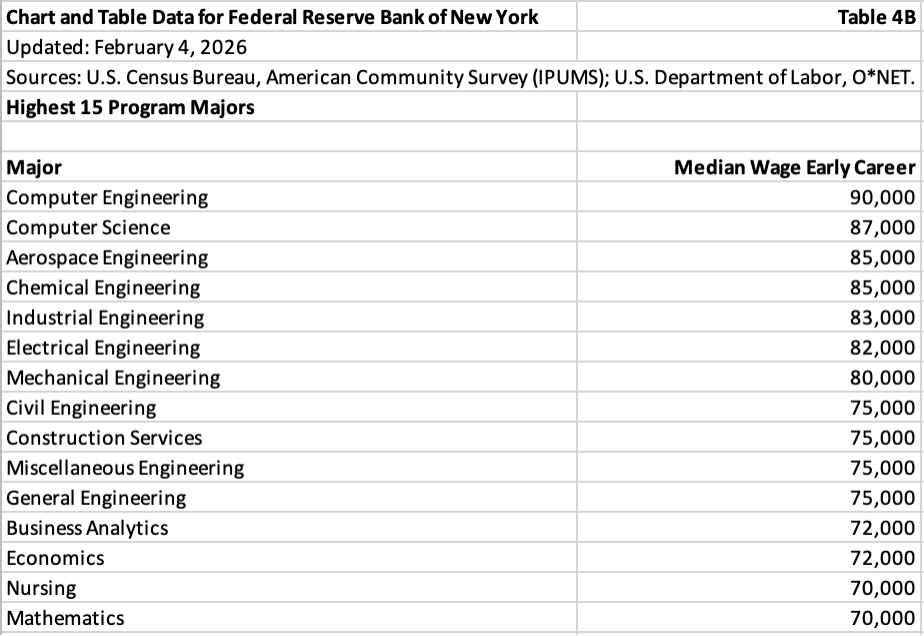
Table 4B provides the highest (best) 15 median wages by program major. All but two of these programs (Business Analytics and Economics) are STEM programs. All of the engineering programs, as well as nursing and construction services, are included.
Median Wage Mid-Career
Table 5A provides the lowest (worst) top 15 mid-career wages by program major. Six of the seven lowest programs are education programs (the other is social services). Many of these were included in the median wage early career low 15 as well. It’s no wonder that the average tenure of a new teacher is only five years. With early career and mid-career earnings in the bottom 20 percent of all program majors, a large percentage of education majors are opting for another career.
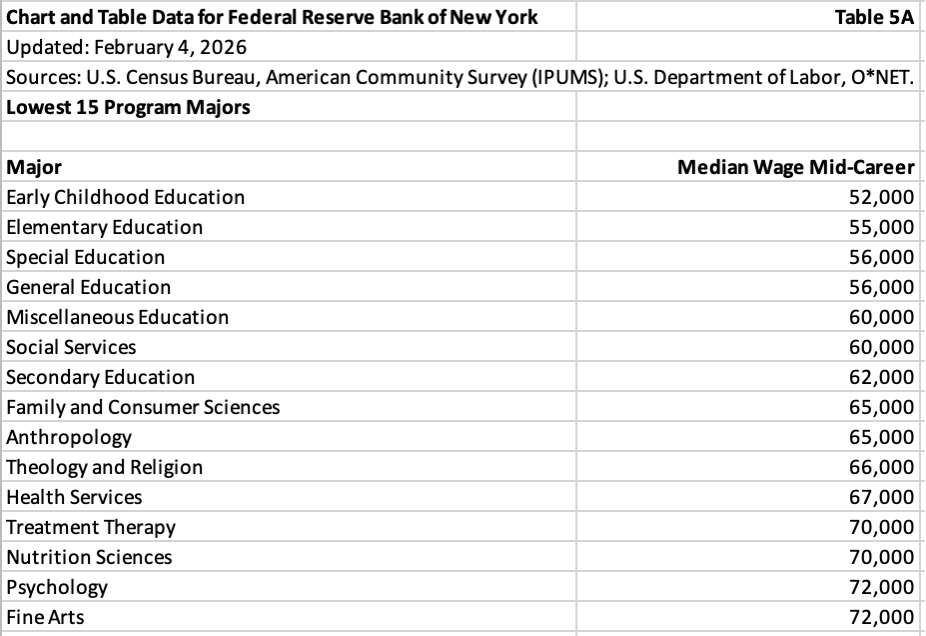
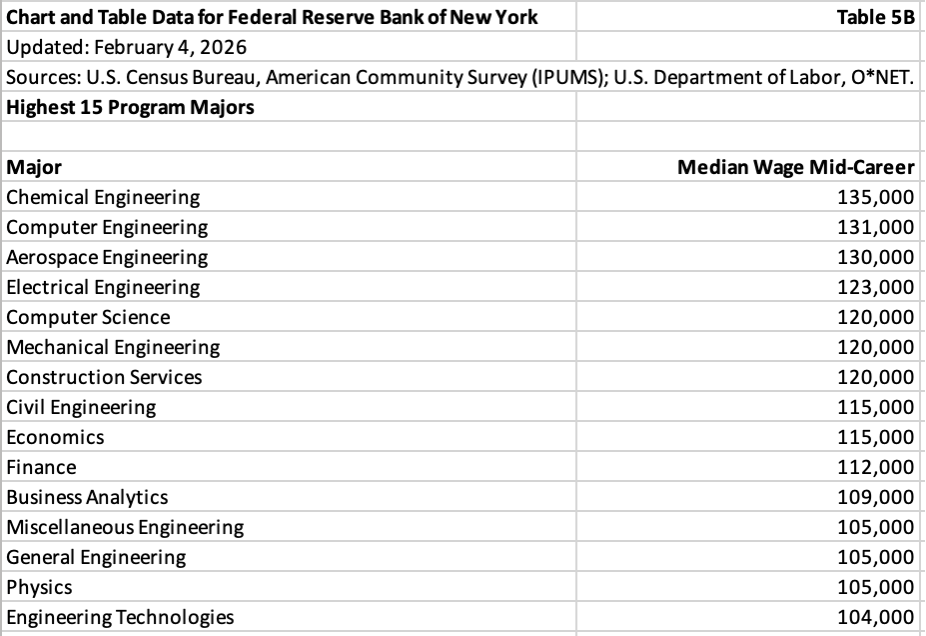
Table 5B provides the highest (best) Top 15 median wages for mid-career by program major. Only a couple of programs moved up into the Top 15. Almost all the engineering programs that were included in the top 15 for early-career remained in the top 15 for mid-career. Computer Science and Construction Services remained, and nursing dropped out of the top 15.
Percentage of Graduates Earning Graduate Degrees
Table 6A provides the 15 lowest program majors and the percentage of their graduates who go on to earn graduate degrees. At a glance, the inclusion of these 15 programs in this list is not surprising. Almost all of the careers that graduates of these specific programs match up with are careers that do not require a graduate degree to get ahead.
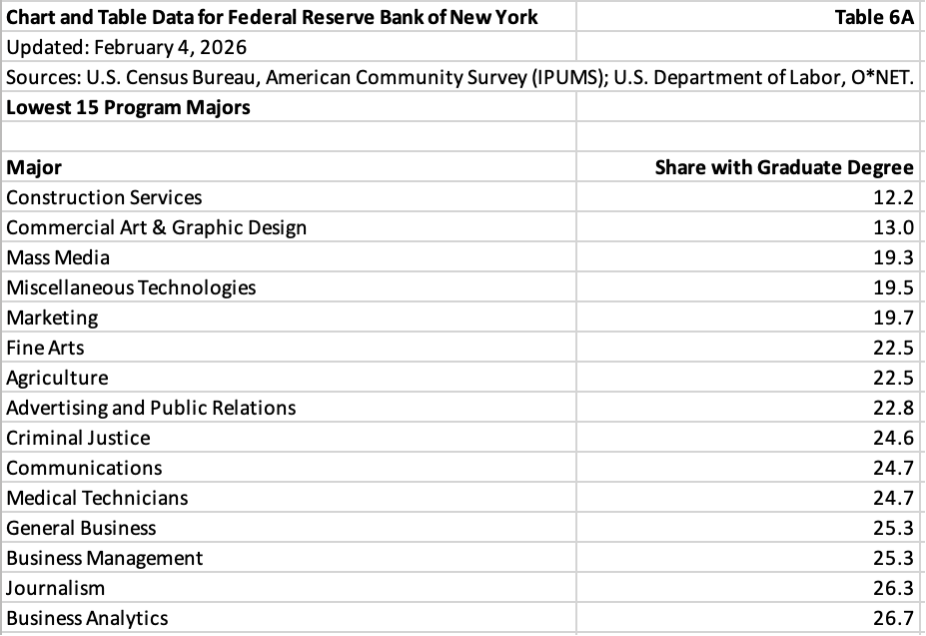
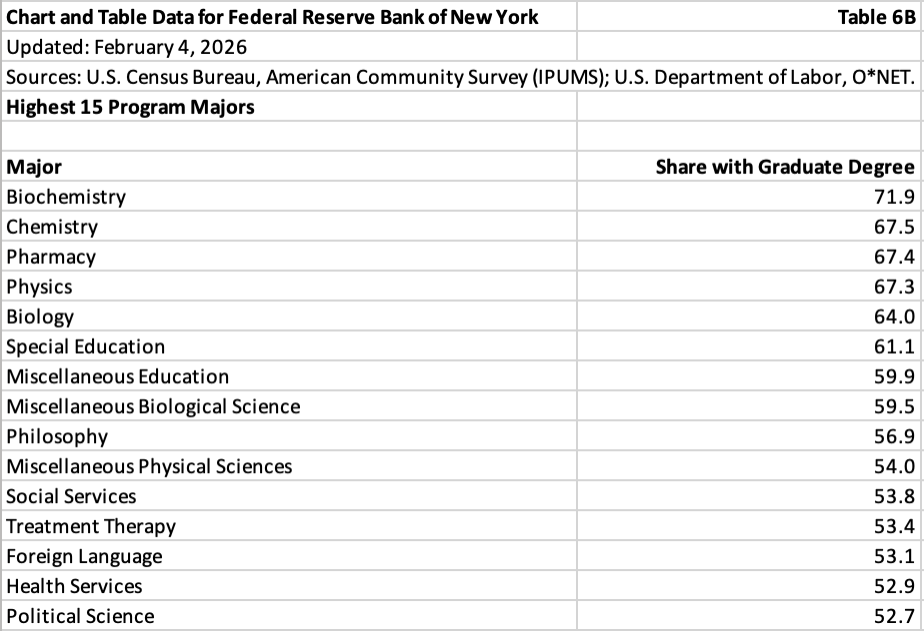
Table 6B provides a list of the top 15 programs with postgraduate degrees. None of these was a surprise. Some of these programs with a postgraduate degree lead to careers in medicine and law. Some professions may require a master’s degree to be licensed (Social Services).
Analysis of Overall Findings
The annual report of the New York Fed is oriented toward data presentation and not oriented toward detailed analysis and commentary. As I reviewed the data, I thought about ways in which I might be able to comment on the overall ranking of program majors using these five metrics.
I debated weighting the metrics equally versus differently. I decided to go with equal weighting because of the difficulty of accounting for the time value of money (early-career earnings versus mid-career earnings, as well as length of time unemployed or underemployed).
I opted to weight the highest/best outcome to 73 (there were 73 unique program majors in the dataset), sort the program majors from highest to lowest, and scale the numbers from 73 to 1.
I debated how to rank “Share with graduate degree”. I saw the merits of graduates pursuing graduate degrees from an academic and educated populace perspective. I opted to rank the programs with the lowest share of graduate degrees as the highest because those graduates did not have to spend time in graduate school or pay graduate school tuition.
Table 7 below shows the rankings of each category for all 73 program majors. The program majors are listed in order from the highest to the lowest aggregate points. Degrees oriented toward specific careers ranked highest. Economics was the only “traditional” liberal arts program included in the top 15 (top 20 percent), ranking 15th.
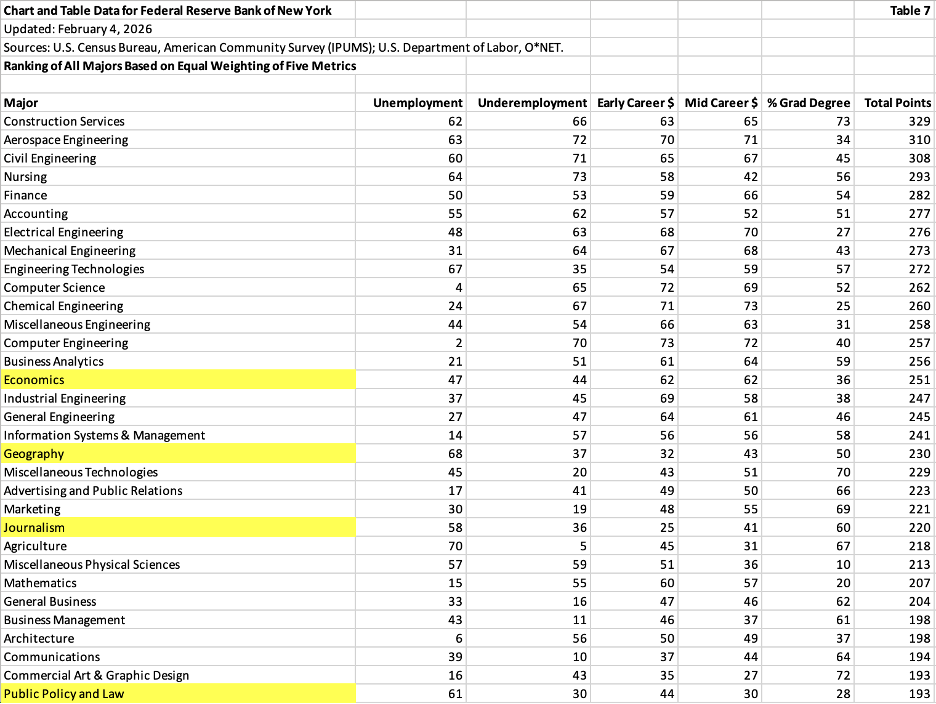
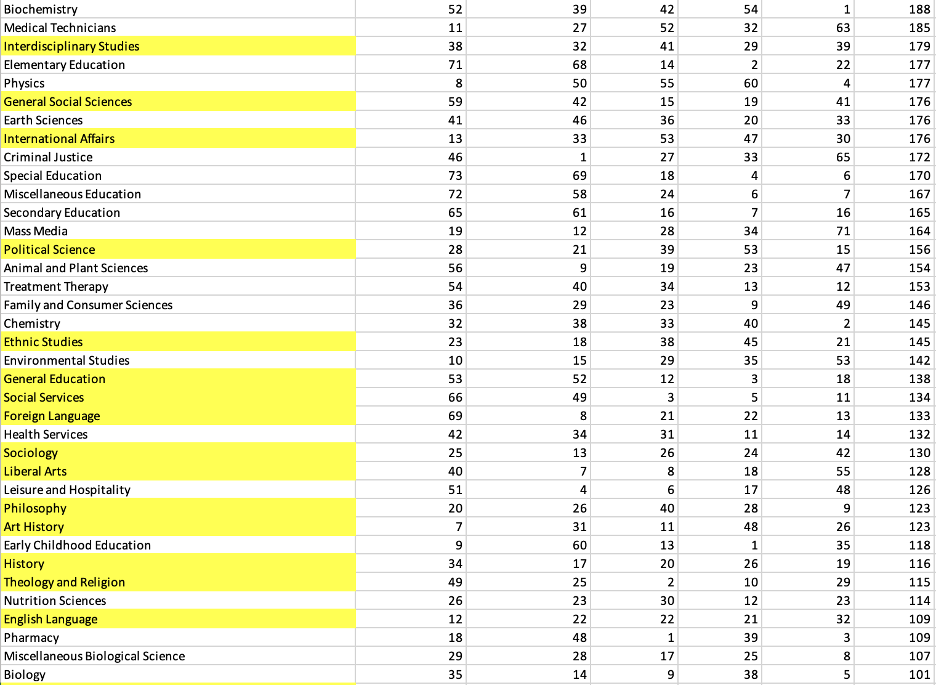

I highlighted traditional liberal arts programs in yellow. Most of them are below the median total points score of 177. If you look at the three lowest-scoring non-liberal arts programs (pharmacy, miscellaneous biological science, and biology), their percentages with graduate degrees are in the single digits (meaning that a large percentage have earned graduate degrees), which negatively affected their overall scores.
My Final Thoughts
The evidence that program major influences college graduates’ lifetime earnings is not new. The New York Fed’s report confirms that. At the same time, the rapid adoption of artificial intelligence (AI) into the workplace will impact recent college graduates. While the data looks gloomy now for most liberal arts graduates, the critical thinking skills they acquire during their education may be the ones employers actively seek.
Supply and demand also influence metrics like unemployment and underemployment. I can remember years when there were more newly minted engineers than relevant job openings for engineers. If all first-year college students consulted reports like the New York Fed’s and had the interest and academic ability to complete a STEM degree, the supply would change and likely outstrip the demand.
The World Economic Forum has predicted that tens of millions of jobs worldwide will be impacted by AI. That impact includes job incumbents and recent college graduates seeking employment. More and more, I’m convinced that schools and colleges should step up their career counseling and advising services. The more clarity they can provide students, the better prepared they will be as they navigate their program major choices. Colleges and universities should also consider tweaking their liberal arts programs, providing evidence of graduates acquiring critical thinking skills as well as evidence of graduates acquiring AI-utilization skills.


