
I had planned to take a break from writing about private colleges. Last week’s LinkedIn postings from several colleagues motivated me to read several articles about private four-year colleges in Iowa. The posts that I read discussed a proposed bill in Iowa that would allow two-year colleges to offer four-year degrees.
The four-year private colleges issued a statement that passage of the bill will cause many of them to close. Reporter Aisha Baiocchi in The Chronicle of Higher Education penned an article discussing more than 20 proposed bills in the Iowa legislature that will impact higher ed if passed. The two-year college expansion to four-year degrees is one of them.
Staying on track with the first articles I read about Iowa’s private colleges protesting the two-year colleges to offer four-year degrees bill, I thought I would review and discuss the Iowa private colleges’ scalability and selectivity along the lines that I have done with the states of Maryland, Virginia, Florida, and Pennsylvania. After that analysis, I’ll look at data from Iowa’s community colleges to see whether they pose a major threat, and, if so, whether there are any arguments available for the four-year colleges to oppose the expansion of degree granting capabilities for the two-year colleges.
The Fragility of Small Scale
In October 2025, Daniel Greenstein (Chancellor Emeritus of PASSHE) published Part 1 of a three-part series about the financial status of public and private institutions. Titled The Fragility of Small Scale, Mr. Greenstein used an “analytical engine” to look at data from 2010 to 2023 to evaluate the financial trajectory of an institution.
A sentence in the introductory paragraph could have been the lead line, stating, “Below about 2,500 students, fragility becomes structural.” Mr. Greenstein wrote that 70-75% of the private colleges whose enrollments are below 2,500 fall into the highest risk category; between 2,500 and 5,000, the risk falls to 60%; at 10,000-20,000, the risk falls to 30%; and above 50,000, it falls to less than 15%.
Greenstein wrote that small colleges don’t fail because they’re poorly managed. He blames most failures on “unforgiving economics.” He further wrote that “the fixed costs of accreditation, compliance, technology, student services, and marketing vary only marginally with small size.” The smaller the student enrollment that these costs are spread across, the more any financial issue can have catastrophic consequences.
I was concerned about the enrollment breakouts for Mr. Greenstein’s risk analysis. Since the publication of his articles, I have examined 77 private colleges and universities in Pennsylvania, 31 in Florida, 24 in Virginia, and 13 in Maryland. I added Iowa because of the discussions about two-year public institutions potentially competing with its four-year private colleges.
Like the other states I reviewed, Iowa has a private college association. It’s named the Iowa Association of Independent Colleges and Universities. There are 24 member institutions. I created tables for each member using data retrieved from College Navigator. For the mean, median, high, and low for the group, I included all colleges except Grinnell College, which was excluded for its selectivity.
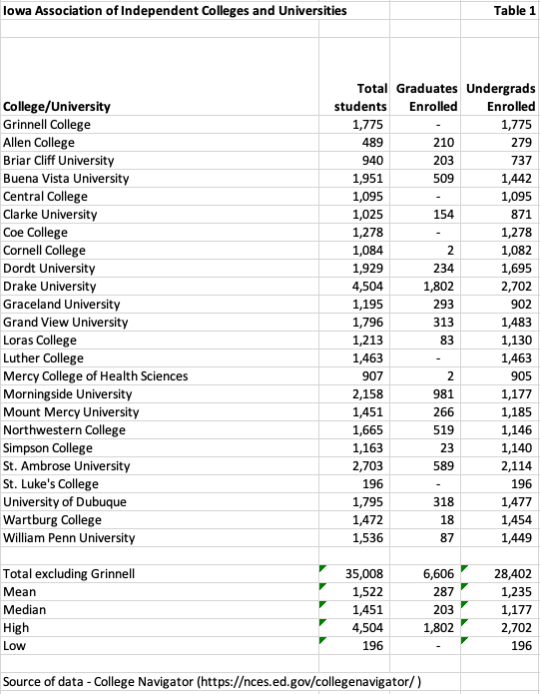
I listed the institutions and their total enrollment and undergraduate enrollment in Table 1 below. As you can see, only 2 of Iowa’s 24 private colleges and universities have enrollments that exceed 2,500. None of them exceeds 5,000 in enrollment (the next tier of risk at 60%).
Drake University has the highest total enrollment of 4,504 students. St. Ambrose University is the second largest, with approximately 2,703 total students. The third-highest enrollment is at Morningside University, with 2,158 students.
Four colleges have total enrollments under 1,000, with the lowest, St. Luke’s College, having only 196 undergraduate students. As mentioned, I excluded Grinnell College from calculations of the group’s mean, median, high, and low.
The mean total enrollment for the remaining 23 colleges and universities is 1,522, and the median total enrollment is 1,451. The high is Drake University at 4,504, and the low is St. Luke’s at 196 students.
Liquidity
According to Mr. Greenstein, more than 60% of the sub-2,500 group of colleges and universities operate with less than a year of unrestricted net assets. This compares to two-to-three years for mid-sized institutions and five plus for large research universities. More than 90 percent of Iowa’s private colleges and universities fall into this risk profile.
When a small private institution has a bad year of new student admissions, the downturn can set off a credit downgrade, pressure on debt-service, a draw on reserves, further tuition discounting to attract undecided and/or last-minute applicants, as well as further downturns.
Tuition Dependence and Price Compression
When 85-95 percent of your revenues are driven from tuition and fees, you expose yourself to even greater financial risks in a market with declining enrollments. I created two more tables of data for the 24 colleges and universities.
Table 2 illustrates the Total Cost of Attendance for each of the 23 institutions previously noted, along with the mean, median, high, and low. The mean ($37,008) and median ($37,050) tuition are similar, although the 23 schools range from a low of $17,664 at Mercy College of Health Sciences to a high of $54,666 at Coe College.
The mean ($52,831) and median ($54,956) Cost of Attendance (COA) follow that pattern. The low COA ($24,787) is at Allen College, and the high COA ($70,912) is at Coe College.

No analysis of the costs of private colleges is complete without looking at the average net price, which is the Total COA minus all grants. Table 3 below illustrates these numbers for the group. The mean ($23,147) and median ($23,530) average net prices are close. The institutions, however, range from a low of $12,771 (St. Luke’s College) to a high of $30,866 (Drake University).
I also like to review the average net price in the lowest income quintiles. While the mean and median across all five quintiles are similar, a gap is evident in the range between the high and low in each category. It’s disappointing to me that the median is $18,428 for the $0-30,000 quintile and $17,961 for the $30,001-48,000 quintile. In a perfect world, it should be $0 given the low earnings for a family of four in these quintiles. The low of $0 for the $0-$30,000 quintile is at St. Luke’s College. The high of $27,372 is at Drake University.
Notably, the average net price increases across the income spectrum as income rises. The biggest average net price jump is and should be from the fourth quintile to the highest quintile (from a median of $22,996 to $25,901). The highest jump from the fourth to the fifth quintile is at Grinnell College, which I excluded because of its selectivity. At Grinnell, the increase is from $16,891 to $36,265. This increase likely reflects a much higher average income in the $ 110,001-plus group at Grinnell than the $110,000 cap in the fourth quintile. The highest increase in the group of 23 belongs to Coe College, which increased from $20,555 to $27,413.
When the average net price is multiplied by the number of undergraduate students enrolled, the product accounts for 85-95% of total revenues for institutions without large endowment income or graduate students.
Although Mr. Greenstein emphasized the net price as the primary source of cash for institutions without large endowments, it’s also important to look at the discount percentage (1 minus the average net price divided by the total cost of attendance) to evaluate the impact of the market on pricing.
The mean and median average percentage discounts are 56% and 57% respectively. The institutions range from a low of 34% at Mercy College of Health Sciences to a high of 70% at Coe College. Institutions with very high admit percentages and single-digit enrollment percentages are clearly experiencing fierce market competition when they are offering discount percentages this high.

Enrollment and Market Reach
Small private colleges and universities recruit regionally, not nationally, writes Mr. Greenstein. Proximity matters. The number of high school graduates in Iowa is not growing like it is in Southern states like Florida. From 2010 to 2023, institutions with fewer than 2,500 students lost an average of 15% of enrollment, whereas the largest institutions grew enrollments. The larger institutions can leverage scale in marketing and recruiting, something the smaller institutions cannot. As mentioned earlier, less than 10 percent of Iowa’s private colleges and universities have more than 2,500 students. This is worse than the situation in Maryland, Virginia, and Pennsylvania, much less Florida.
Program Structure
Small colleges either have too narrow of an academic portfolio or too diffuse of an academic portfolio, notes Mr. Greenstein. College Navigator, the source of my data for these tables, has a section for each college/university titled Programs/Majors. Two examples illustrate his point.
St. Luke College, the smallest in terms of undergraduate enrollment, had 89 graduates majoring in 12 unique degree programs. In the most recent year, Luther College had approximately 343 graduates across 43 program categories. A narrow focus can restrict the number of students interested in your college. Too diffuse of a portfolio may generate instructional cost inefficiencies.
What Scale Buys
When enrollments reach or exceed 10,000 students, something shifts according to Mr. Greenstein’s analysis. Operating margins are positive. Tuition dependency is less than 60%. Endowment balances per FTE student increase, and external funding increases.
The efficiencies from scale allow institutions to buy the following:
- Revenue diversification among graduate programs, auxiliaries, philanthropy, and research
- Fixed cost overhead spread across more students
- Market elasticity – national reach offsets regional/local decline
- Brand leverage – selectivity sustains price integrity
None of Iowa’s 24 private colleges and universities exceeds 5,000 students much less 10,000 students.
The Leadership Paradox
There are a few small enrollment institutions that are not at risk, according to Mr. Greenstein. These are wealthy liberal arts colleges with large endowments and loyal alums.
Most presidents of small private colleges face the following challenges:
- Raise price and risk yield
- Cut price and erode margin
- Diversity and dilute mission, and/or
- Consolidate and lose identity.
The math doesn’t work well without scale. Collaborations offer some relief, but most colleges don’t have the flexibility to initiate them in a reasonable timeframe. Waiting deepens the financial decline, and few partnership opportunities are available to financially distressed institutions.
The Price of Admission
Daniel Greenfield followed up his research piece on scale with an article on admissions selectivity at private colleges and universities. He opened with, “Across nearly 1,000 private institutions, we see a simple, if sobering, pattern: as acceptance rates rise, financial resilience collapses.” He further wrote that the relationship is not linear but is exponential. “Beyond 50% acceptance, the decline becomes a free fall. By the time acceptance exceeds 75%, nearly 9 out of 10 institutions are considered high risk.”
I added to the tables of data for the 24 institutions that I created for his earlier paper. In Table 4 below, I have included College Navigator statistics on the number of applications, the percentage accepted, and the percentage that enroll for each institution. Again, I did not include Grinnell College in the mean and median statistics for the group. Two colleges have “NA” in their columns, indicating they did not provide admissions data but stated they have an open enrollment policy (meaning they admit all who apply).
Based on Greenfield’s research on admissions selectivity, many of Iowa’s private colleges and universities could be considered high risk. Excluding Grinnell, the lowest acceptance rate is 44% at St. Luke’s College, and two institutions are open enrollment, meaning they accept 100% of all applicants. The mean for the group is 78% and the median is 79%.
With such low aggregate selectivity, these institutions are high risk, according to Mr. Greenstein, because of their susceptibility to market forces. The market’s impact is evident in the group’s mean and median enrollment percentages of 25% and 18%, respectively.
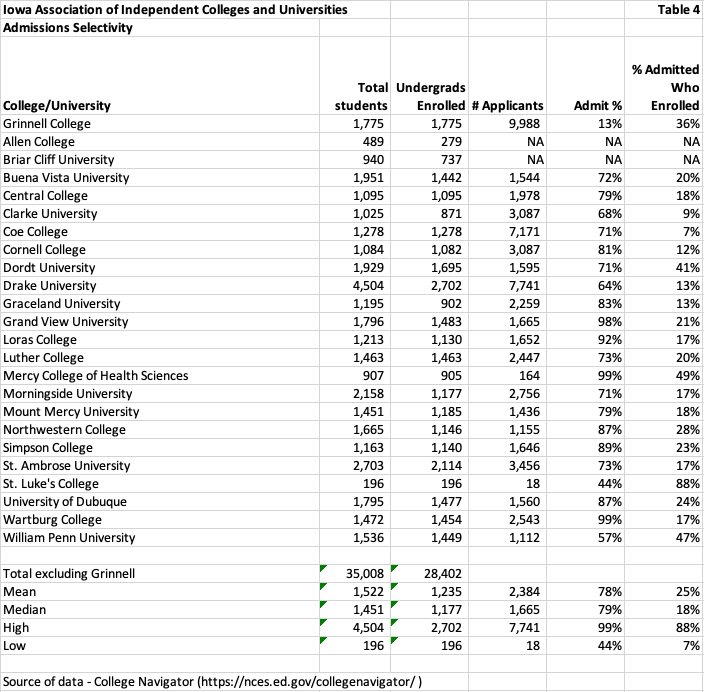
Greenstein’s paper discusses differences in financial risk among institutions with acceptance rates below 10%, between 10% and 25%, between 25% and 50%, and above 50% and above 75%. Grinnell was excluded due to its low acceptance rate (13%). St. Luke’s is the next most selective at 44%, and the next lowest is William Penn University at 57%.
When the acceptance rate goes above 50%, Greenstein writes that liquidity falls below 75% and tuition dependency exceeds 80%. Institutions are trapped in a spiral of shrinking enrollment, rising discounts, eroding net tuition, and collapsing unrestricted assets. By 75-85% acceptance, most institutions exhibit 3-5 signs of financial decline. At 85-100% acceptance, tuition accounts for 90% of revenue, reserves are almost nonexistent, and financial distress is structural rather than cyclical.
Selectivity matters because “it is a proxy for pricing power and brand elasticity.” Institutions have the power to control pricing without offsetting demand. Beyond 50% acceptance, the market sets tuition prices, and institutions’ margins decline as net price falls. Institutions with acceptance rates above 50% are in the higher education market segment, which is overcrowded and price-sensitive.
Some of this market effect is evidenced by the percentage of those admitted who enrolled. The median percentage for the group of 23 is 18%. Two colleges and universities have single-digit enrollment rates. At the same time, only one of the colleges has an enrollment percentage of 50% or better (St. Luke’s with 88%).
Mr. Greenstein discusses that each of the 1,000+ institutions in his dataset was scored across approximately 36 different financial and operational metrics. Among those were: liquidity, margin, tuition dependency, enrollment trend, and cost structure.
Risk archetypes appear in layers when institutions have low selectivity, writes Greenstein. Enrollment fragility and tuition dependency appear in nearly every institution. Academic program sprawl and financial distress appear as liquidity erodes.
Greenstein writes that the conclusion from this data analysis should not be that colleges need to increase their selectivity. Selectivity defines the institution’s structural position and the extent of its pricing power and market elasticity. Strategy should be guided by understanding that position, not trying to increase selectivity.
Greenstein recommends that institutions with an acceptance rate of more than 70% should consider scale initiatives such as:
- Collaborating with other institutions to share administrative and technology costs
- Specializing in mission or program areas where competition is low
- Diversifying through adult, online, or workforce-aligned programming
- Partnering with states or systems to simulate the economies of scale that you lack
He also recommends looking at financial restructuring or mergers before financial reserves are exhausted. Greenstein did not recommend adding graduate programs, but the third bullet could theoretically include graduate programs (in my opinion).
Where an institution is on the selectivity curve matters, writes Greenstein. Elite colleges have room to adjust their operating models without breaking. Open enrollment (100% acceptances) institutions do not. Institutions in the middle have too much cost to shrink and too little market to grow. Once the market takes over, the odds of recovery diminish rapidly.
Revenue Streams
Tuition-dependent institutions should be resourceful in their quest for stable or increasing revenues. In Capitalizing on College, author Joshua Travis Brown cites a college president who referred to his quest for diversifying revenues as his “Tabletop Strategy.” Additional markets, modes of operation, or degrees were referred to as adding legs to the existing table of operations. The more legs, the stronger the institution.
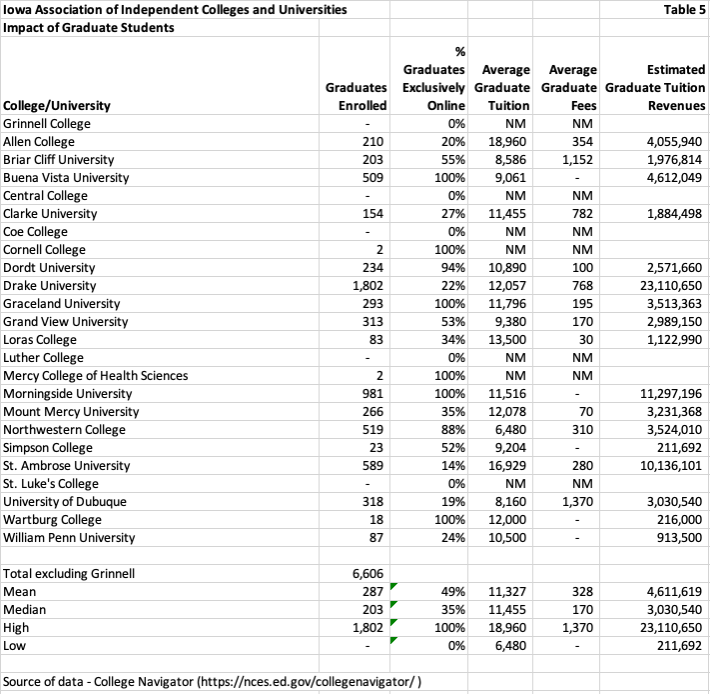
More than half of the IAICU institutions appear to be offsetting non-selective undergraduate enrollments with graduate enrollments. In Table 5 below, I used the average graduate tuition and fees for each institution and multiplied them by the number of graduate students to estimate graduate tuition revenue. While this may not account for financial aid or discounts, it’s a valuable tool for seeing how much revenue each institution is generating from its graduate programs.
With 1,802 graduate students, Drake University has an estimated $23 million in graduate revenues (the highest in the group). The mean ($4,611,619) and median ($3,030,540) estimated graduate tuition revenues for the other 23 colleges and universities are quite different but indicate how graduate tuition revenues can enhance the colleges’ financial situation. Morningside and St. Ambrose Universities, two of the least selective schools with undergraduate acceptance rates of 71% and 73%, respectively, receive $11 million and $10 million in annual graduate tuition revenue. There are seven colleges with no graduate students.
One of the first colleges or universities to receive accreditation approval for its online degrees was the University of Phoenix approximately 30 years ago. While many colleges are familiar with the online format (and even the holdouts adapted during the recent COVID pandemic), very few have successfully implemented it on a large scale.
College Navigator provides data regarding the percentage of undergraduate and graduate students who are studying exclusively online, partially online, or not online at all. I also included the percentage of graduate students who are completing their studies exclusively online in Table 5.
Six of the 24 colleges and universities enroll 100% of their graduate students exclusively online. Two more enroll approximately 90% of their graduate students exclusively online. Clearly, Iowa’s rural nature has led to increased graduate enrollment in online programs.
Another source of revenue diversification is adult education. Since many of these students enroll exclusively online, I did not attempt to create a chart from the enrollment-age data in College Navigator.
A Review of Iowa’s Community Colleges
I found a list of Iowa’s 16 community colleges and created a dataset with Tables like the analysis above. Here’s what I found.
Table 1 below lists the 16 colleges and their enrollments. I included a column for grad students even though I knew none of them offered graduate programs. Since the original purpose of this table was to see how many private colleges have enrollments greater than the 2,500 number cited by Mr. Greenstein, I thought the same rule of thumb might apply to community colleges.
Notably, enrollment at Iowa’s community colleges is higher than at its private colleges. The mean (5,321) and median (3,807) are higher. Des Moines Area Community College, the college with the highest enrollment at 24,418, exceeds the highest enrollment private college (Drake University) by a factor of more than five. The lowest enrollment college (685), Iowa Valley Community College District – Ellsworth, appears to be a branch location of the Marshalltown campus. There are five colleges in the group of 16 with enrollments greater than 5,000, the next break in scale risk cited by Greenstein.

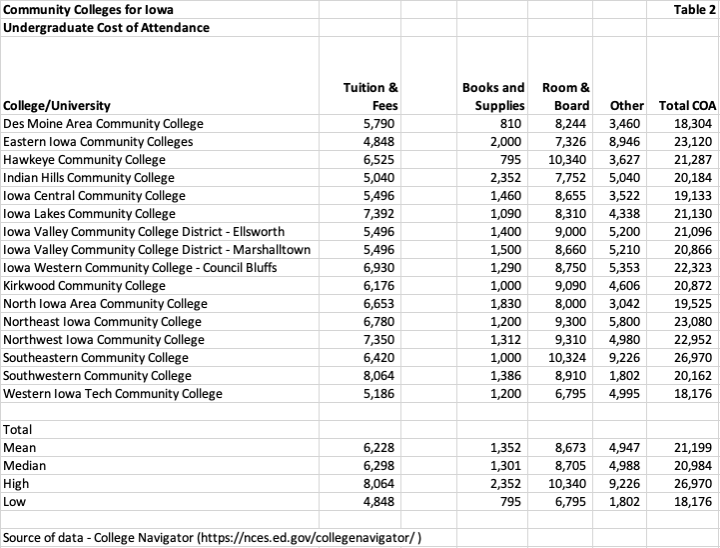
Cost of Attendance
Table 2 illustrates the Total Cost of Attendance for each of these institutions as well as the mean, median, high, and low for the group of 16. The mean ($6,228) and median ($6,298) tuition are very close with a range of $4,848 to $8,064. The mean ($21,199) and median ($20,984) COAs are nearly as close. The range between high and low is greater, with a low of $18,176 and a high of $26,970. The COAs for the community colleges include the costs of food and housing, whether on or off campus. At the same time, many students may continue to live at home and commute, thereby incurring lower costs than the published cost of attendance.
Tuition discounting is less prevalent at public community colleges, thanks to the subsidies they receive from the state. At the same time, the average net price is important to review. Table 3 below illustrates these numbers for the group.
The mean and median percentage discounts are 55% and 54%, respectively. While these discount rates are similar to the private colleges, their composition is vastly different. For the 16 community colleges, the average grant aid per student is $5,584, with a median of $5,660. The Department of Education includes Pell Grants in Grant Aid. The community colleges’ average Pell grant is a mean of $4,686 and a median of $4,678. Pell grants represent approximately 83% of the average grant.
In the case of Iowa’s private colleges, their average grant aid per student is a mean of $23,939 and a median of $24,560. The private colleges’ average Pell grant is a mean of $4,698 and a median of $4,891. However, the private colleges’ mean and median percentages of Pell students are 32%, while the community colleges’ mean and median are 44%. Pell grants account for approximately 20% of private college grant aid, serving a smaller percentage of students.

Program Structure
Community colleges offer programs of shorter length than four-year colleges, as well as programs with a more vocational focus. Des Moines Area Community College, the largest two-year school in Iowa, had 3,302 graduates of certificate programs in the most recent year and only 2,006 graduates with two-year degrees. Kirkwood Community College, the second-largest two-year school in Iowa, had 963 graduates from certificate programs in the most recent year and 1,475 graduates with two-year degrees. While the percentage of certificates versus degrees shifted between the two institutions, the fact remains that a substantial percentage of two-year college students attend for less than one year to earn a certificate.
Admissions Selectivity
Table 4 below shows that all 16 of Iowa’s community colleges are open-admission. They accept everyone. Open admission generally leads to lower graduation rates. However, the mean and median acceptance rates for Iowa’s private colleges are 78% and 79%, respectively. Other than Grinnell College, the group is not selective at all. What the community colleges lack in a modest difference in selectivity, they make up for in scale. Their higher enrollments are due to lower costs and shorter program lengths (certs and two-year degrees).

Final Thoughts
Iowa’s private colleges are in a bigger predicament from a scale and selectivity perspective than the private colleges in the four other states that I have analyzed, namely, Pennsylvania, Florida, Virginia, and Maryland. Part of the explanation is Iowa’s rural nature. There are fewer large cities, and even the ones that exist are not as large as those on the East Coast.
Iowa’s community colleges have a lower cost of attendance because the state partially subsidizes them. None of them have experience offering four-year degrees. Could they offer them? I have no doubts that the leadership teams at most of the community colleges could offer four-year degrees. Should they offer four-year degrees? That’s a tough question to answer.
Iowa’s private colleges have been offering four-year degrees for a long time. Their six-year graduation rate is 58%. Iowa’s community colleges have a three-year graduation rate of 40%.
There will be a negative impact to Iowa’s private colleges if the community colleges are able to offer four-year degrees. If I were a legislator in Iowa, I would consider establishing a pilot program for the state to allow community colleges to offer four-year degrees. I would work with the state’s education leader to establish location and competition as an important part of the analysis. Some states already regulate this through their public four-year colleges by prohibiting two competing programs (e.g., electrical engineering) within close geographic proximity.
More than half of Iowa’s four-year colleges are in the high-risk category outlined by Daniel Greenstein. Before the state creates a subsidized in-state competitor, they should assess the relative impact of each college (community college and public and private four-year) on each community and determine the best course of action for the best outcome for the state’s residents.


