Small private colleges have been the subject of numerous articles predicting their risk of closure. Whether it’s low enrollments, tuition discounting, or their fixed cost structure, the causes of financial decline are similar. In December 2023, I wrote an article summarizing some of the more recent publications forecasting these looming disasters as well as some suggestions for how these institutions might survive and even thrive.
Since then, I’ve generally focused my writing on small colleges and the percentage of students receiving tuition discounts. Tuition discounts are offsets to tuition revenues as well as to cash received from tuition revenues. In a highly competitive market where enrollments are declining and fixed costs are difficult to cut quickly, the impact of tuition discounting on cash collections needed to cover expenses is severe.
The Fragility of Small Scale
Last month, Daniel Greenstein (Chancellor Emeritus of PASSHE) published Part 1 of a three-part series about the financial status of public and private institutions. Titled The Fragility of Small Scale, Mr. Greenstein used an “analytical engine” to look at data for more than 1,000 institutions from 2010 to 2023 to evaluate the financial trajectory of those institutions.
A sentence in the introductory paragraph could have been the lead line: “Below about 2,500 students, fragility becomes structural.” Mr. Greenstein writes that 70-75% of the private colleges whose enrollments are below 2,500 fall into the highest risk category; between 2,500 and 5,000, the risk falls to 60%; at 10,000-20,000, the risk falls to 30%; and above 50,000, it falls to less than 15%.
Greenstein notes that small colleges don’t fail because they’re poorly managed. He blames most failures on “unforgiving economics.” He further writes that “the fixed costs of accreditation, compliance, technology, student services, and marketing vary only marginally with small size.” The smaller the student enrollment that these costs are spread across, the more any financial issue can have catastrophic consequences.
I was concerned about the enrollment breakouts for Mr. Greenstein’s risk analysis. I decided to look at the 13 private colleges and universities that comprise the membership of MICUA (Maryland Independent College and University Association). I selected MICUA’s members only because I lived in Maryland for many years and was familiar with most of its member institutions.
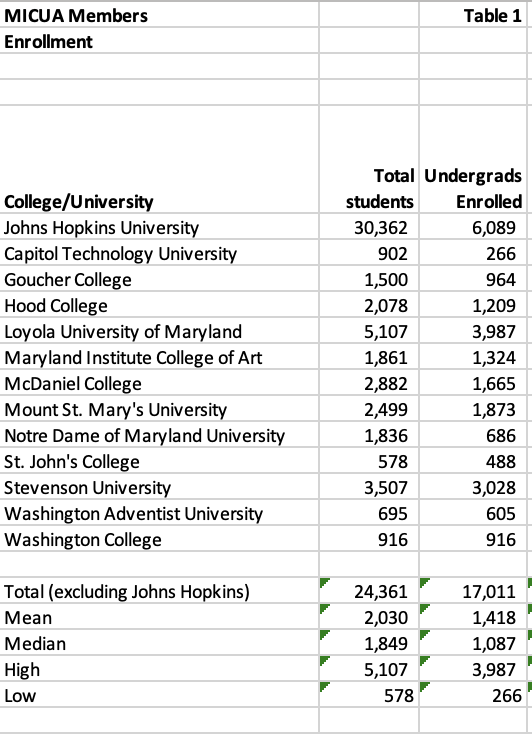
I listed the institutions and their total enrollment and undergraduate enrollment in Table 1 below. As you can see, only 5 of Maryland’s 13 private colleges and universities have enrollments that exceed 2,500. Johns Hopkins is the only one with a total enrollment exceeding 30,000, and Loyola University of Maryland is the next largest with just over 5,000 total students (5,107). Four colleges have total enrollments under 1,000.
Liquidity
According to Mr. Greenstein, more than 60% of the sub-2,500 group of colleges and universities operate with less than a year of unrestricted net assets. This compares to two to three years for mid-sized institutions and five years or more for large research universities.
When a small private institution experiences a sluggish year of new student admissions, the downturn can trigger a credit downgrade, increase pressure on debt service, deplete reserves, and intensify tuition discounting to attract undecided and/or last-minute applicants, potentially leading to further downturns.
Tuition Dependence and Price Compression
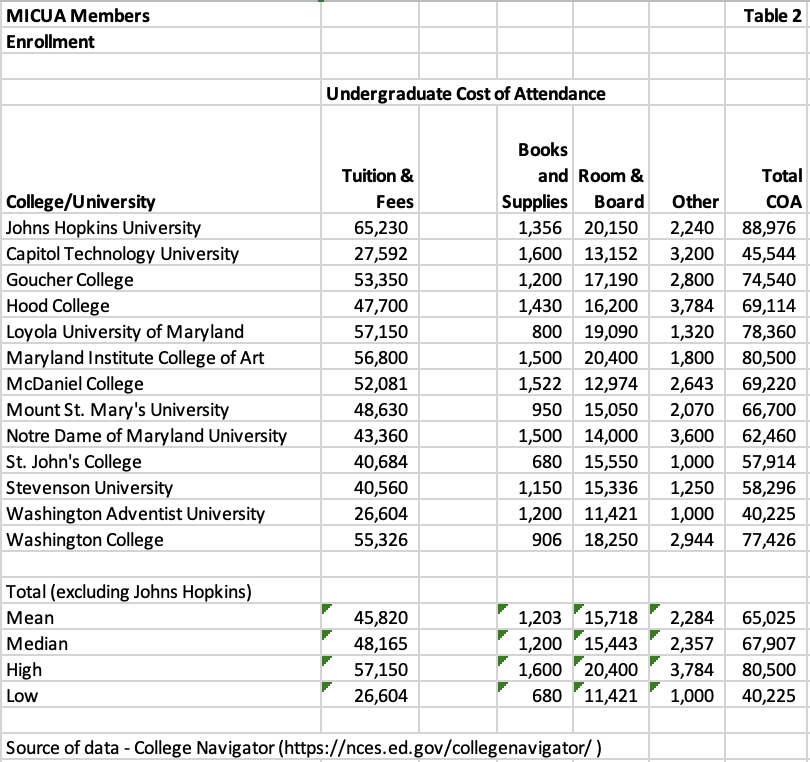
When 85-95 percent of your revenues are driven from tuition and fees, you expose yourself to even greater financial risks in a market with declining enrollments. I created two more tables of data for the 13 MICUA members. Table 2 illustrates the Total Cost of Attendance for each of these institutions as well as the Mean, Median, High, and Low for the 12 institutions other than Johns Hopkins University. The mean ($45,820) and median ($48,165) tuition are similar, although the group of 12 ranges from a low of $26,604 at Washington Adventist University to a high of $57,150 at Loyola University. The mean ($65,025) and median ($67,907) Cost of Attendance follow a similar pattern, although the Maryland Institute College of Art edges out Loyola for the highest Total COA.
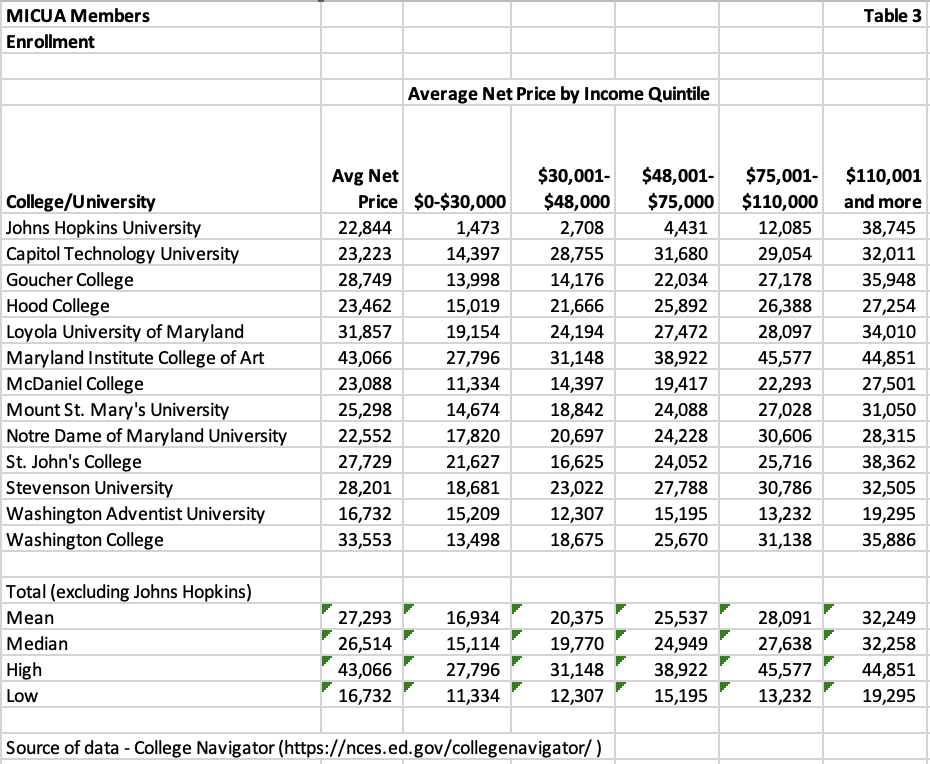
No analysis of the costs of private colleges is complete without looking at net price, which is the Total COA minus all grants. Table 3 below illustrates these numbers for the group. The mean ($27,293) and median ($26,514) average net price is very close. The institutions, however, range from a low of $16,732 (Washington Adventist) to a high of $43,066 (Maryland Institute College of Art).
Even though Johns Hopkins is excluded from the mean and median analysis, you can see the positive impact of large endowments from the average net price per income quintile where Hopkins’ net price of $1,473 for students whose families’ incomes are in the lowest ($0-30,000) quintile is far less than the mean ($16,394) and median ($15,114) for the other 12 institutions.
When these average net prices are multiplied by the number of undergraduate students enrolled, the product represents 85-95% of total revenues for institutions without large endowment income or graduate students. Going back to Table 1, there is only one institution (Washington College) without any graduate students. Tuition from graduate students is likely making a difference in survival for many of these institutions.
Enrollment and Market Reach
Small private colleges and universities recruit regionally, not nationally, writes Mr. Greenstein. Proximity matters. The number of high school graduates in the Mid-Atlantic area is not shrinking as much as it is in New England, but it’s not growing either. From 2010 to 2023, institutions with fewer than 2,500 students lost an average of 15% of their enrollment, whereas the largest institutions saw an increase in enrollment. Larger institutions can leverage scale in marketing and recruiting, a benefit that smaller institutions often struggle to achieve.
Program Structure
Small colleges either have too narrow of an academic portfolio or too diffuse of an academic portfolio, notes Mr. Greenstein. College Navigator, the source of my data for these tables, has a section for each college/university titled Programs/Majors. Two examples illustrate his point.
Capitol Technology University, the smallest in terms of undergraduate enrollment, has more than half of its undergraduates and 75% of its master’s students completing degrees in Computer and Information Systems. With approximately 900 undergraduates, Goucher College has 45 different program categories listed for 208 graduates in the most recent year. A narrow focus can restrict the number of students interested in your college. Too diffuse of a portfolio may generate instructional cost inefficiencies.
What Scale Buys
When enrollments reach or exceed 10,000 students, a shift occurs, according to Mr. Greenstein’s analysis. Operating margins are positive. Tuition dependency is less than 60%. Endowment balances per FTE student increase, and external funding increases.
The efficiencies from scale allow institutions to buy the following:
- Revenue diversification among graduate programs, auxiliaries, philanthropy, and research
- Fixed cost overhead spread across more students
- Market elasticity – national reach offsets regional/local decline
- Brand leverage – selectivity sustains price integrity
The Leadership Paradox
There are a few small enrollment institutions that are not at risk, Mr. Greenstein says. These are wealthy liberal arts colleges with large endowments and loyal alums.
Most presidents of small private colleges face the following challenges:
- Raise price and risk yield
- Cut price and erode margin
- Diversity and diluted mission
- Consolidate and lose identity
The math doesn’t work well without scale. Collaborations offer some relief, but most colleges lack the flexibility to initiate those partnerships within a reasonable timeframe. Waiting deepens the financial decline, and few partnership opportunities are available to financially distressed institutions.
If you asked me (or anyone else for that matter) if it is possible for the 12 MICUA members other than Johns Hopkins to reach 10,000 enrollments (to take advantage of scale and reduce their risk of financial demise), I think the answer would be “it’s unlikely.” While 10,000 may statistically be the ultimate threshold enrollment for scale according to Mr. Greenstein’s analysis, I think many of the MICUA colleges would welcome a few hundred additional undergraduate or graduate enrollments. Reaching 2,500 students removes the institution from the “structural” risk category. The incremental cash flow from those additional enrollments would make a big difference covering the fixed costs of operations and/or current operating deficits.
The Price of Admission
Daniel Greenfield followed up his research piece about scale with an article a month later about admissions selectivity in private colleges and universities. He opens with, “Across nearly 1,000 private institutions, we see a simple, if sobering, pattern: as acceptance rates rise, financial resilience collapses.” He further writes that the relationship is not linear but is exponential. “Beyond 50% acceptance, the decline becomes a free fall. By the time acceptance exceeds 75%, nearly 9 out of 10 institutions are considered high risk.”
I added to the tables of data for MICUA institutions that I created for his earlier paper. In Table 4 below, I have included College Navigator statistics for the number of applications, the percentage of accepted applications, and the enrollment rate for each institution. Again, I did not include Johns Hopkins University in the mean and median statistics for the group.
Based on Greenfield’s research on admissions selectivity, many of Maryland’s private colleges and universities could be considered high risk. Excluding Hopkins, the lowest acceptance rate is 44% at St. John’s College, and the highest is 86% at Notre Dame of Maryland University. The mean for the group is 72% and the median is 77%.
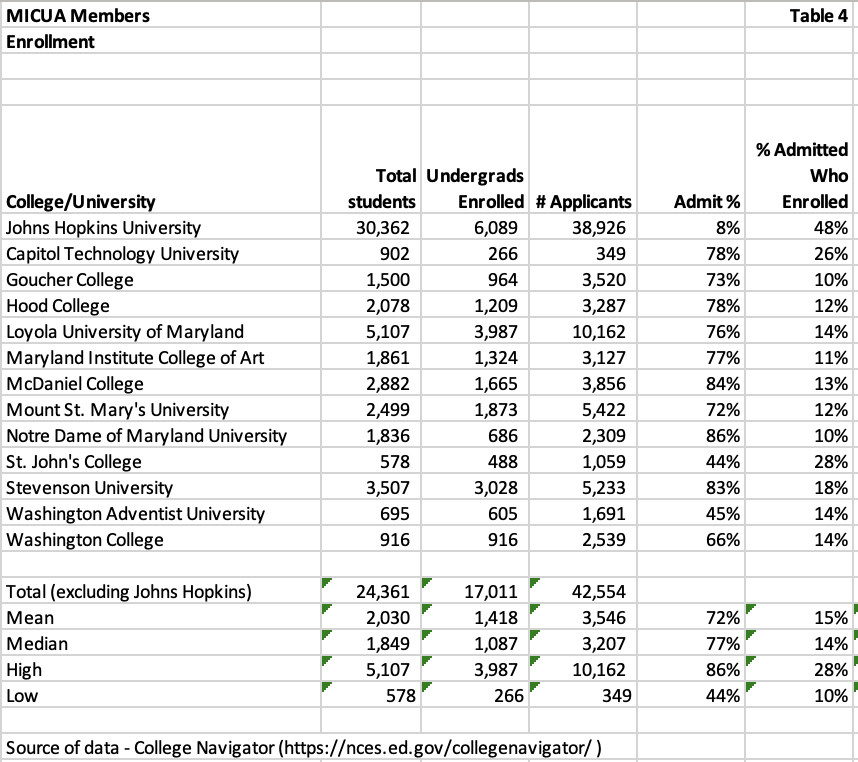
Greenstein’s paper discusses the differences in financial risk at institutions with acceptance rates below 10%, those between 10% and 25%, those between 25% and 50%, and those above 50% and those above 75%. Note again that Hopkins is the sole single-digit acceptance institution, and St. John’s and Washington Adventist are the only other institutions with acceptance rates below 50%, at 44% and 45%, respectively.
When the acceptance rate exceeds 50%, Greenstein notes that liquidity falls below 75% and tuition dependency surpasses 80%. Institutions are trapped in a spiral of shrinking enrollment, rising discounts, eroding net tuition, and collapsing unrestricted assets. When achieving a 75-85% acceptance rate, most institutions typically exhibit 3-5 signs of financial decline. At an 85-100% acceptance rate, tuition generates 90% of revenue, reserves are almost non-existent, and financial distress is structural, not cyclical.
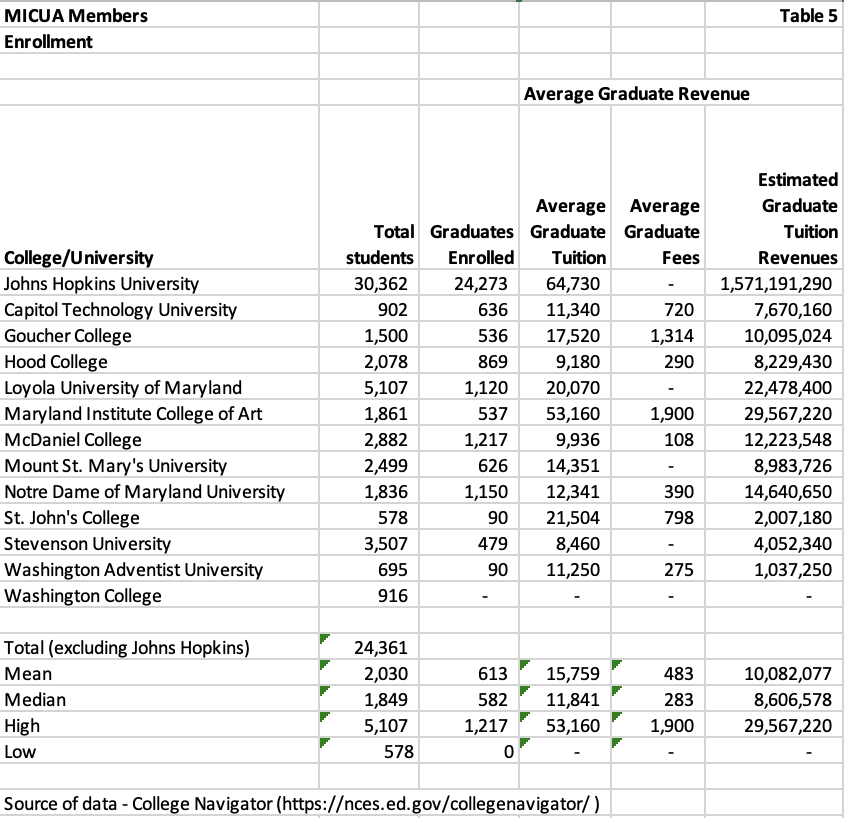
Naturally, there are always exceptions, and it appears that some MICUA institutions are offsetting non-selective undergraduate enrollments with graduate enrollments. In Table 5 below, I used the average graduate tuition and fees for each institution and multiplied it by the number of graduate students to derive an estimated graduate tuition revenue. While this may not account for financial aid or discounts, it’s a relatively useful tool for determining how much revenue each institution generates from its graduate programs.
Once again, Johns Hopkins is off the charts. Maryland’s highly selective research university has an estimated $1.5 billion in graduate revenues. The mean ($10,082,077) and median ($8,606,578) estimated graduate tuition revenues for the other 12 colleges and universities are very different but indicate how significant graduate tuition revenues could enhance the colleges’ financial situation.
The range of estimated graduate tuition revenues for the other 12 institutions goes from a high of $29,567,220 at the Maryland Institute College of Art to a low of $0 at Washington College.
Selectivity matters because “it is a proxy for pricing power and brand elasticity.” Institutions have the power to control pricing without offsetting demand. Beyond 50% acceptance, the market sets the tuition price, and institutions’ margins decline as the net price decreases. Institutions with acceptance rates of more than 50% are part of the higher education market that is overcrowded and price-sensitive.
Mr. Greenstein discusses that each of the 1,000+ institutions in his dataset was scored across approximately 36 different financial and operational metrics. Among these were liquidity, margin, tuition dependency, enrollment trends, and cost structure.
Risk archetypes appear in layers when institutions have low selectivity, writes Greenstein. Enrollment fragility and tuition dependency appear in nearly every institution. Academic program sprawl and financial distress appear as liquidity erodes.
Greenstein writes that the conclusion from this data analysis should not be that colleges need to increase their selectivity. Selectivity defines the institution’s structural position, as well as the pricing power and market elasticity it commands. Strategy should be guided by understanding that position, not trying to increase selectivity.
Greenstein recommends that institutions with an acceptance rate of more than 70% should consider scale initiatives such as:
- Collaborating with other institutions to share administrative and technology costs
- Specializing in mission or program areas where competition is low
- Diversifying through adult, online, or workforce-aligned programming
- Partnering with states or systems to simulate the economies of scale that you lack
He also recommends considering financial restructuring or mergers before financial reserves are depleted. Greenstein did not recommend adding graduate programs, but the third bullet could theoretically include graduate programs.
Where an institution is on the selectivity curve matters, writes Greenstein. Elite colleges have room to adjust their operating models without breaking. Open enrollment institutions (with 100% acceptance rates) do not. Institutions in the middle have too much cost to shrink and too little market to grow. Once the market takes over, the odds of recovery diminish rapidly. If increasing selectivity is not an option or a possibility, I would focus my marketing initiatives on the second and third bullets.
A Few More Thoughts
I found both of Mr. Greenstein’s studies to be informative. While some of the findings are intuitive (increased tuition discounting leads to decreased operating margins, for example), having a dataset of over 1,000 institutions to use for analysis is impressive. Building my own small dataset utilizing enrollment, tuition, net price, and admissions selectivity for 15 private institutions in Maryland allowed me to grasp the significance of Greenstein’s findings as well as the market situation impacting many of our private institutions.
I’m sure that most senior administrators working for at-risk private institutions are aware of many of these challenges. Finding and implementing solutions for sharing overhead expenses is difficult, but not impossible. Breaking away from the market when your admissions are not selective and focusing on niche programs or new programs (such as online programs or graduate degrees) may be harder. The findings of Greenstein’s research may be more relevant for their board members as they consider strategies for success or survival.