[Note: This article follows the format from a previous article commenting on Daniel Greenstein’s analysis of more than 1,000 private colleges across the U.S., and my thoughts about his analysis utilizing data from 15 private colleges and universities in Maryland. I opted to create additional data tables from 24 private colleges and universities in Virginia, Maryland’s neighboring state, to see if the data was similar.]
Small private colleges have been the subject of many articles predicting their risks of closing. Whether it’s low enrollments, tuition discounting, or their fixed cost structure, the causes of financial decline are similar. In December 2023, I wrote an article summarizing some of the more recent publications forecasting these looming disasters.
Since then, I’ve generally focused my writing on small colleges, specifically on the percentage of students receiving tuition discounts. Tuition discounts are offsets to tuition revenues as well as to cash received from tuition revenues. In a highly competitive market where enrollments are declining and fixed costs are difficult to cut quickly, the impact of tuition discounting on cash collections needed to cover expenses is severe.
The Fragility of Small Scale
Last month, Daniel Greenstein (Chancellor Emeritus of PASSHE) published Part 1 of a three-part series about the financial status of public and private institutions. Titled The Fragility of Small Scale, Mr. Greenstein used an “analytical engine” to look at data from 2010 to 2023 to evaluate the financial trajectory of an institution.
A sentence in the introductory paragraph could have been the lead line, stating, “…below about 2,500 students, fragility becomes structural.” Mr. Greenstein writes that 70-75% of the private colleges whose enrollments are below 2,500 fall into the highest risk category; between 2,500 and 5,000, the risk falls to 60%; at 10,000-20,000, the risk falls to 30%; and above 50,000, it falls to less than 15%.
Greenstein writes that small colleges don’t fail because they’re poorly managed. He blames most failures on “unforgiving economics.” He further writes that “the fixed costs of accreditation, compliance, technology, student services, and marketing vary only marginally with small size.” The smaller the student enrollment that these costs are spread across, the more any financial issue can have catastrophic consequences.
I was concerned about the enrollment breakouts for Mr. Greenstein’s risk analysis. I decided to look at the 24 private colleges and universities with undergraduate students that comprise the membership of the Council of Independent Colleges in Virginia (CICV). I selected CICV’s members because of its proximity to Maryland, a state I had earlier analyzed.
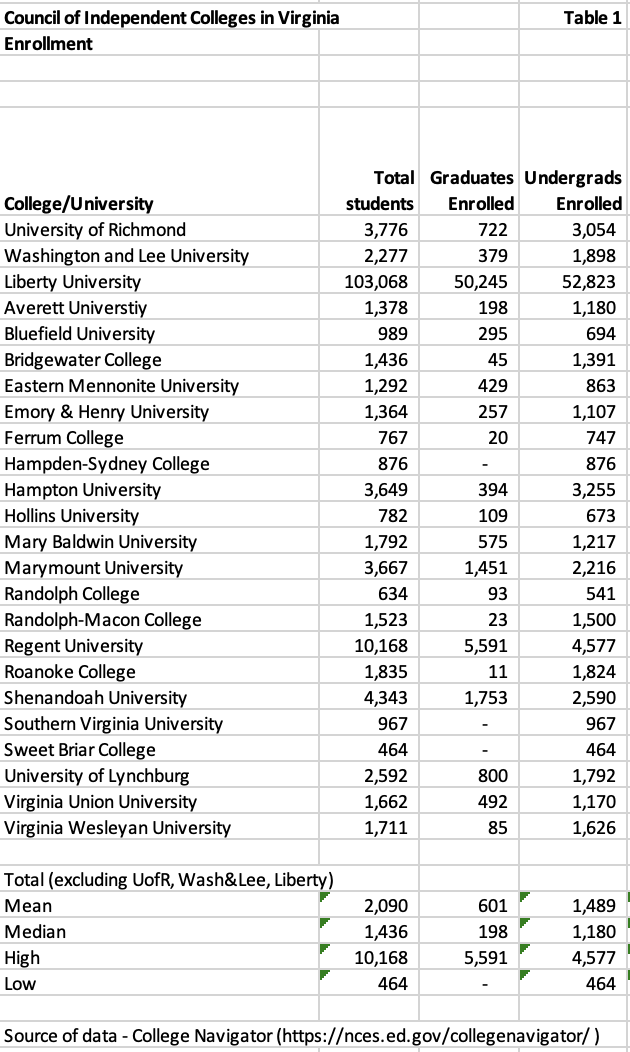
I listed the institutions and their total enrollment and undergraduate enrollment in Table 1 below. As you can see, only seven of Virginia’s 24 private colleges and universities have enrollments that exceed 2,500. Liberty University has a total enrollment exceeding 100,000 students (74% of its undergrads attend online only, and 96% of its grad students attend online). Regent University is the next largest with just over 10,000 total students (approximately 75% of Regent’s undergraduate students attend online, and almost 90% of its graduate students attend online). After Regent, the next highest enrollment belongs to Shenandoah University with 4,343 students.
Seven colleges have total enrollments under 1,000, with the lowest, Sweet Briar College, having only 464 undergraduate students. I excluded the University of Richmond, Washington & Lee University, and Liberty University from calculations of the mean, median, high, and low for the group.
Liberty was excluded due to its extremely high enrollment. The University of Richmond and Washington and Lee were excluded due to their enormous endowments and high selectivity, which will be discussed later.
Excluding those three universities, the mean total enrollment for the remaining 21 colleges and universities is 2,090, with a median total enrollment of 1,436. The high is Regent University at 10,168, and the low is Sweet Briar at 464 students.
Liquidity
According to Mr. Greenstein, more than 60% of the sub-2,500 group of colleges and universities operate with less than a year of unrestricted net assets. This compares to two to three years for mid-sized institutions and five years or more for large research universities.
When a small private institution experiences a poor year of new student admissions, the downturn can trigger a credit downgrade, pressure on debt service, a draw on reserves, further tuition discounting to attract undecided and/or last-minute applicants, and additional downturns.
Tuition Dependence and Price Compression
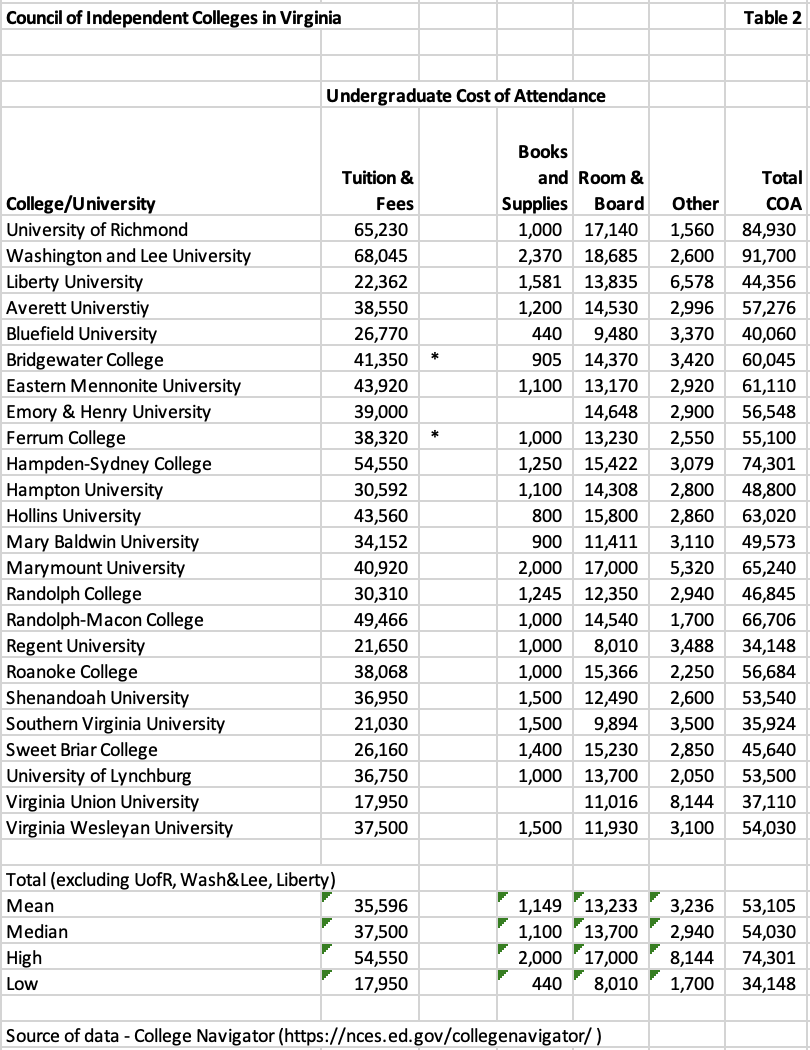
When 85-95 percent of your revenues are driven from tuition and fees, you expose yourself to even greater financial risks in a market with declining enrollments. I created two more tables of data for the 24 CICV members. Table 2 illustrates the Total Cost of Attendance for each of these institutions, as well as the Mean, Median, High, and Low Values for the 21 institutions other than the University of Richmond, W&L, and Liberty. The mean ($35,596) and median ($37,500) tuition are similar, although the group of 21 ranges from a low of $17,950 at Virginia Union University to a high of $54,550 at Hampden-Sydney College. The mean ($53,105) and median ($54,030) Cost of Attendance follow that pattern, except the low COA ($34,148) is at Regent University, whose students attend primarily online.
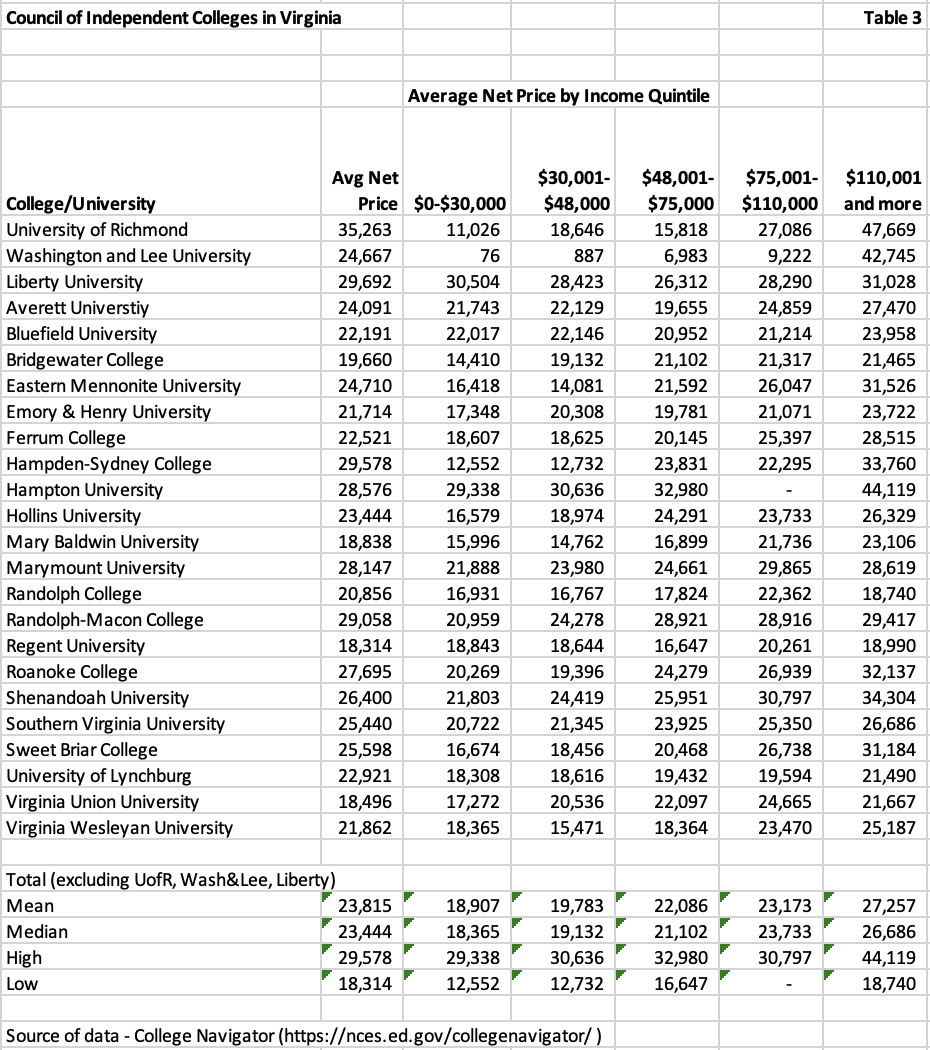
No analysis of the costs of private colleges is complete without looking at net price, which is the Total COA minus all grants. Table 3 below illustrates these numbers for the group. The mean ($23,815) and median ($23,444) average net prices are very close (note that these numbers are approximately $3,000 lower than the numbers for Maryland’s private colleges). The institutions, however, range from a low of $18,314 (Regent University, primarily an online institution) to a high of $29,578 (Hampden-Sydney College).
Even though three universities are excluded from the mean and median analysis, you can see the positive impact of large endowments from the average net price per income quintile where Washington & Lee’s net cost of $76 for students whose families’ incomes are in the lowest ($0-30,000) quintile is far less than the mean ($18,907) and median ($18,365) for the other 21 institutions.
When these average net prices are multiplied by the number of undergraduate students enrolled, the product represents 85-95% of total revenues for institutions without significant endowment income or graduate students. Referring back to Table 1, there are only three institutions (Sweet Briar, Hampden-Sydney, and Southern Virginia) that do not have any graduate students. Tuition from graduate students is making a difference in survival for some of these institutions.
Enrollment and Market Reach
Small private colleges and universities recruit regionally, not nationally, writes Mr. Greenstein. Proximity matters. The number of high school graduates in the Mid-Atlantic area is not shrinking as much as it is in New England, but it’s not growing either. From 2010 to 2023, institutions with fewer than 2,500 students lost an average of 15% of enrollment, whereas the largest institutions grew enrollments. Larger institutions can leverage scale in marketing and recruiting, a benefit that smaller institutions often struggle to achieve.
Program Structure
Small colleges either have too narrow an academic portfolio or too diffuse an academic portfolio, notes Mr. Greenstein. College Navigator, the source of my data for my previous article on this subject and these tables, has a section for each college/university titled Programs/Majors. Two examples illustrate his point.
Sweet Briar College, the smallest in terms of undergraduate enrollment, had 72 graduates majoring in 15 unique degree programs. With approximately 453 graduates, Washington and Lee offers 37 different program categories, as listed in the most recent year. A narrow focus can restrict the number of students interested in your college. A too diffuse portfolio may generate instructional cost inefficiencies. In W&L’s case, its endowment balance is subsidizing some of its very low-enrollment programs.
What Scale Buys
When enrollments reach or exceed 10,000 students, a shift occurs, according to Mr. Greenstein’s analysis. Operating margins are positive. Tuition dependency is less than 60%. Endowment balances per FTE student increase, and external funding increases.
The efficiencies from scale allow institutions to buy the following:
- Revenue diversification among graduate programs, auxiliaries, philanthropy, and research.
- Fixed cost overhead is spread across more students.
- Market elasticity – national reach offsets regional/local decline
- Brand leverage – selectivity sustains price integrity
The Leadership Paradox
According to Mr. Greenstein, there are a few small enrollment institutions that are not at risk. These are wealthy liberal arts colleges with large endowments and loyal alums. In Virginia, Washington and Lee, and the University of Richmond fall into this not-at-risk category.
Most presidents of small private colleges face the following challenges:
- Raise price and risk yield
- Cut price and erode margin
- Diversify and dilute mission
- Consolidate and lose identity
The math doesn’t work well without scale. Collaborations offer some relief, but most colleges lack the flexibility to initiate those partnerships within a reasonable amount of time. Waiting deepens the financial decline, and few partnership opportunities are available to financially distressed institutions.
The Price of Admission
Daniel Greenfield followed up his research piece about scale with an article about admissions selectivity in private colleges and universities. He opens saying, “Across nearly 1,000 private institutions, we see a simple, if sobering, pattern: as acceptance rates rise, financial resilience collapses.” He further writes that the relationship is not linear but is exponential. “Beyond 50% acceptance, the decline becomes a free fall. By the time acceptance exceeds 75%, nearly 9 out of 10 institutions are considered high risk.
I added to the tables of data for CICV institutions that I created for his earlier paper. In Table 4 below, I have included College Navigator statistics for the number of applications, the percentage accepted, and the percentage that enroll for each of the institutions. Again, I did not include Liberty, the University of Richmond, and W&L in the mean and median statistics for the group.
Based on Greenfield’s research on admissions selectivity, many of Virginia’s private colleges and universities could be considered high risk. Excluding the three institutions previously mentioned, the lowest acceptance rate is 41% at Regent’s University. Four institutions (Eastern Mennonite, Ferrum, Mary Baldwin, and Southern Virginia) are open-enrollment, meaning they accept 100% of all applicants. The mean for the group is 78% and the median is 81%.
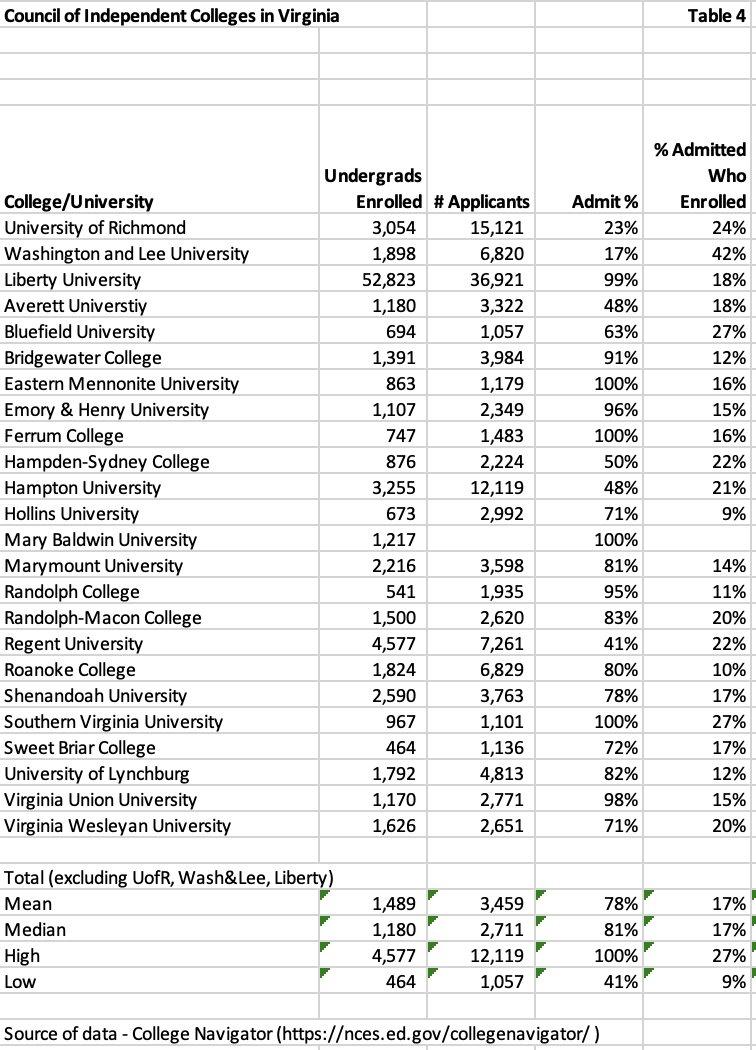
Greenstein’s paper discusses the differences in financial risk at institutions with acceptance rates below 10%, those between 10% and 25%, those between 25% and 50%, and those above 50% and those above 75%. Note that no private institution in Virginia has a single-digit acceptance rate, and W&L (17%) and the University of Richmond (23%) are the only other institutions below 40%.
When the acceptance rate exceeds 50%, Greenstein notes that liquidity falls below 75% and tuition dependency surpasses 80%. Institutions are trapped in a spiral of shrinking enrollment, rising discounts, eroding net tuition, and collapsing unrestricted assets. By reaching a 75-85% acceptance, most institutions exhibit 3-5 signs of financial decline. At 85-100% acceptance, tuition accounts for 90% of revenue, reserves are almost nonexistent, and financial distress is structural, not cyclical.
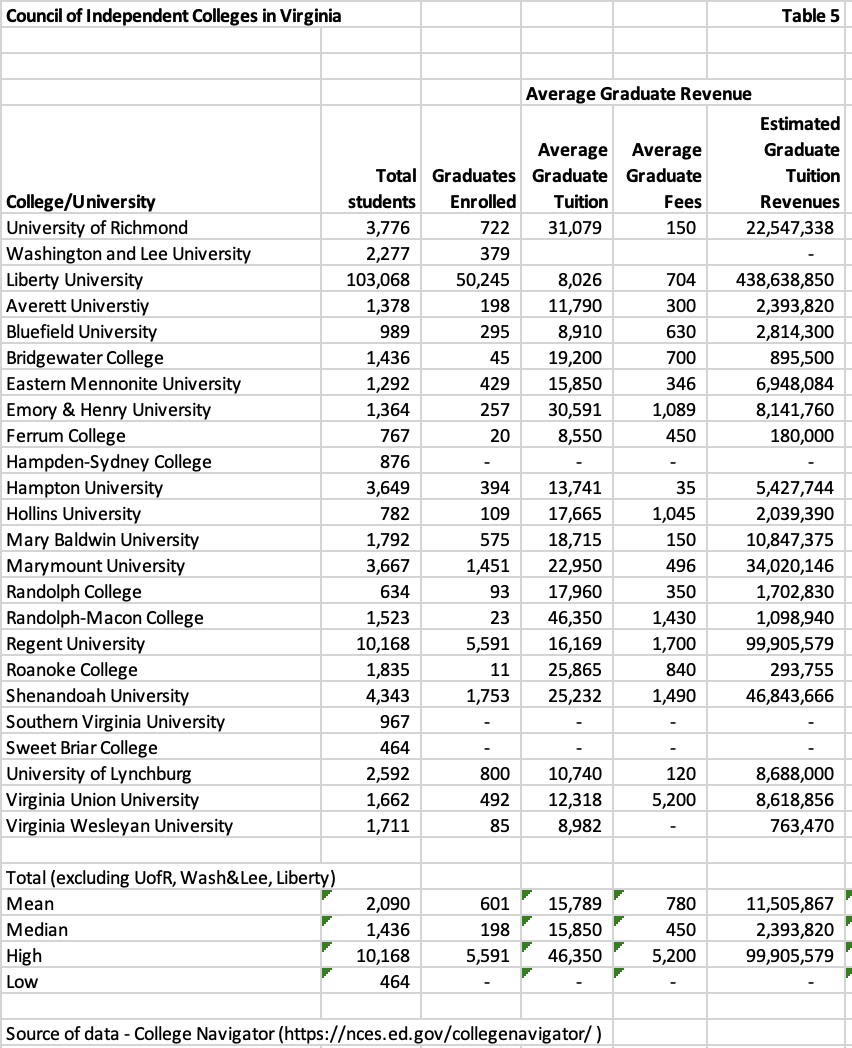
Naturally, there are always exceptions, and it appears that some CICV institutions are offsetting non-selective undergraduate enrollments with graduate enrollments. In Table 5 below, I used the average graduate tuition and fees for each institution and multiplied them by the number of graduate students to derive an estimated graduate tuition revenue. While this may not take into account financial aid or discounts, it’s a relatively useful tool for seeing how much revenue each institution generates from its graduate programs.
With 50,000 online graduate students, Liberty University is off the charts with an estimated $438 million in graduate revenues. The mean ($11,505,867) and median ($2,393,820) estimated graduate tuition revenues for the other 21 colleges and universities are quite different but indicate how significant graduate tuition revenues can enhance the colleges’ financial situation.
The range of estimated graduate tuition revenues for the other 21 institutions goes from a high of $99,905,579 at Regent University to a low of $0 at four colleges with no graduate students. Washington & Lee University did not provide an average graduate tuition figure to College Navigator, but it operates a well-respected law school that charges tuition.
Selectivity matters because “it is a proxy for pricing power and brand elasticity.” Institutions have the power to control pricing without offsetting demand. Beyond 50% acceptance, the market sets the tuition price, and institutions’ margins decline as the net price decreases. Institutions with acceptance rates of more than 50% are part of the higher education market that is overcrowded and price-sensitive.
Although Mr. Greenstein emphasized the net price as the primary source of cash for institutions without large endowments, it’s also important to look at the discount percentage (1 minus the average net price divided by the total cost of attendance) to evaluate the impact of the market on pricing. In Table 6 below, the net discount percentage is calculated for each of Virginia’s private colleges.
Richmond and W&L offer grants exceeding 50%, but draws from their endowments cover a high percentage of that. Liberty has a discount percentage of 33%, but its Total COA is one of the lowest. The remaining 21 colleges have a mean average tuition discount percentage of 54% and a median average tuition discount percentage of 57%.
The highest (or steepest) average tuition discount percentage is at Bridgewater College, with a rate of 67%. The lowest average tuition discount percentage is at Southern Virginia University, with a rate of 29%. Similar to Liberty University, Southern Virginia’s Cost of Attendance is one of the lowest.
The low selectivity at almost all of these institutions, combined with the high average discount rate, illustrates the market dependency issue emphasized by Mr. Greenstein. Bridgewater College has the highest average discount rate (67%) and one of the highest admission rates (91%). It appears that Bridgewater is in the process of resetting its tuition rates. Will the market react positively to a much lower tuition and a lower discount rate? Will the rate reset lead to a higher average net price for Bridgewater? Time will tell.

Mr. Greenstein discusses that each of the 1,000+ institutions in his dataset was scored across approximately 36 different financial and operational metrics. Among these were liquidity, margin, tuition dependency, enrollment trends, and cost structure.
Risk archetypes appear in layers when institutions have low selectivity, writes Greenstein. Enrollment fragility and tuition dependency appear in nearly every institution. Academic program sprawl and financial distress appear as liquidity erodes.
Greenstein writes that the conclusion from this data analysis should not be that colleges need to increase their selectivity. Selectivity defines the institution’s structural position, as well as the pricing power and market elasticity it commands. Strategy should be guided by understanding that position, not trying to increase selectivity.
Greenstein recommends that institutions with an acceptance rate of more than 70% should consider scale initiatives such as:
- Collaborating with other institutions to share administrative and technology costs,
- Specializing in mission or program areas where competition is low,
- Diversifying through adult, online, or workforce-aligned programming,
- Partnering with states or systems to simulate the economies of scale that you lack.
He also recommends considering financial restructuring or mergers before financial reserves are depleted. Greenstein did not recommend adding graduate programs, but the third bullet could theoretically include graduate programs (in my opinion).
Where an institution is on the selectivity curve matters, writes Greenstein. Elite colleges have room to adjust their operating models without compromising their stability. Open enrollment institutions (with 100% acceptance rates) do not. Institutions in the middle have too much cost to shrink and too little market to grow. Once the market takes over, the odds of recovery diminish rapidly.
A Few More Thoughts
I found both of Mr. Greenstein’s studies to be informative. While some of the findings are intuitive (increased tuition discounting leads to decreased operating margins, for example), having a dataset of over 1,000 institutions to use for analysis is impressive. Building my own small dataset utilizing enrollment, tuition, net price, and admissions selectivity for 24 private institutions in Virginia plus the 15 private institutions in Maryland allowed me to grasp the significance of Greenstein’s findings as well as the market situation impacting many of our private institutions.
It appears that Virginia’s private colleges and universities have a lower total cost of attendance than those in Maryland. I believe that’s more aligned with the higher percentage of Virginia’s private colleges located in rural areas versus Maryland’s urban and higher cost of living areas. It also appears that increasing enrollment will be challenging for many of these institutions, particularly those with the highest admit rates and the lowest enrollments. The Demographic cliff is here and that won’t make it easier to recruit new students.
Most senior administrators working for at-risk private institutions are aware of many of these challenges. The findings of Greenstein’s research may be more relevant for their board members as they consider strategies for success or survival.