
A month or so ago, I wrote an article about two of Daniel Greenstein’s papers, which discuss the financial status of private colleges and universities. The first of his papers, titled The Fragility of Small Scale, concluded that total college enrollment below 2,500 students is where “fragility becomes structural.”
The second of Mr. Greenstein’s papers was titled The Price of Admission. After analyzing data from more than 1,000 colleges and universities used in his first paper’s analysis, Mr. Greenstein’s conclusion was “as acceptance rates rise, financial resilience collapses.” According to him, modest differences in selectivity create steep declines in liquidity, operating margin, and financial risk, and when acceptance rates creep above 50 percent, “the decline becomes a free fall.”
In an attempt to evaluate Mr. Greenstein’s conclusions, I pulled data from College Navigator and analyzed 13 private colleges that are members of MICUA, the Maryland Independent College and University Association. From a scale perspective, 10 of MICUA’s 13 members have a total enrollment of fewer than 2,500 students. From a selectivity perspective, 10 of its 13 members admitted more than 50% of the students who applied (mean 72%, median 77%). If his findings are accurate, the future does not look promising for many of MICUA’s member colleges, given the combined lack of scale and high acceptance rates.
Thinking that the set of colleges from Maryland may have been too small to represent the larger population of more than 1,000 private colleges, I analyzed 24 private colleges that are members of CICV, the Council of Independent Colleges of Virginia. From a scale perspective, 17 of the 24 CICV members have total enrollments of fewer than 2,500 students (71% vs. Maryland’s 77%). From a selectivity perspective, 19 of the 24 members admitted 50% or more of the students who applied (mean 78%, median 81%). These institutions represent 79% of CICV members, compared to Maryland’s similarly high 77%.
Exacerbating the scale and selectivity issues is the steep tuition discount rate offered by most of the private institutions to attract prospective students. The mean and median tuition discount rates for Maryland’s private colleges were 58% and 59%, respectively. The mean and median tuition discount rates for Virginia’s private colleges were 54% and 57%, respectively. For tuition-dependent colleges operating without the benefit of a large endowment, every percentage point above 50% represents precious cash revenues that could be used to cover operating expenses.
I pointed out how some private colleges in both states added graduate programs (and students) to contribute additional, and sometimes substantial, revenues to cover operating expenses. In most cases, these additional graduate programs operate online, which theoretically lowers the students’ COA (cost of attendance), assuming the typical graduate student is working full-time, attending grad school as a part-time student, and covering their room and board costs through wage and salary income.
Peer Group Analysis
After posting my articles and having several conversations with a few friends and colleagues over the past three weeks, I thought I would review the list of peer group schools submitted by the MICUA members to see if any notable similarities or differences might explain some of the outliers in enrollment, net price, or some other data.
The easiest way to gather peer group data is to access The Chronicle of Higher Education article that provides a link to an internally developed tool (note: a subscription may be required to access the article). According to a previously published Chronicle article, the National Center for Education Statistics (NCES) provides each school with a report comparing its key metrics with the metrics of up to 100 peer schools (most schools submit approximately 20 schools).
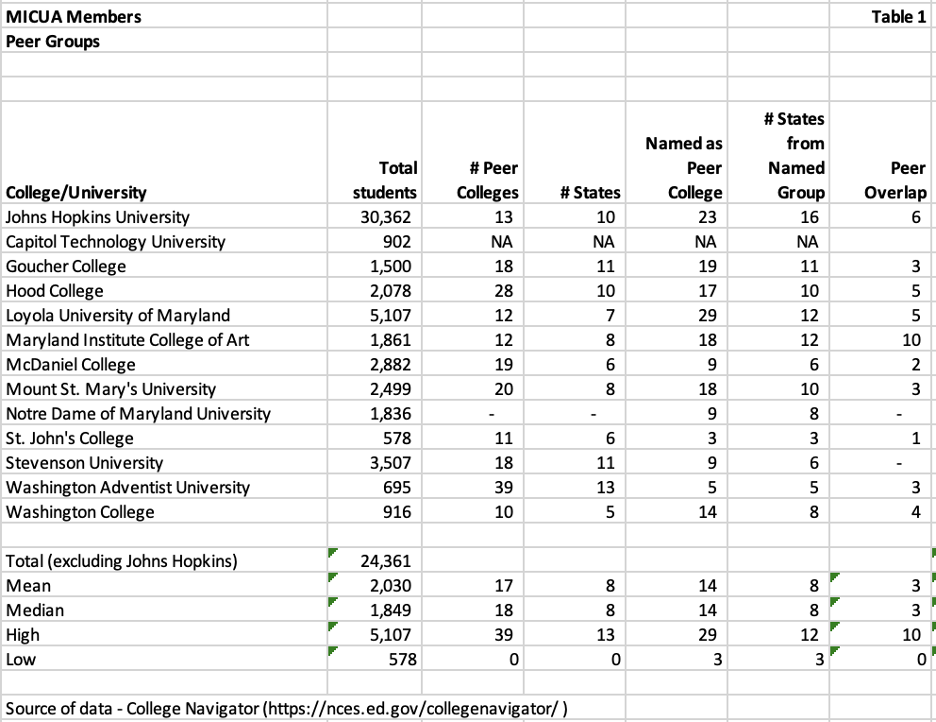
Rather than attempting to access the peer data through NCES, I opted to use The Chronicle’s tool. In Table 1 below, I list the 13 MICUA institutions with their total enrollment, number of peer schools they named, number of peer schools that named them, the number of schools that were named by both (peer overlap), and the number of states in which those schools are based.
I also calculated the mean, median, highest, and lowest values for 12 of the colleges. I excluded Johns Hopkins (JHU) because it was already excluded from my previous analysis due to its large enrollment, R1 (research) status, high selectivity, and substantial endowment. For this analysis, another reason to exclude it is JHU’s national reputation.
A few quirks in the data were determined for the 12 institutions. Capitol Technology University’s information was not available from the Chronicle tool. I assume it’s because the Department did not collect it, or Capitol did not submit it. Notre Dame of Maryland University did not select any peer institutions, but nine institutions named it as a peer.
Interestingly, the mean and median for states in which peers are based were eight. Coincidentally, the mean and median for states where schools that named a MICUA institution as a peer were eight. The mean and median for peer overlap schools were three.
Distance Students Travel for College
There were two primary reasons I wanted to examine the peer institutions named by each MICUA member. The first reason was to see if there were any surprises (to me). The second was to see how far away the peers were located from the MICUA institution (other than JHU, an institution with a national brand).
Higher education researchers have published studies on the average distance a college student travels from their home to their college. An October 2023 Brief from TICAS (The Institute for College Access and Success) provides an excellent overview of the data as well as their methodologies for analyzing it.
TICAS senior fellow Nick Hillman posits that there are two marketplaces for higher education. Colleges and universities in one market compete nationally for highly mobile students, and colleges and universities in the other market compete for students in a highly localized market. Colleges operating in the “national” market have a greater advantage in attracting students. Colleges operating in the “localized” market operate in a more competitive environment.
Mr. Hillman provides a table illustrating the mean and median distances between students’ homes and their institutions (data were sourced from the 2020 U.S. Department of Education’s National Postsecondary Student Aid Study). Table 1 (below) illustrates the skewed difference between mean distance and median distance. It also shows that the greatest differences students are willing to travel for are at private non-profit bachelor’s and master’s institutions, as well as private non-profit research institutions.
Hillman recommends that researchers use the median distance instead of the mean distance. I found the percentages of students within 25 and 50 miles very insightful. I noted that there is no statistically significant difference between the percentages of students living within 25 and 50 miles for the private bachelor’s and master’s institutions and the private research institutions.
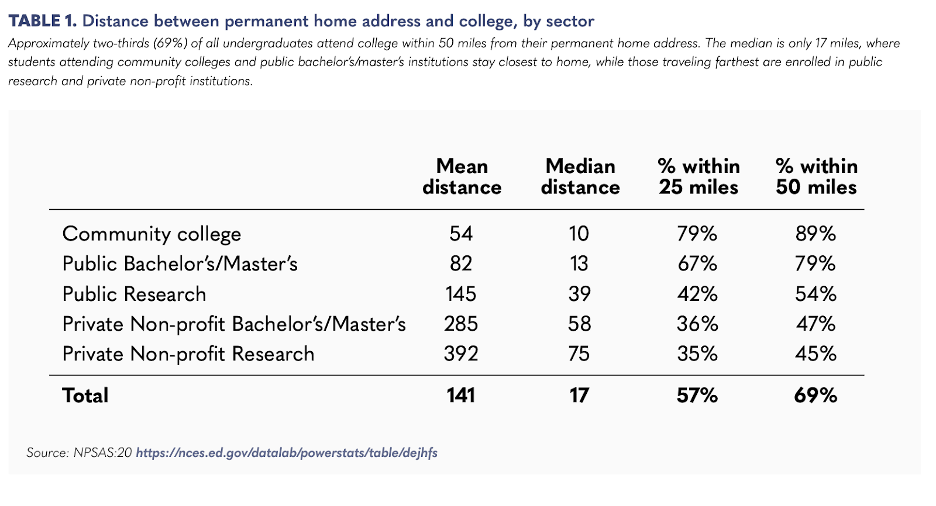
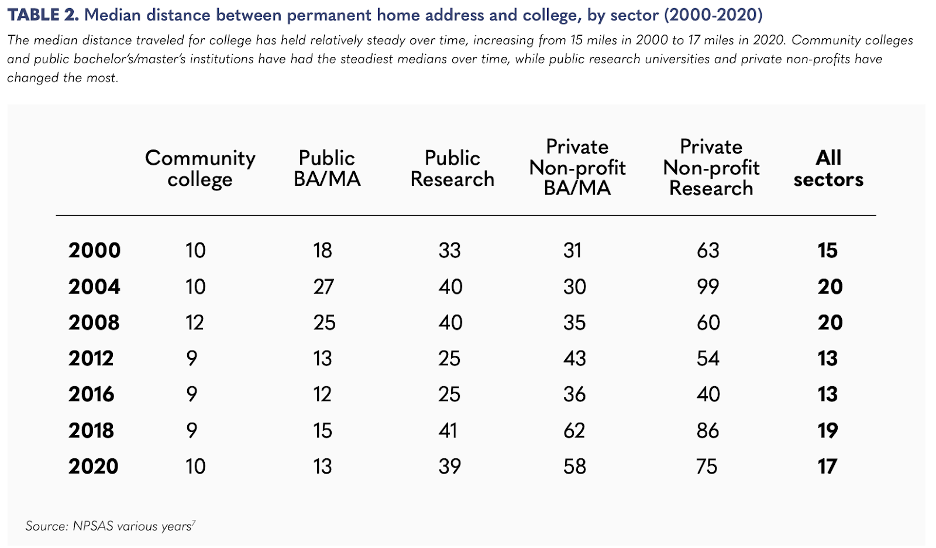
Table 2 provided in the brief illustrates the changes in the median distances between sectors over the past 20 years. Notably, the greatest change in the median distance during that period is within the private bachelor’s/master’s institution, where it nearly doubled from 31 miles to 58 miles. I would still consider 58 miles a localized market. I am curious if the doubled distance was caused by the decline in students enrolling in rural colleges.
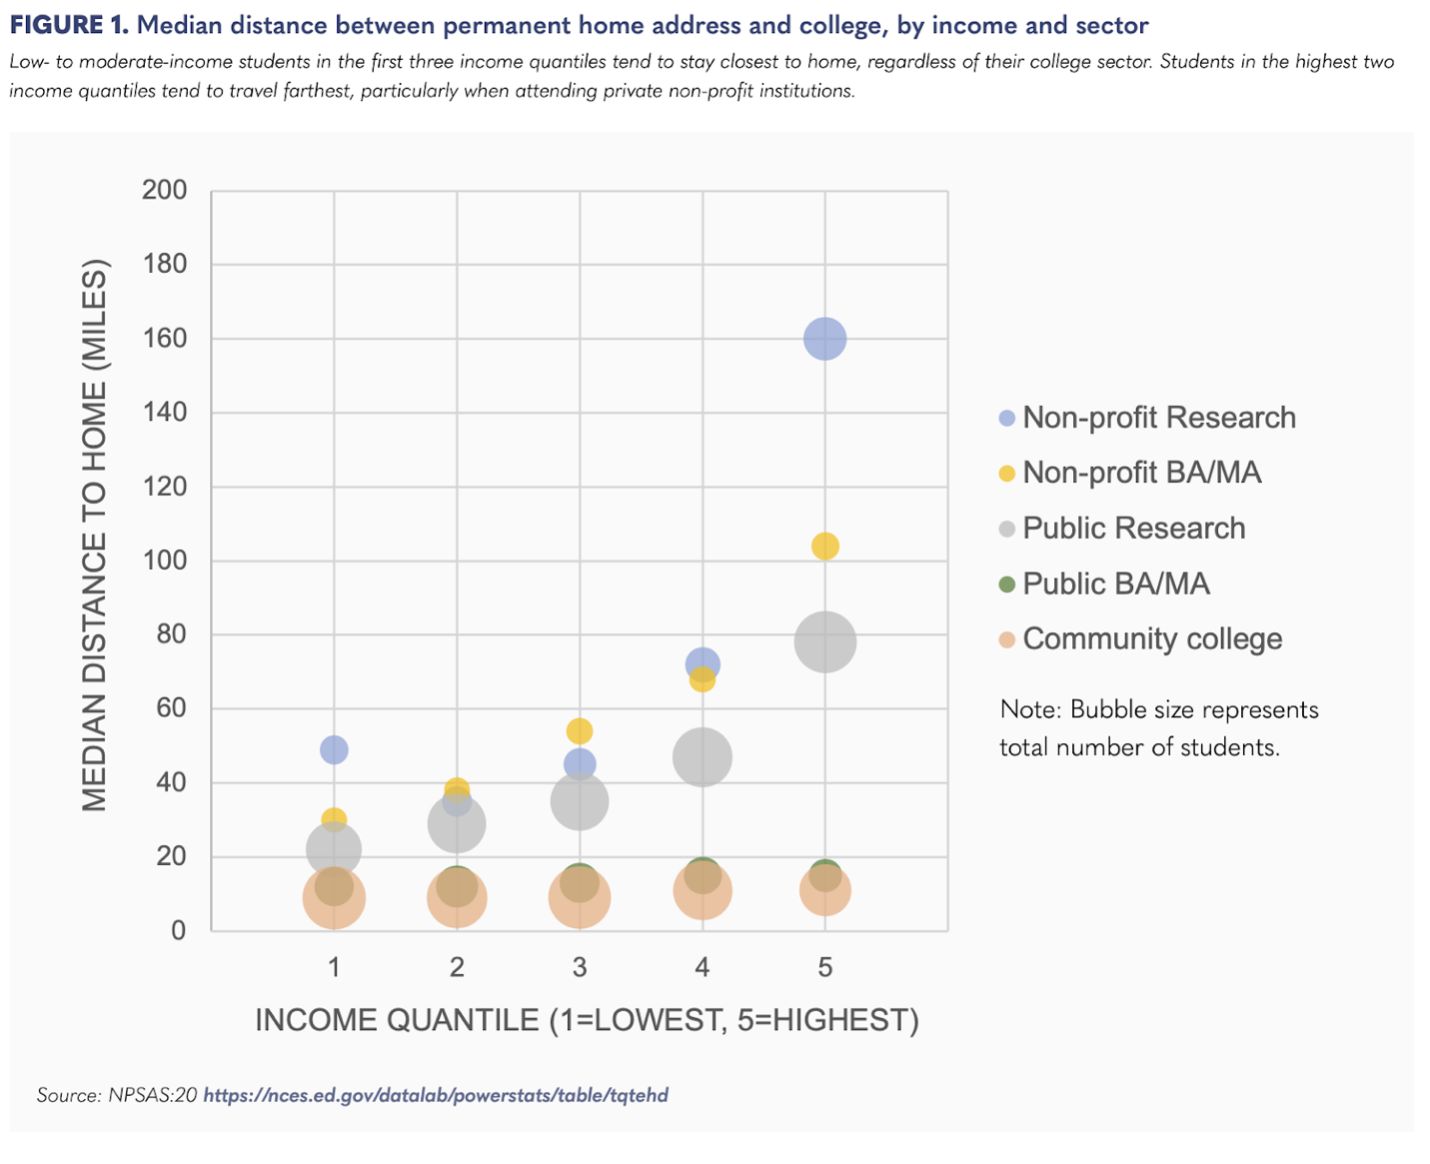
The TICAS brief continues to provide additional insights into the mobility of the college student. Figure 1 (below) illustrates that the median distance increases by sector and by students’ income. Note that for the highest income group, the private bachelor’s/master’s colleges’ median distance doubles to slightly more than 100 miles. This makes sense in that higher income families can afford the costs of traveling to campus as well as the additional costs of room and board.
Maryland’s Private Colleges’ Peers
There are 232 colleges and universities that were either named as peers by MICUA’s 13 members or that named a Maryland college or university as a peer. Most of these institutions are private, non-profit bachelor’s and master’s institutions, like the majority of MICUA’s members.
The 232 colleges and universities are based in 34 states (out of 50 plus DC). Six of those states have only one college named as a peer. Pennsylvania (42), New York (36), and Ohio (20) are the top three states.
The two Maryland colleges named as peers the most times were McDaniel College (7) and Hood College (6). Three colleges were named five times, including St. John’s College – Maryland.
Given Maryland’s location, it’s not surprising that peer colleges in Maryland, DC, Virginia, Pennsylvania, New Jersey, and New York were named, since most are reachable within a four-hour drive from Baltimore.
Given the “localized market” phenomena mentioned in the TICAS brief, I was surprised that MICUA members (excluding JHU) didn’t name a higher percentage of Maryland colleges as their peers. McDaniel named six Maryland colleges as its peers, as did St. John’s. Hood College named three, Mt. St. Mary’s and Washington College named two each, and Washington Adventist named one. Goucher, MICA, Loyola, Notre Dame of MD, and Stevenson did not name any Maryland college as a peer. As mentioned previously, Capitol Technology was not available using the application.
Single Institution Peer Review
I decided to examine one of the MICUA colleges—Washington College (WC)—to determine if there was any correlation in size or selectivity among its peer institutions. Table 2 below displays student enrollment at the 10 peers selected by WC. While WC has the lowest total enrollment (916) of the group, none of the peers exceed 1,818 in enrollment, with a median of 1,354. Half of the institutions enroll some graduate students, with Goucher being the only peer that enrolls more than 100 graduate students.
Three of the peer institutions are based in states much further from Maryland than might be expected for a “localized” market. These are Albion (Michigan), Lake Forest (Illinois), and Transylvania (Kentucky).
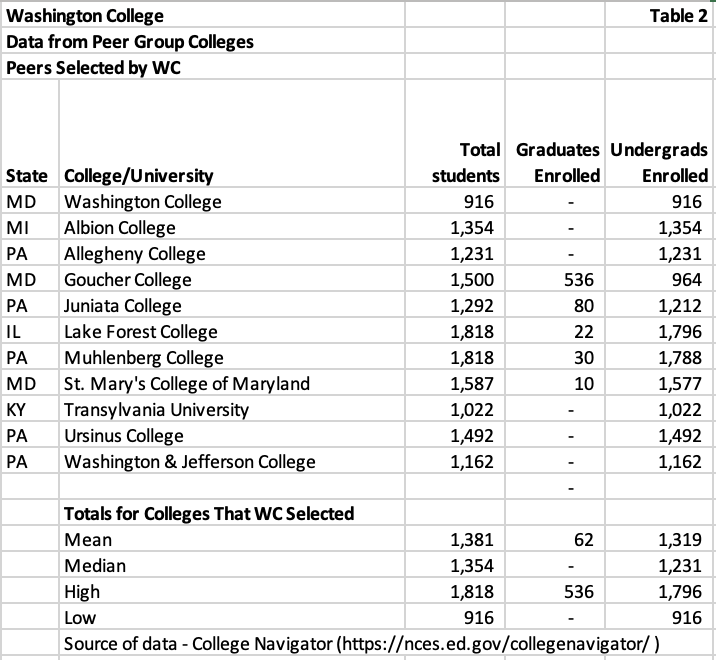
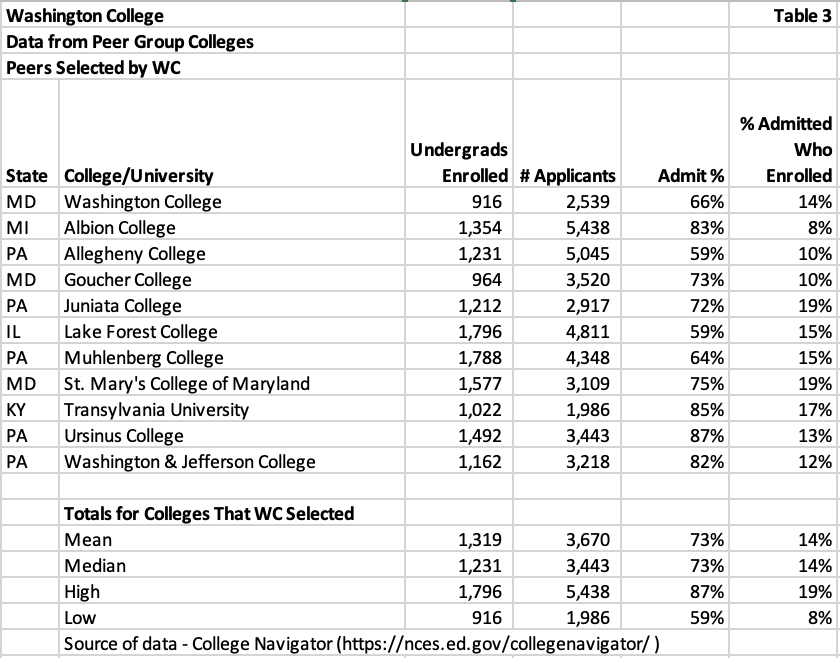
Table 3 below illustrates the WC peer group in terms of undergraduate admissions selectivity. None of the colleges have an admission percentage of less than 50%. WC’s rate of 66% falls below the mean and median percentage for the group of 73%.
I reviewed the same data for the institutions that named WC as a peer. Table 4 below includes WC and the 14 colleges that named it as a peer. While the median enrollment of 1,292 is close to the median enrollment of 1,354 in Table 2, there are three institutions with more than 2,500 students (Daniel Greenstein’s break point for scale), and all three of them have more than 500 graduate students enrolled. One other institution has more than 500 graduate students (Lenoir-Rhyne) but slightly fewer than 2,500 students.
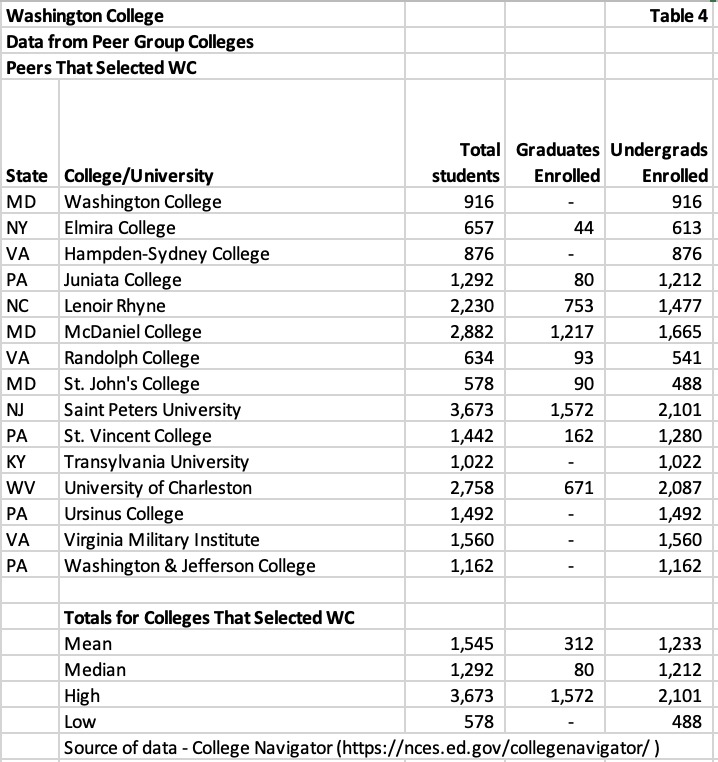
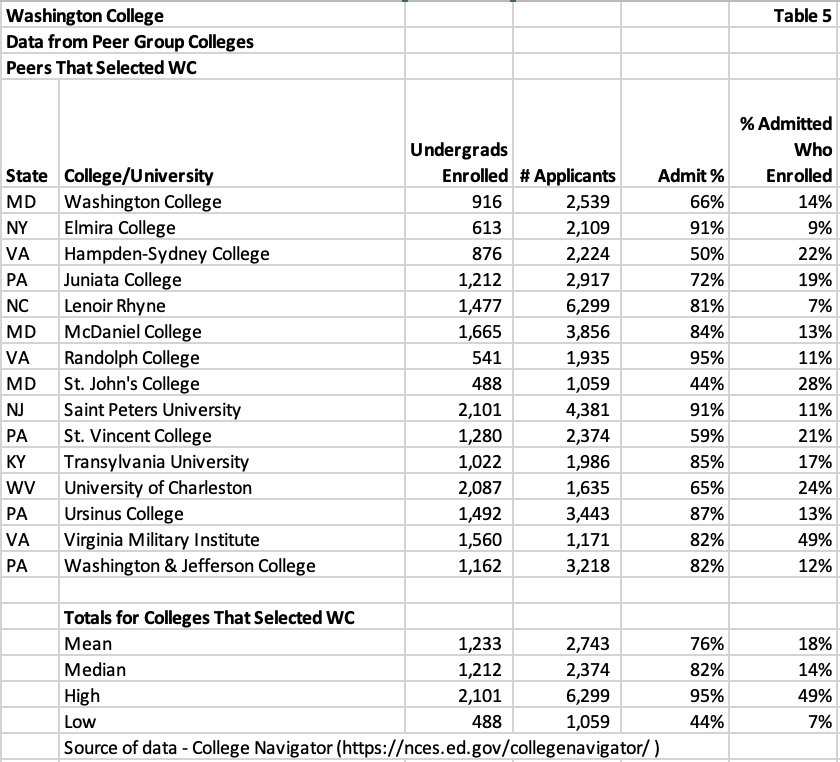
Table 5 below provides the admissions selectivity data for the 14 colleges that named WC as a peer. Only one college (St. John’s College) has an acceptance percentage (44%) below 50%. Hampton-Sydney has a 50% acceptance rate. The median for the group is 82%. Again, WC’s 66% rate is below the median and mean. Virginia Military Institute (VMI) has an 82% acceptance rate but a 49% enrollment rate, which is substantially higher than the mean (18%) and median (14%) for the group. The next highest enrollment rate is St. John’s with 28%. The unique nature of each school’s programs (military for VMI and Great Books for St. John’s) may contribute to the higher enrollment percentages. Colleges below the median enrollment rate of 14% are not winning the market battle for enrolling students.
I was curious about the “quality” of the matriculants for each of the colleges in the peer group. Data representing the percentage of students who graduated in six years was included, as well as data representing the percentage of students who transferred. Theoretically, the percentage of students who dropped out should be 100% less than the sum of graduates and transfers, so I added a column representing dropouts.
Table 6 below illustrates the outcomes for WC’s peer group. I don’t believe that five of the twelve institutions have zero transfer students. I think they don’t bother to track transfers. Transfers can be tracked by institutions that participate in the National Student Clearinghouse. Where colleges reported a transfer percentage, the calculated dropout rate may be representative.
The six-year graduation rate for colleges and universities has remained steady at approximately 61% for the past two years. The mean and the median for WC and its peer group are higher than the national average at approximately 70%. WC’s is 74%. What happens to the students who don’t graduate? They either transfer out (22% at WC) or drop out (4% at WC). Colleges looking to grow enrollments should analyze the reasons for student transfers. Decreasing the transfer rate can enhance total enrollments, assuming the number of first-year students holds steady or increases.
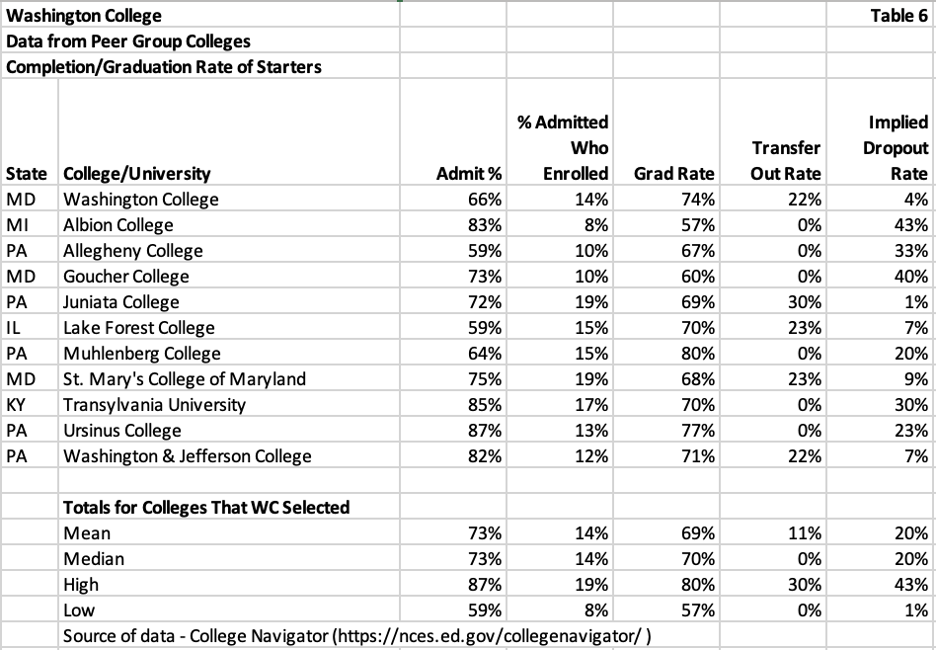
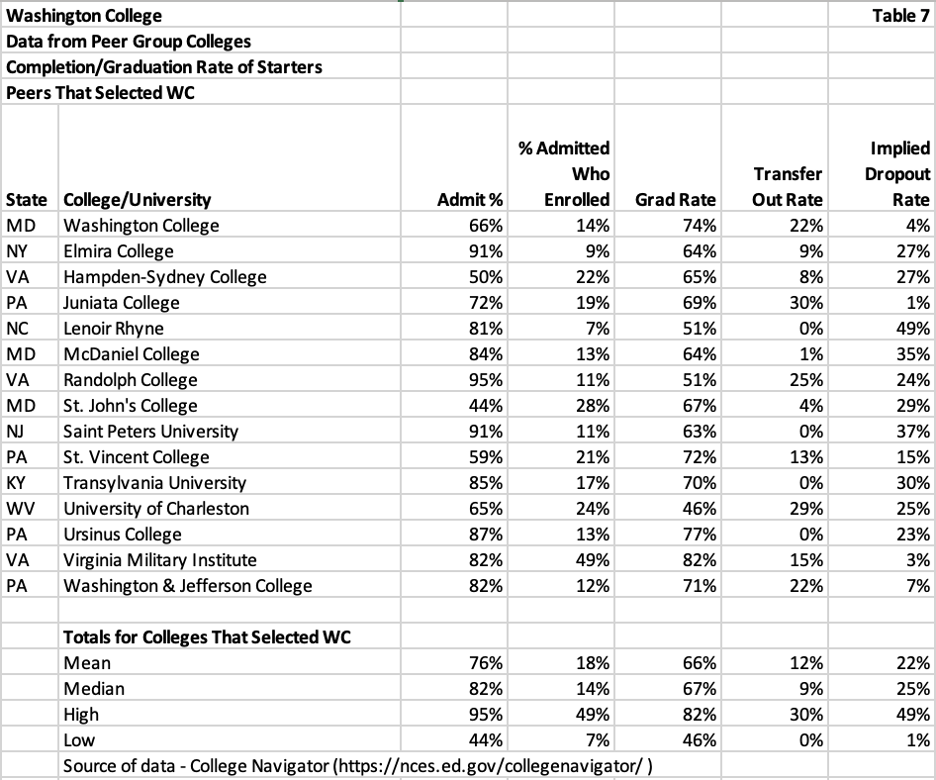
Table 7 below illustrates the grad, transfer, and dropout rates for those colleges and universities that named WC as a peer. This group’s mean and median graduation rates also exceed the national average of 61%. More colleges in this group reported a transfer-out rate that ranges from 0% to 30%. The calculated dropout rate ranges from 1% to 49%. Again, if I were examining opportunities for increased enrollment, I would analyze the reasons for transfers and dropouts.
A Few Final Comments
As I mentioned earlier, Daniel Greenstein’s two articles about private colleges’ problems with the “fragility of scale” and market impact on colleges when admissions selectivity goes above 50% spurred me to put together a set of enrollment and other data from private colleges in Maryland (MICUA), Virginia (CICV), and Florida (ICUF).
Mr. Greenstein didn’t share institution-specific data in his papers. His findings focused on the major conclusions drawn from his analysis of the dataset comprising over 1,000 colleges. Is the data relevant? Based on my review of data from private colleges in three states, I believe it is.
What can we learn? I believe that most senior administrators are aware of the challenges of operating a small-enrollment college in today’s environment. Board members, on the other hand, may be more unaware.
I chose to pull data available to the public from College Navigator. Any private college Board member should be able to access this. Even better, interested board members could ask the president or CFO for more recent data, as College Navigator typically lags behind by a year or two in publishing current information.
Total enrollment below 2,500 is a problem, particularly if total enrollment has declined for several years. Colleges in areas impacted by the demographic decline of 18-year-olds are at risk.
Are there options to mitigate the risk and change the tide? There may be, but if changes are not underway, it may be difficult to implement positive changes before financial problems increase in severity. Among the options I would consider are:
- Emphasize programs that distinguish you from your competition. While the market is “localized” for most private colleges, differentiating your institution can help it stand out from its peers.
- Consider selectively adding online master’s degrees for your distinctive and distinguished programs. Alums may comprise a reasonably sized market for these degrees.
- Evaluate ways to increase the number of qualified applicants. Some of these ideas may include adding athletic teams, partnering with high schools in targeted markets for dual enrollment/dual credit programs, developing and implementing three-year bachelor’s degree programs, and implementing direct admissions programs with partner high schools.
Discussions about the challenges faced by low-enrollment private colleges and universities are not new. Mr. Greenstein’s papers provide a focus on two issues that he says are major red flags. Increasing enrollments should be priority number one for low-enrollment colleges. Priority number two should be keeping the students you enroll rather than having them drop out or transfer.
While some colleges and universities may not have the financial wherewithal to evaluate opportunities to grow enrollment without implementing expense reductions, thinking about innovative ways to increase student enrollment is vital. Higher education is changing, and those who don’t find ways to meet the challenges of change are going to be on the losing side.


