
I frequently write and speak about the higher-than-inflationary college tuition increases since the late 1970’s. More specifically, how the decision by Harvard’s Board in 1978 to increase Harvard’s undergraduate tuition the next year by 18% led to similar increases by its Ivy Plus peer institutions and many private colleges.
Moreover, Harvard continued to increase its tuition by eight percent each year after 1978-79 for the next decade, raising it to levels that it believed its wealthy students’ parents would pay. Many of the private colleges that copied Harvard’s higher-than-inflation tuition increases used a portion of those increases to subsidize merit scholarships to attract more qualified students. Over time, that strategy backfired when those non-elite private colleges had to offer deeper and deeper tuition discounts to a larger percentage of their applying students.
On February 25, The Chronicle, Duke University’s student-run newspaper, announced that Duke’s undergraduate cost of attendance would exceed $90,000 next year. I posted a link to the article on my LinkedIn page and commented, “as an alum, I’m not happy that my alma mater is now a member of the +$90k club.”
After I read the Duke tuition increase article, I decided to collect some data about private college and public college tuition increases. While I was in the process of collecting that information, Duke’s Chronicle published another article about its undergraduate tuition increases. The reporter, Zoe Kolenovsky, wrote that the 5.93 percent increase was Duke’s highest “in the 21st century.”
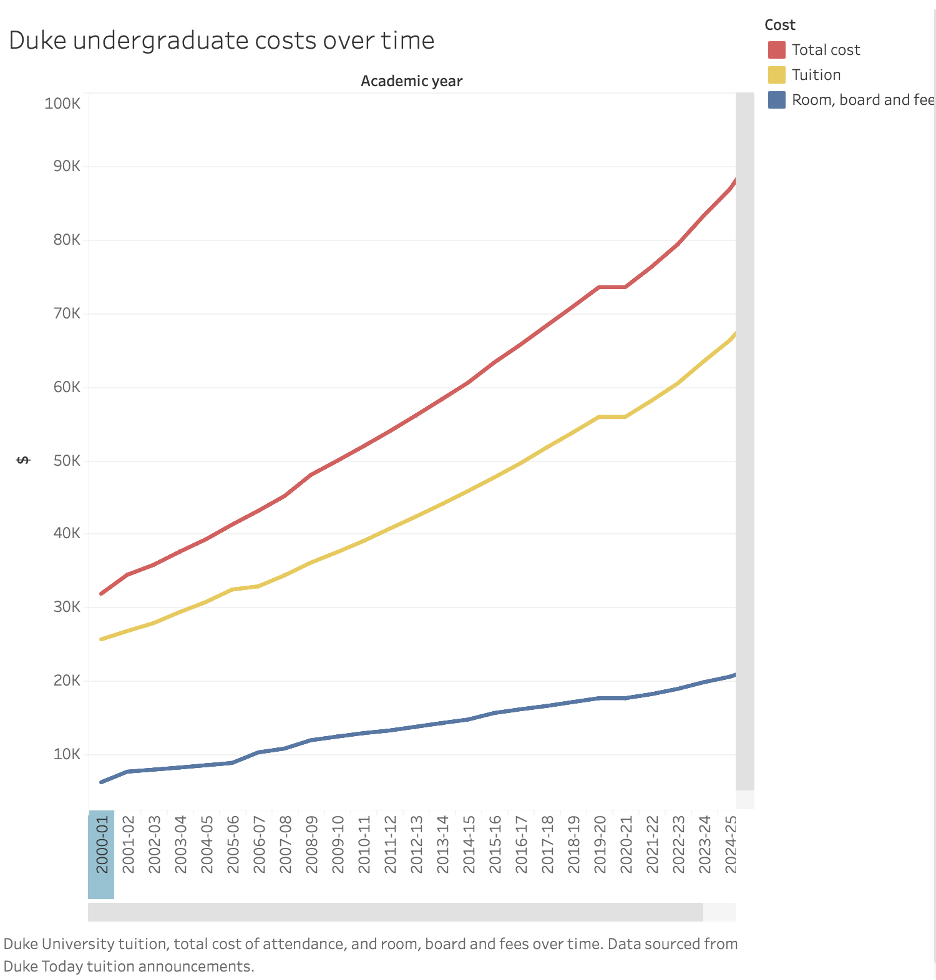
Ms. Kolenovsky compiled data on increases in Duke’s tuition; room, board, and fees; as well as its total cost of attendance (COA) since the 2000-01 academic year. Tuition that year was $25,630 and its COA was $31,829. Next year’s tuition at Duke will be $70,265 with room, board, and fees increasing COA to $92,042. Over a 25-year period, the costs have nearly tripled. I should be speechless.
The Chronicle provided an illustration of Duke’s COA and tuition increases over the 25-year period. It is appended below.
A Comparison of Cost of Attendance Increases Among the Ivy Plus Universities
Ms. Kolenovsky also obtained data from the Department of Education’s IPEDS database to compare Duke’s historical tuition and COA increases to those of its peers in the Ivy Plus group. She wrote that Ivy Plus colleges and universities charge some of the highest tuition rates in the U.S., with Duke usually near the top of the group of 15. The tuition charged for each school is illustrated in the chart below.

What Ms. Kolenovsky failed to note in her article is that the high tuition pricing at the Ivy Plus institutions is designed to use money from rich families to subsidize poor families.
When I wrote about who could afford to attend Ivy Plus universities in 2023, I noted that their tuitions were among the highest in the country, but their net prices were the lowest for the lowest-income students. In fact, only 11% of Ivy Plus students borrowed for their undergraduate education.
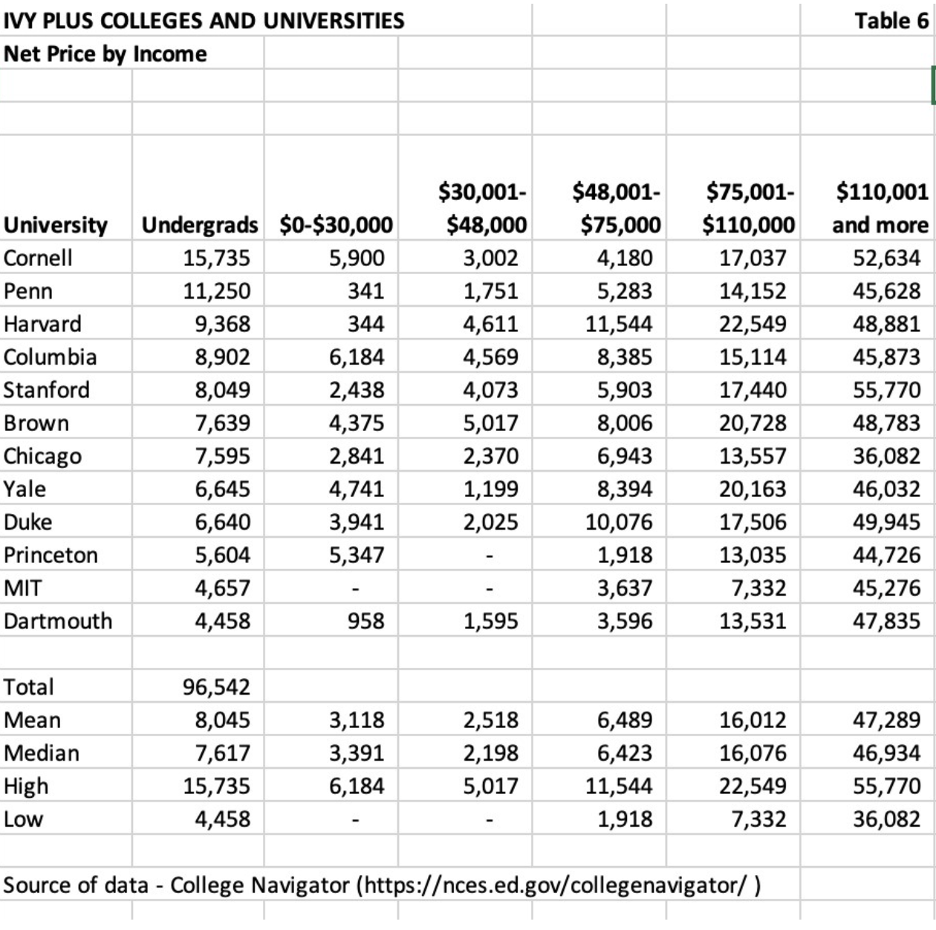
I’ve appended below the breakout of net price by income quintile that was produced for that 2023 article. As you can see, the means and medians are very low for the three lowest income quintiles (60% of all U.S. families).
Only the highest income quintile pays a net price close to the Cost of Attendance (COA) and that number is low because of the Ivy Plus no-loan guarantees for families with incomes less than $125,000-$175,000 (note that the quintile is all income above $110,001, an amount lower than the income guarantee level for most of the Ivy Plus universities).
Another table from my 2023 analysis illustrated that the median percentage of first-year students at Ivy Plus colleges who were provided no aid at all (full-pay students) was 42%. The median COA was $83,612 at the time. While the endowment balances at these institutions are in the billions, the high percentage of full-pay students is offsetting some of the costs of educating the lower-income students.
Updating the Ivy Plus Financial Data
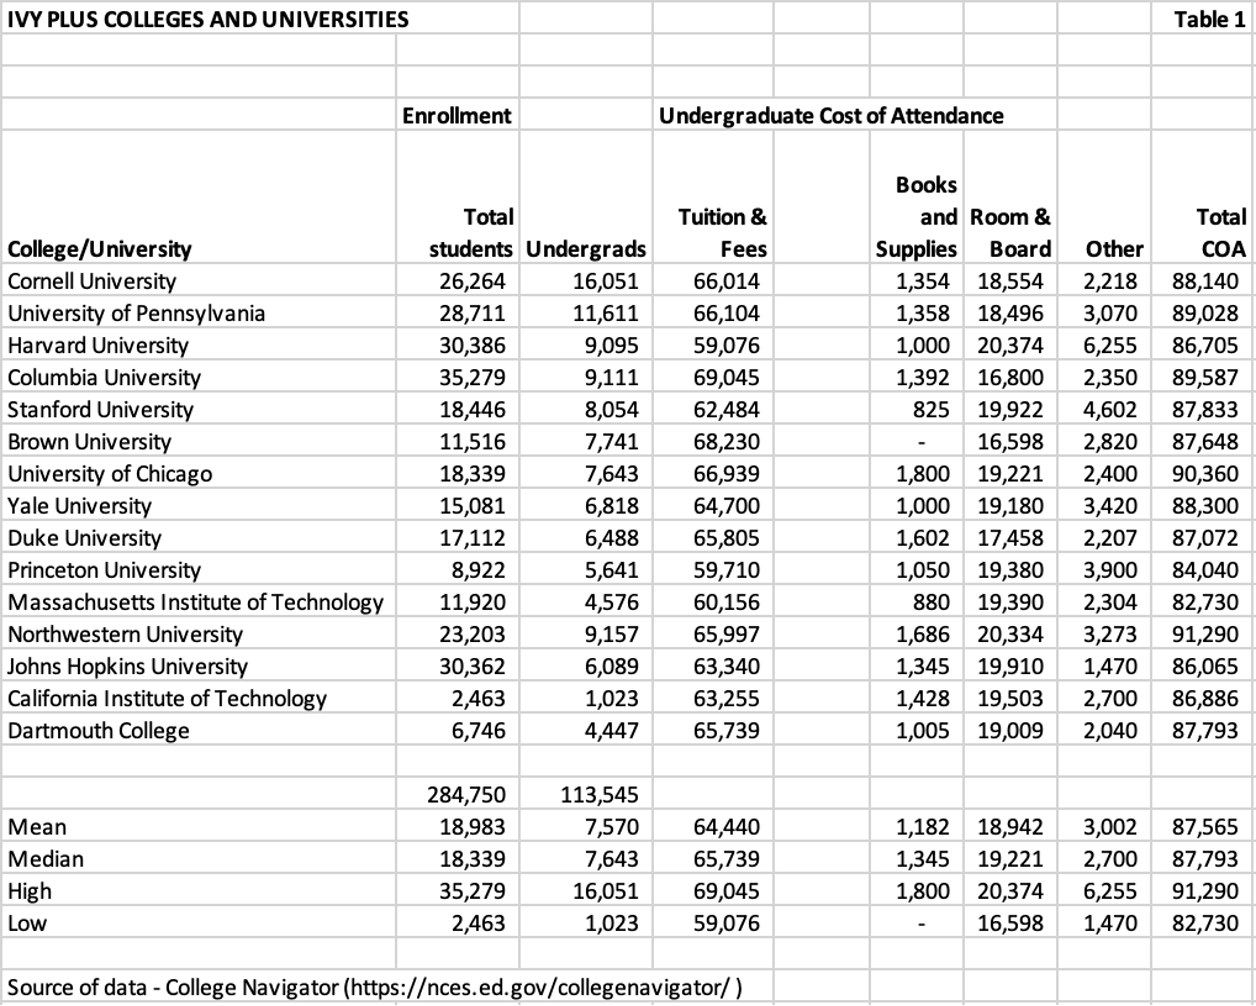
I recreated my 2023 analysis of the Ivy Plus colleges and universities with updated data from College Navigator. Table 1 below provides enrollments and the components of the total cost of attendance (COA) for each of the 15 schools. The data is two years behind the recently disclosed tuition increases for FY 26.
The total COAs for the universities are closely aligned. The mean of $87,565 is nearly the same as the median of $87,793. The group ranges from a low of $82,730 at MIT to a high of $91,290 at Northwestern.
All institutions in the group except Dartmouth have more graduate students than undergraduate students. The mean and median enrollments, total and undergraduate, are closely aligned. Total enrollments range from a low of 2,463 at Cal Tech to a high of 35,279 at Columbia.
Who Can Afford to Pay Ivy Plus Tuition?
It’s important to understand the distribution of household incomes in the United States to understand who can afford to pay the cost of an Ivy Plus education. Table 2 below sources the most recent U.S. Household income distribution by quintile from the Tax Policy Center.
As you can see, the mean gross household income in 2022 for the first three quintiles is not enough to cover the lowest COA. The fourth quintile doesn’t exceed it by enough to question if a household could afford an Ivy Plus education for one of its children. For the highest income quintile and top 5%, I applied a combined tax rate of 40% to calculate a theoretical after-tax income.
Simply put, most American families cannot afford to pay the full cost of attendance at an Ivy Plus university.

What Percentage of Undergraduates Receive Grants?
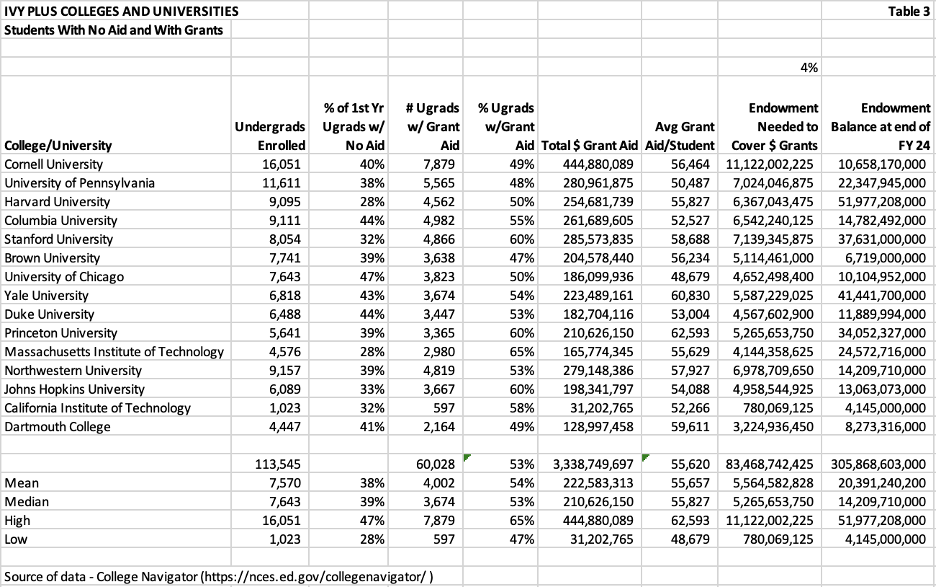
In addition to their high tuition, Ivy Plus universities are known for their large endowment balances. Those endowments can theoretically cover a large percentage of the undergraduate cost of attendance. In Table 3 below, I’ve listed the percentage of undergraduates who receive no aid (% full pay) and the percentage who receive grants.
As you can see, nearly 40% of all undergraduates attending these 15 institutions receive no financial aid. That would place all of them in the Top 5% of household income, as illustrated in Table 2. Their household income is likely much higher than that. It would not surprise me if most were in the top 1% of incomes.
The mean percentage of undergraduates receiving grants is 54%. This aligns closely with the median of 53%. Grants issued by the group of 15 range from a low of 47% at Brown University to a high of 65% at MIT. The mean grant for the group is $55,657, and the median grant is $55,827.
The total value of grants issued by each institution averages $222,583,313. Because of the high endowment balances of these institutions, I don’t know if a significant percentage of this money reflects a discount from tuition paid by full-pay parents or is paid from endowment funds restricted to financial aid.
To test my theory, I divided the total value of grants issued for each university by a conservative 4% endowment draw rate. I compared that calculated required endowment amount to the endowment balance of each college at the end of fiscal year 2024.
Without knowing what percentage of their endowments are restricted to undergraduate financial aid, it appears that most of the universities would have no problem covering their grants with a draw from their endowments. Exceptions might be Cornell and Brown.
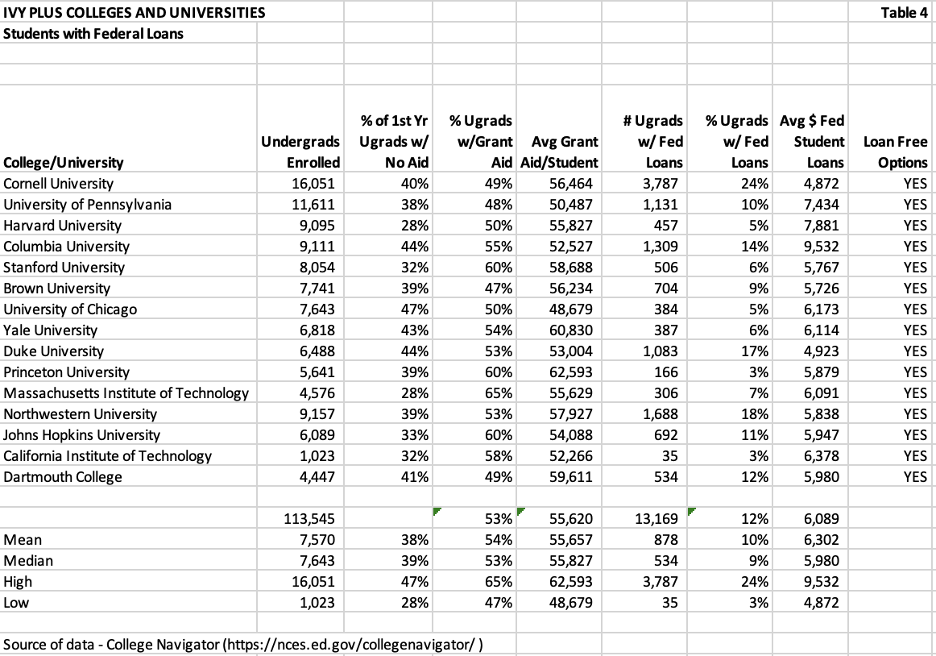
A Small Percentage of Ivy Plus Students Have Student Loans
Table 4 below displays data from each institution regarding the numbers, percentages, and average dollar amount of students who have federal loans. The mean percentage of students with federal loans is 10%, and the median percentage is 9%. The mean loan amount for those who borrow is $6,302, and the median is $5,980.
I included a few columns from other charts. The first additional column displays the admission percentages. All these institutions are highly selective, with single-digit admissions rates ranging from 3% (Harvard) to 8% (Cornell and Johns Hopkins). Approximately 40% of students are full-pay, ranging from 28% (MIT) to 47% (Chicago).
Approximately 54% of students receive significant institutional grants, averaging $55,657. Clearly, many families have the capacity to pay something since the COA for the group averaged $87,565 (Table 1) in FY24. Subtracting an average grant of $55,657 plus the average loan of $6,302 from $87,565 implies an average cash contribution of $25,606.
It’s also important to note that all the 15 Ivy Plus institutions have some type of “no loan” guarantee for families with incomes below a certain amount (see YES in column). For example, Princeton University will meet 100% of demonstrated financial need with grant aid to any student admitted. That policy may explain why Princeton’s 3% is at the low end of the percentage of undergrads with federal loans.
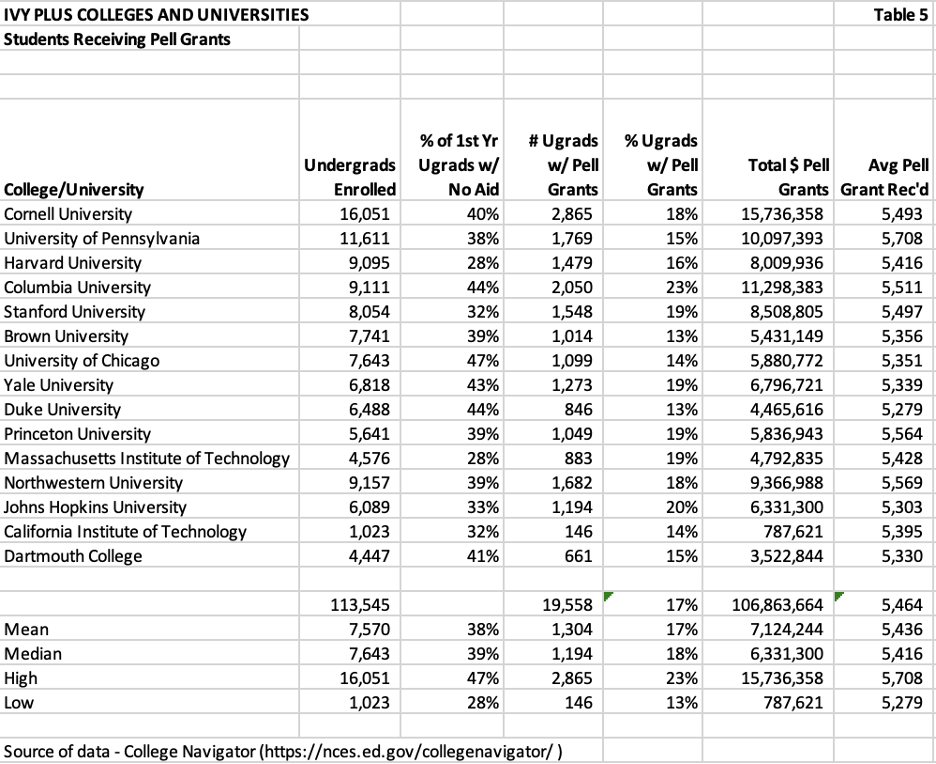
Students Receiving Pell Grants Outnumber Students Receiving Loans
The percentage of a college student body that receives Pell grants is usually an indicator of how many low-income students are admitted and attend. Pell grant recipients comprise approximately one-third of all undergraduate students.
As you can see from Table 5 below, the percentages of Pell students attending Ivy Plus colleges ranges from a low of 13% at Brown and Duke to a high of 23% at Columbia. The mean for the group is 17% and the median is 18%. It is likely (my opinion) that there were not enough academically qualified Pell applicants to reach the national average of 33%.
The average Pell grant was $5,436 and the median was $5,416. The current maximum Pell grant is $6,495 and the national average Pell grant is $4,283.
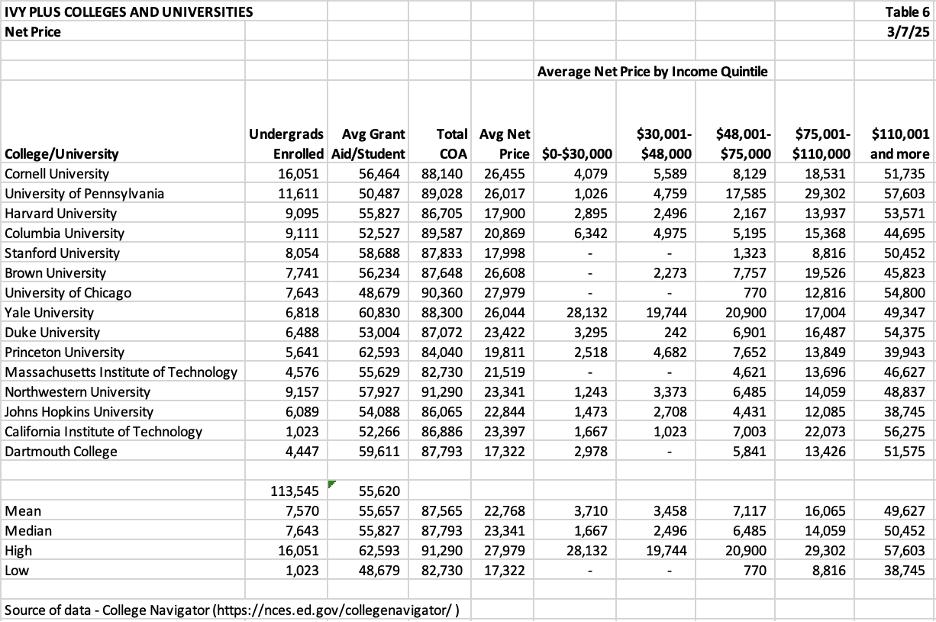
Net Price – What Does It Indicate?
I always look at an institution’s net price, particularly by income quintile. In Table 6 below (dated 3/7/25), I provide the Total Cost of Attendance and the average grant aid per student. Average Net Price is defined as the Total Cost of Attendance (in-state for state institutions) minus all grants.
The average net price of $22,768 is much lower than the Total COA. A substantial reason for that difference is that the average grant aid per student is $55,657.
Thanks to these institutions’ loan policies, the net price for the first three income quintiles is very low as well. In my 2023 analysis of five different groups of higher education institutions, the Ivy Plus group had the lowest net prices.
It’s the last quintile that we should pay close attention to. The top quintile is any family that makes more than $110,001 per year. As we know from Table 2 above, the mean income for the entire quintile is $277,300. The mean income for the top 5% is $499,900. I suspect that most of the full-pay families are earning more than the mean income for the top 5%.
Because the highest income quintile has no cap on income, it would be useful if the government provided more granular information in terms of average net price. I understand that the Department of Education doesn’t want to provide information that is so granular that it discloses information about a specific student.
At the same time, the average COA for the Ivy Plus institutions is so high that knowing what the net price is by a more finely divided quintile (say 80-84.9%, 85-89.9%, 90-94,9%, and >95% would be helpful. Most of the full-pay population is most likely in the >95% category.
Why Are Tuitions at Ivy Plus Institutions So High?
Why are tuitions so high at Ivy Plus institutions? The short answer is that their brands imply that they are the highest-quality colleges and universities. Their single-digit acceptance rate indicates that many people continue to apply regardless of the price. Their large endowments enable them to provide significant grant aid to those who qualify.
The other answers are complicated. Wealthy families can send their children to independent schools that prepare them for elite colleges in many ways. Wealthy parents may have strategic connections at elite universities. Wealthy parents don’t flinch at the $90k per year cost of attendance. I have maintained for years that the business model of the elite colleges requires a reasonable percentage of full-pay students. If legacy admissions are banned (I believe MIT and Johns Hopkins are the only two members of the group to do that), the universities will still have a reasonable percentage of full-pay students.
As a Duke alum whose financial aid package while a student included Pell Grants, I understand Ms. Kolenovsky’s perspective about the annual undergraduate cost of attendance exceeding $90,000. The evidence indicates that 44% of Duke undergrads receive no aid. That’s above the mean and median but not at the top of the Ivy Plus range.
Duke’s $12B endowment is below the mean and median of the 15-member group and because it is lower, that likely explains why Duke’s full-pay percentage is above the mean and median of the group.
My previous analysis of Ivy Plus institutions, other elite colleges and universities, flagship public institutions, HBCUs, and community colleges indicated that the Ivy Plus institutions provide the best financial aid packages to the lowest-income families. I haven’t updated that analysis, but I don’t believe it’s changed.
Philip Levine published a research paper with Brookings shortly after this article was published. His data confirms my data that elite private universities provide the lowest COA for the lowest income students. His data also illustrates that the net price (COA minus grants) of college has decreased over the past five years for all students except those from the highest income families.
Additionally, Harvard announced on March 17 that it was paying COA for all students whose families’ incomes were less than $100,000 and paying 100% of tuition for all students whose families’ incomes were less than $200,000. This is effective in the 2025-2026 academic year and will be reflected in a lower net price when that data is reported by College Navigator.
My analysis is based on numbers available to the public. One place where my analysis falls short is within the highest income quintile of families, which the College Navigator data does not break out. Duke’s full-pay students are likely from families in the top 5% (as illustrated in Table 2), and many probably are in the top 1%. Those families can decide if paying $90,000 or more for their child to attend an Ivy Plus college is worth it. Based on current full-pay enrollments, a substantial number make the choice in the affirmative.
Another area where my analysis falls short relates to the numbers of applications. There is no doubt that these highly selective universities have more than enough qualified applicants to review. At the same time, what would the data look like if they published their applications and acceptance rates by two pay types; those that received financial aid and those that were full pay? I suspect the rates are different, if only because I believe there’s a cap on the amount of financial aid that is awarded each year.
The public’s perception of the value of colleges and universities has declined, particularly if their children have to borrow money to attend. The “no-loan” or “minimal loan” policies of the Ivy Plus colleges and universities, as well as their brand value and selective admissions, position them to avoid the declining value perception.
In my opinion, the Ivy Plus institutions (plus a few more elite colleges that currently aren’t included in the group) will continue to have pricing power for a while. I can’t say that for most colleges and universities. I believe we will continue to see innovative alternatives to a college degree that will attract students.
Artificial intelligence may influence some of those alternatives and could hasten a decline in enrollment at colleges and universities without a prestigious brand.


