
Prior to the availability of the College Scorecard in 2015, the U.S. Department of Education established the College Navigator website. Created by the National Center for Educational Statistics (NCES) and released in September 2007, College Navigator is the primary source for comparing colleges and universities that participate in federal student aid programs under Title IV of the Higher Education Act.
Since its launch, I have accessed data from College Navigator for friends, relatives, and me. While NCES provides access to millions of data points through tools for researchers, the College Navigator site offers more data than most individuals will need if they are seeking information about prospective colleges.
A friend of mine whose daughter is a senior in high school called me last week. He asked if I could provide him and his daughter with information about various attributes, as well as the affordability, of her favorite colleges. He remembered that I had shared similar information with mutual friends when their children applied to college.
The deadlines for submitting college applications for next year are nearing, so I thought I’d prepare a primer for anyone using College Navigator for the first time. I’ll cover all the major categories, even though I believe not everyone will need to access all the published content.
Accessing the Webpage
The link to the College Navigator website is here. A screenshot of the landing page is pasted below. I’m going to focus on using the left-hand side of the page that relates to searches for data regarding specific colleges and universities.

It’s important to know the exact name and spelling of any college included in your search. Type the exact name of the institution in the first box under Name of School. In the case of public institutions, there are often multiple institutions with the same name, and they will return a match. An example is provided below, using The University of Texas in the “Name of School” box.

A list of 12 institutions that include “The University of Texas” in their name is displayed on the webpage. Each of the listed institutions has a hyperlink to its specific page. Since many people are familiar with the flagship institution located in Austin, I’ll use it for many of my following examples. Please note that there is a box to the right of each name that you can click to add that college as one of your favorites.
After I clicked on the University of Texas at Austin, it took me to the webpage appended below. A general phone number, as well as a link to the institution’s website, is listed first, followed by the type of institution and the awards/degrees offered. The total number of students is listed along with the total number of undergraduates. The student-to-faculty ratio is also included. After the general information, 14 specific categories are listed.

General Information
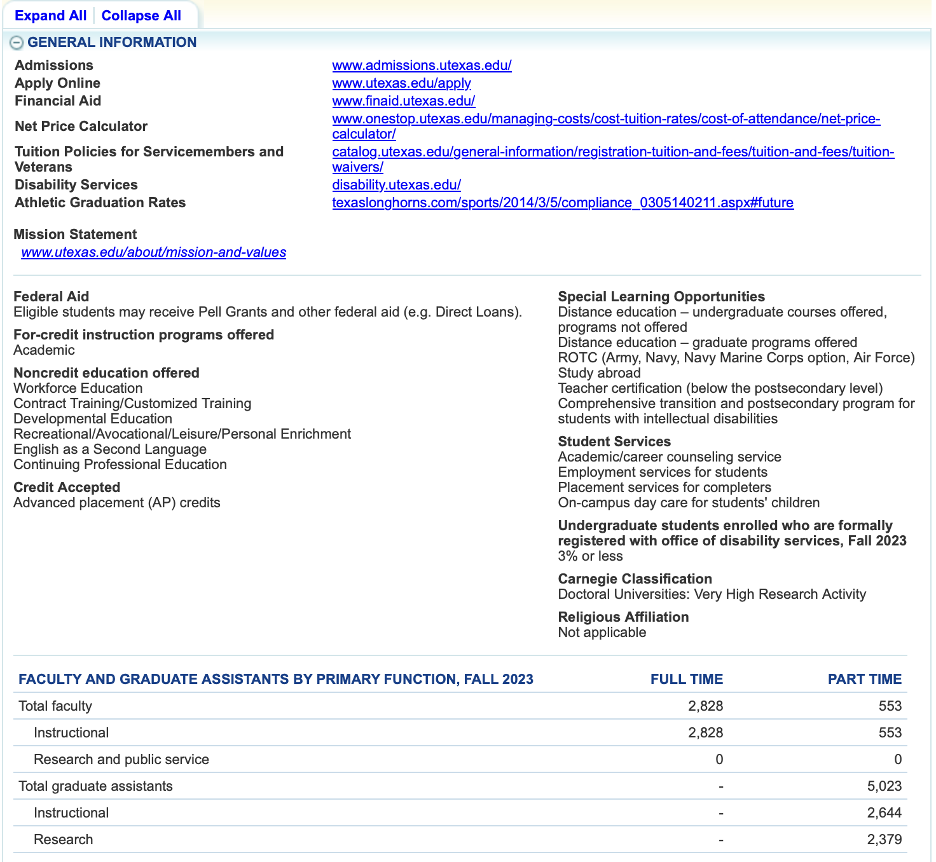
Items provided under the general information tab are displayed in the screenshot appended below. Links to the college’s admissions, applications, and financial aid webpages are listed first. These are followed by links to the college’s Net Price Calculator, tuition policies for servicemembers and veterans, disability services, athletic graduation rates, and the mission statement.
Disclosures provided in this section include participation in specific federal aid programs, for-credit programs offered, non-credit education offered, credit accepted such as advanced placement (AP) credits, special learning opportunities such as online programs, student services, the percentage of students with disabilities, the institution’s Carnegie classification (e.g., doctoral or master’s degree granting), and religious affiliation. Lastly, a box is displayed detailing the numbers of instructional and research faculty, as well as graduate assistants, who are full-time or part-time.
Tuition, Fees, and Estimated Student Expenses
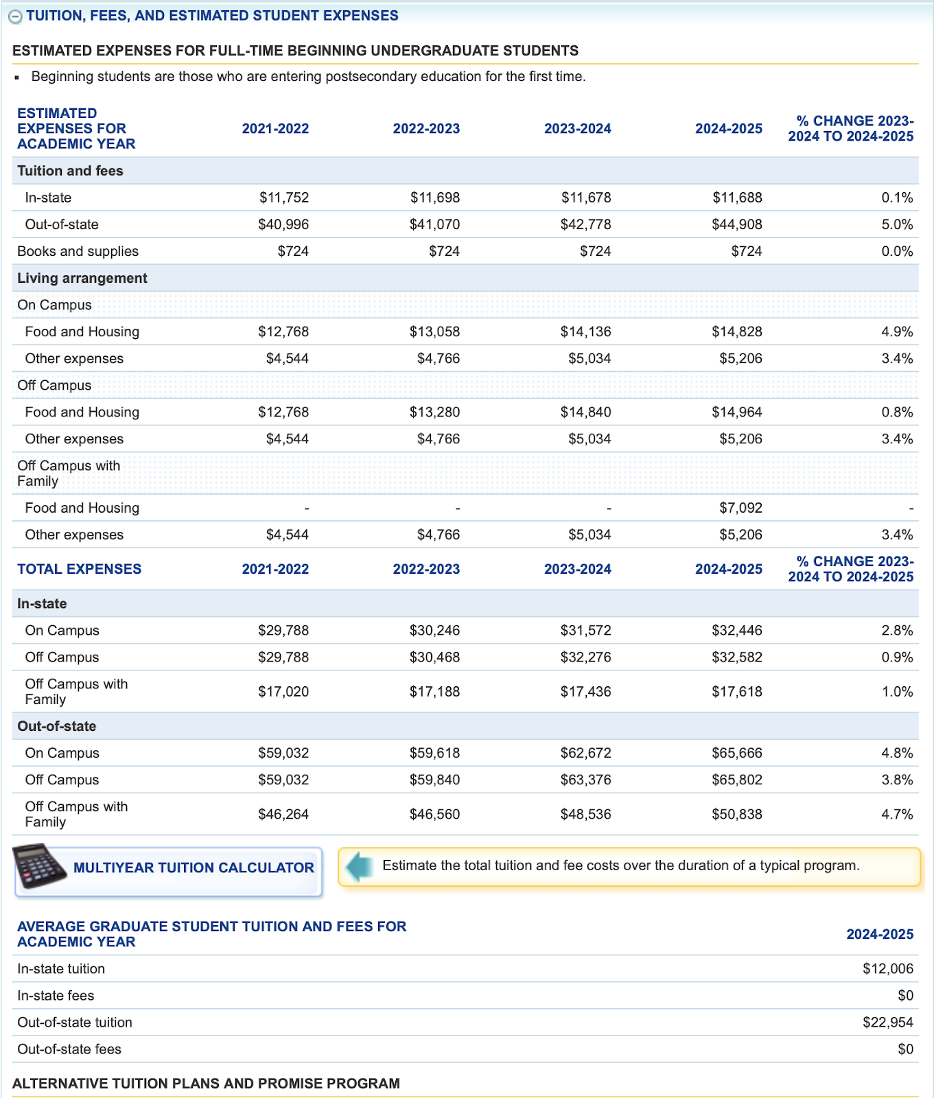
The following section is one of my most frequently visited categories. A screenshot of the items listed, including relevant data, is appended below. The tuition, fees, and estimated student expenses are listed for the four most recent years. Note that the most recent year (2025-2026) is not included. However, you can access that information from one of the links displayed in the earlier sections.
Since the University of Texas at Austin is a public, four-year institution, you can see that tuition and fees are segregated by in-state and out-of-state status. Note that the out-of-state tuition is nearly four times the in-state tuition. It’s not a surprise that some state flagships admit a substantial percentage of out-of-state students when funding is tight. The far-right column indicates the percentage change in each of the line items from the next-to-last year listed to the last year listed. In this case, tuition and fees for in-state students increased by 0.1%, and tuition and fees for out-of-state students increased by 5.0%.
Living arrangements segregate on-campus food, housing, and other expenses from off-campus food, housing, and other expenses. Lastly, the total costs of attendance are summarized by in-state and out-of-state.
Graduate student tuition and fees are also listed. I don’t find them as useful as the undergraduate tuition and fees and other expenses listed in this section, since tuition can vary by graduate school and program.
Financial Aid
Much of the content included in the Financial Aid category should be useful to prospective students and their families. It’s important to know that the information is segregated between data relevant to a full-time, first-time student (full-time first-year students) and all undergraduate students.
Examining the data for the University of Texas at Austin (see table below), it is evident that 69% of the first-year class received some form of financial aid. The inverse of that number, 31%, represents the percentage of the first-year class that received no aid or, in other words, the percentage that is full-pay.
The grant section is very expansive, primarily because UT Austin is a public institution with state grants in addition to federal grants (primarily Pell) and institutional grants. Nearly 50% of the first-year class (47% specifically) received grants averaging $12,060. Pell grants are federal need-based grants with an annual cap of $7,395 for the 2024-25 academic year. The table indicates that 27% of the first-year class received Pell grants, averaging $5,547. State grants were awarded to 32% of the first-year class, averaging $7,410. Institutional grants were awarded to 40% of the first-year class, averaging $4,449.
It’s already been observed that 31% of the UT first-year class are full-pay students. The loan section indicates that only 30% of the first-year class needed student loans to help them pay for their cost of attendance. This is likely a result of two factors: (1) the percentage of the class that represents Texas residents receiving in-state tuition, and (2) the percentage of the class from wealthier-than-average families.
The financial aid data for all students largely mirrors the data for first-year students. The percentage of students receiving grants is 51% (compared to 47%), and the percentage of all students receiving student loans is 27% (compared to 30%).

Net Price
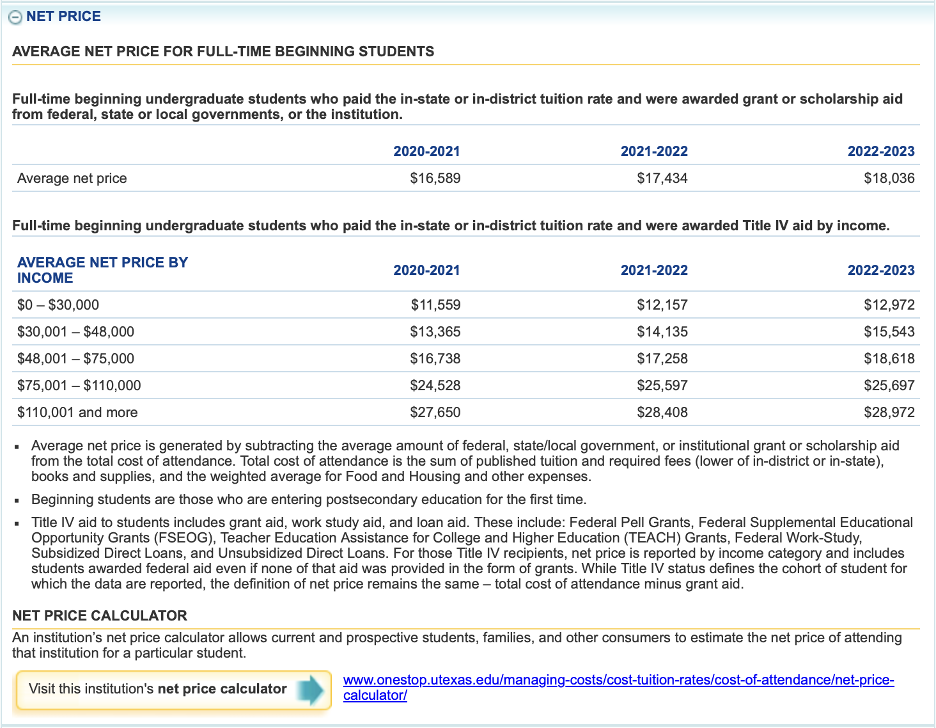
Net Price is the next category. It’s very useful if you understand the context of institutional grants. Since the 1990s, institutional grants (unfunded and funded) have grown as a major source of financial aid, primarily merit aid. What the net price represents is the cost of attendance after all grants are deducted from the cost of attendance. For a state institution like UT Austin, the net price is displayed for in-state students only (see the table below).
This table illustrates one of the oddities of using data from the Department of Education. In this case, the last year displayed for net price is 2022-23, while the last year displayed for tuition and costs of attendance is 2024-25. If tuition and other costs have substantially increased since the academic year 2022-23, it’s likely that the net price has also increased.
The average net price reflects the average for all first-year students. The table also includes a breakout of the average net price by income quintile. There are several observations I have made from the listed data.
UT Austin appears not to be very sympathetic to financially destitute students. In the lowest three income quintiles, students are expected to pay $12,972, $15,543, and $18,618, respectively. That’s more than federally subsidized student loans will cover, and it’s unlikely that families in these brackets can afford to pay out-of-pocket for these net prices.
Second, the last income quintile, $110,001 and more, should be broken into multiple sections. While the in-state costs of attendance for UT may appear to be reasonable, they’re not reasonable for everyone. If it were up to me, I would break out the upper quintile into the following groups: $110,001-$200,000, $200,001-$300,000, $300,001-$400,000, and $400,001 and above. Given that some of the Ivy Plus universities have policies waiving tuition for families with incomes less than $175,000-$250,000, I think the breakouts are reasonable and could be insightful. It’s important for someone whose family income is closer to the upper end of the ranges I listed to understand that the average for the $110,001 and more quintile is influenced by the incomes of the students in that quintile. An average is an average and may not reflect your actual net price.
Enrollment
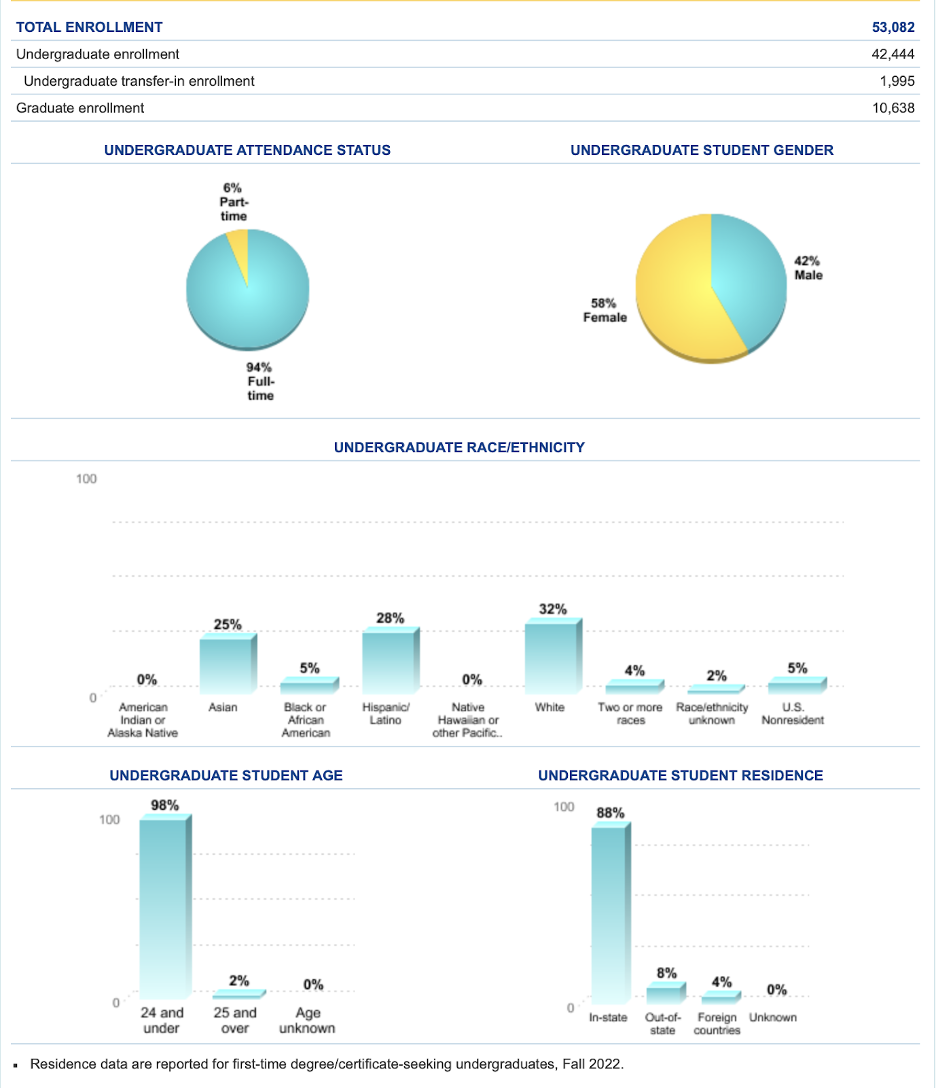
Most of the enrollment information provided by the Department is displayed in charts and graphs (see below). A review indicates that a substantial majority of undergraduate and graduate students at UT Austin are full-time. More than 90% of undergraduates are full-time. Almost 90% (88%) live in the state of Texas.
The student body is diverse from a racial/ethnicity perspective and reflects the population of Texas, where the population percentage of Hispanics far exceeds the percentage of African Americans. Very few graduate students take online courses, whereas almost half (44%) of undergraduates take at least one online course each year.

Admissions
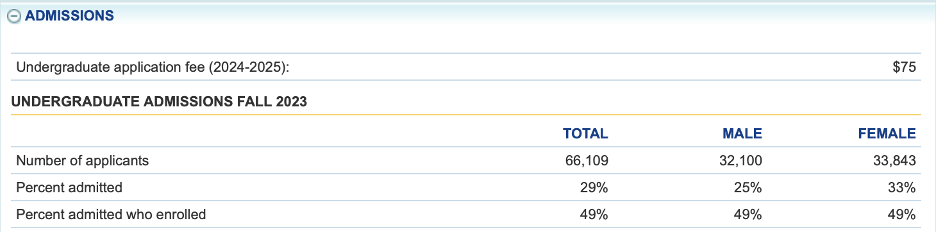
The admissions section is useful for understanding the relative selectivity of the school’s admissions process, as well as some of the academic criteria required for a successful matriculation (see below).
More than 65,000 applicants applied for admission to the most recent first-year class. UT Austin admits fewer than half of its applicants (29%), which makes it selective compared to most colleges. However, nearly 49% of all those accepted, matriculate. As one of the state’s flagship universities, UT Austin guarantees admission to any Texas public high school student in the top 6% of their class. State pride and spirit are likely reasons for the high matriculation rate.
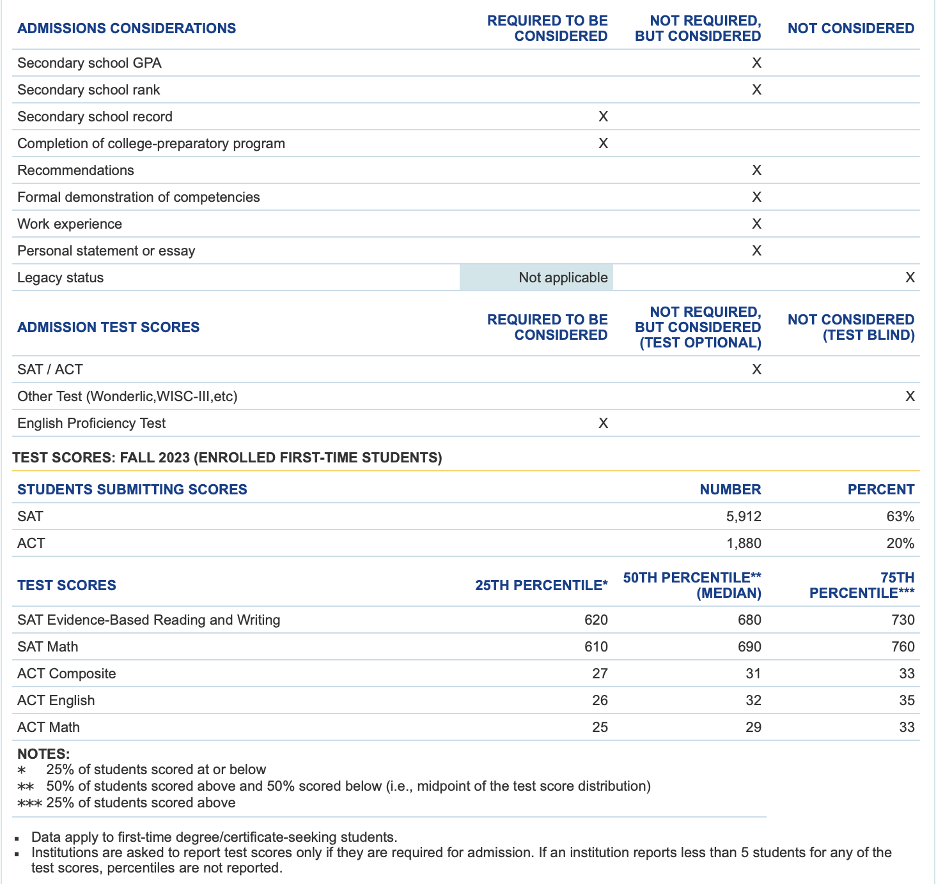
SAT/ACT scores are not required to be submitted; however, more than 63% of applicants submitted one of these scores. The median SAT reading and writing score was 680, and the median Math score was 690.
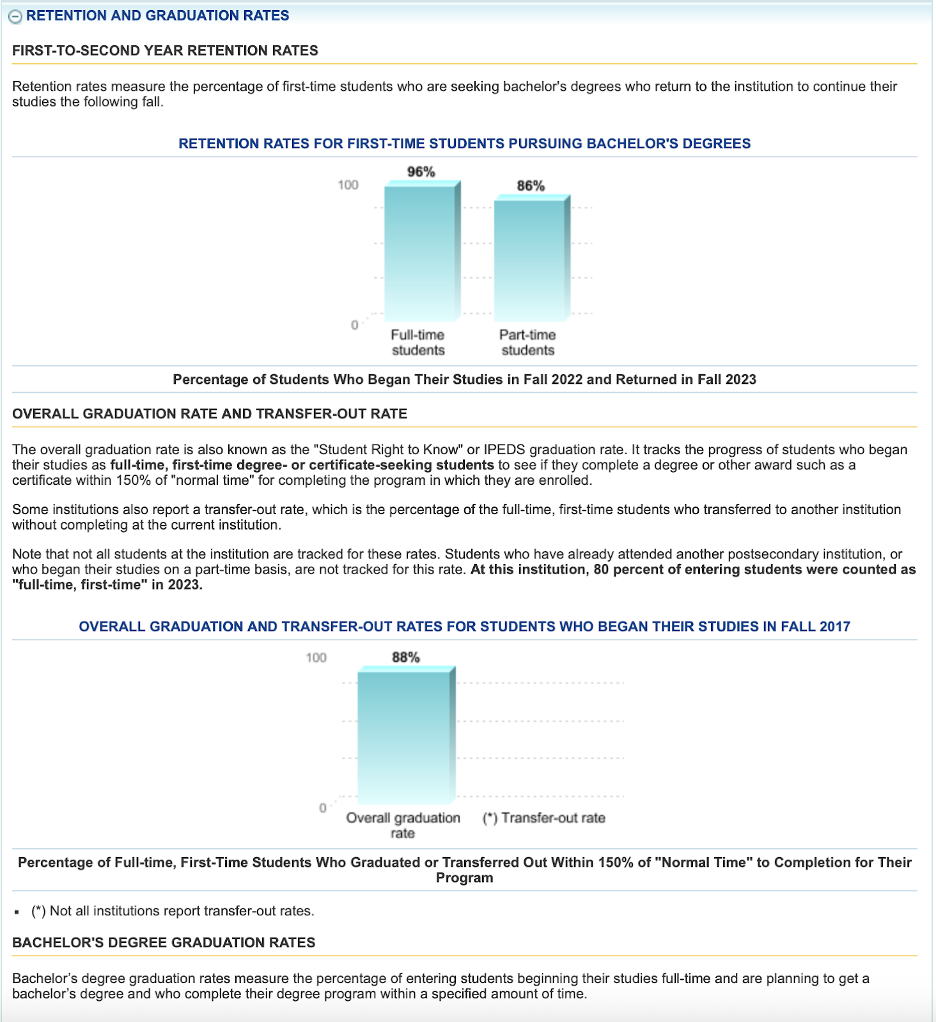
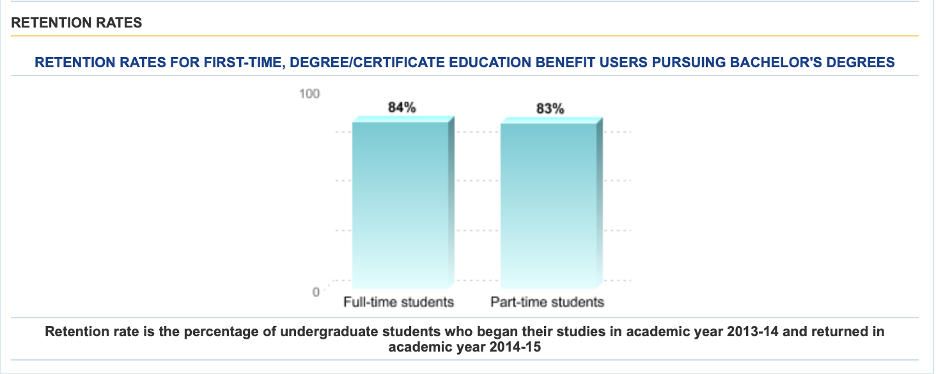
Retention and Graduation Rates
Retention rates at UT Austin are very high for full-time (96%) and part-time (86%) first-year students. The overall graduation rate at 88% is very high, and the transfer rate is virtually non-existent.
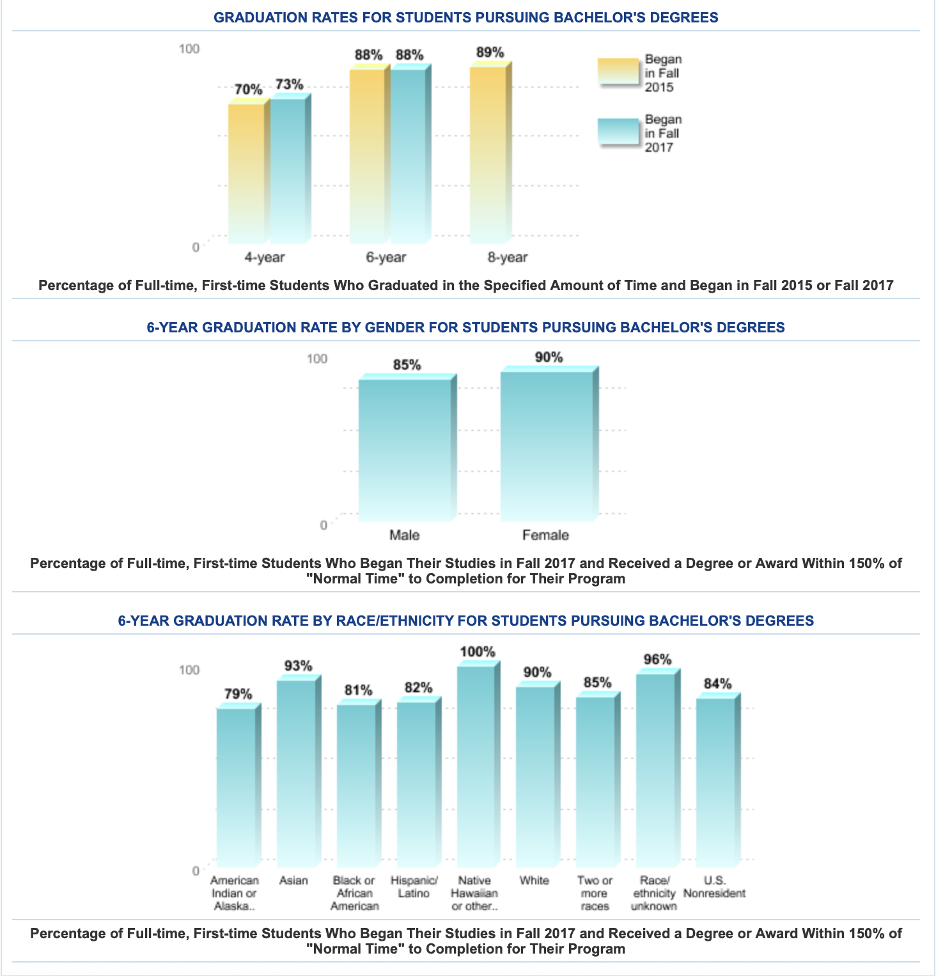
Like many colleges and universities, the six-year graduation rate is higher than the four-year graduation rate. The four-year graduation rate is 73% and the six-year rate is 88%. Women graduate at a slightly higher rate (90%) than men (85%).
The graduation rate by race and ethnicity ranges from a low of 79% to a high of 100% with most groups near the 88% median graduation rate.
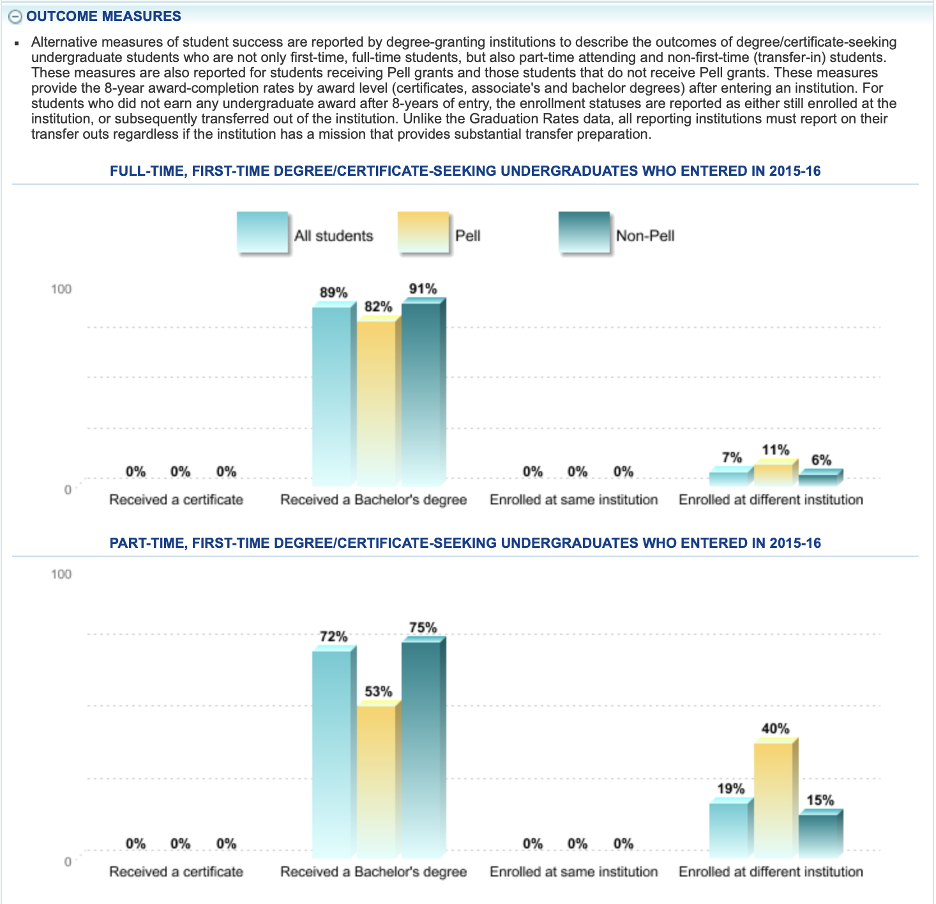
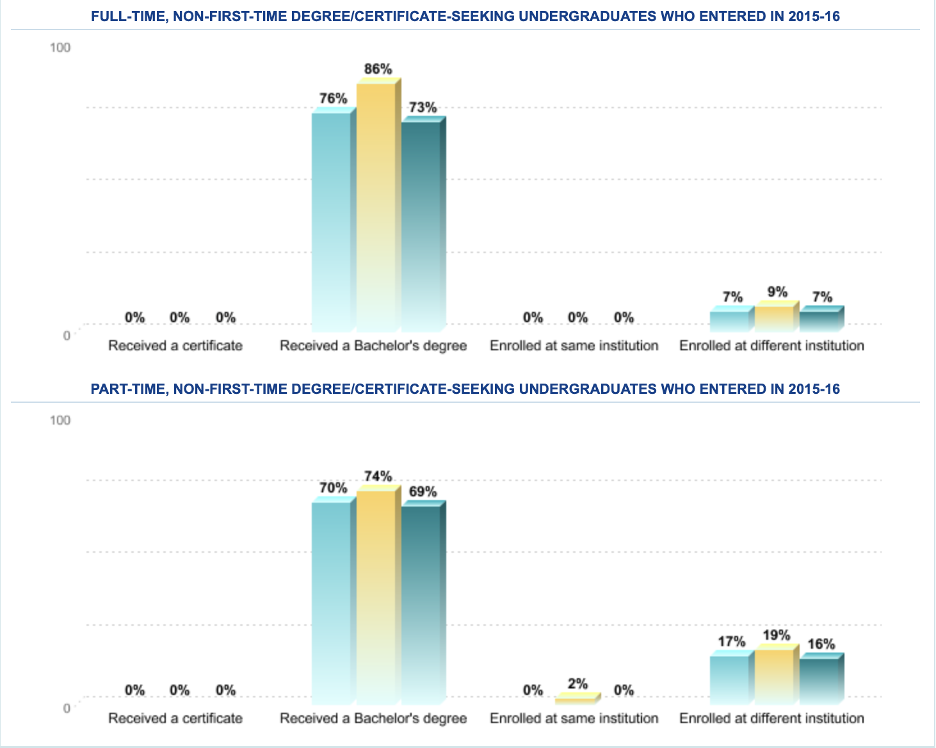
Outcome measures
Outcome measures report completions on an eight-year cycle for non-traditional, non-full-time students (see chart below). These outcomes look very good compared to those of non-traditional students at other colleges and universities.
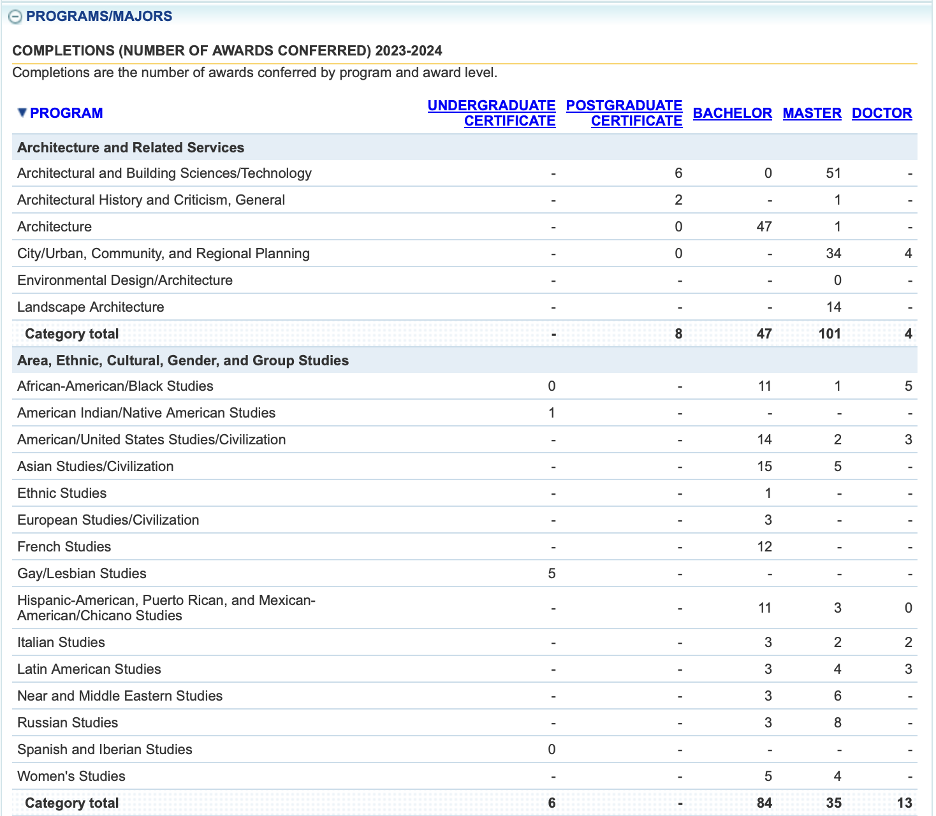
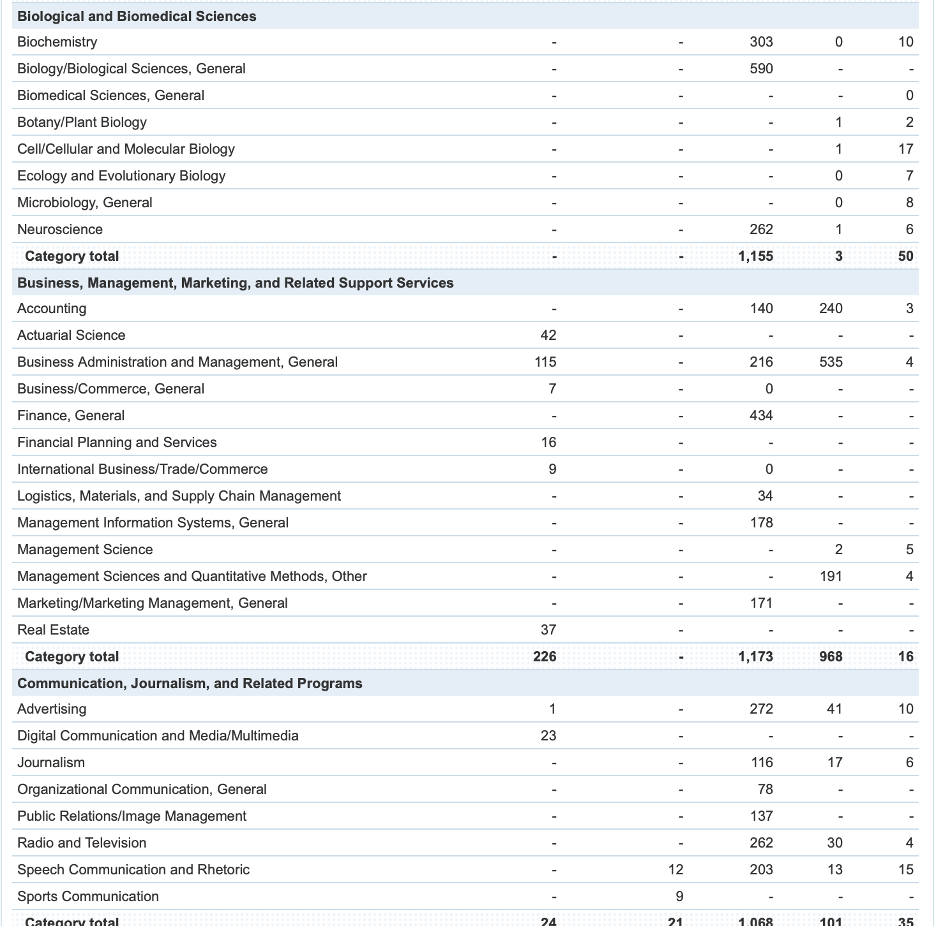
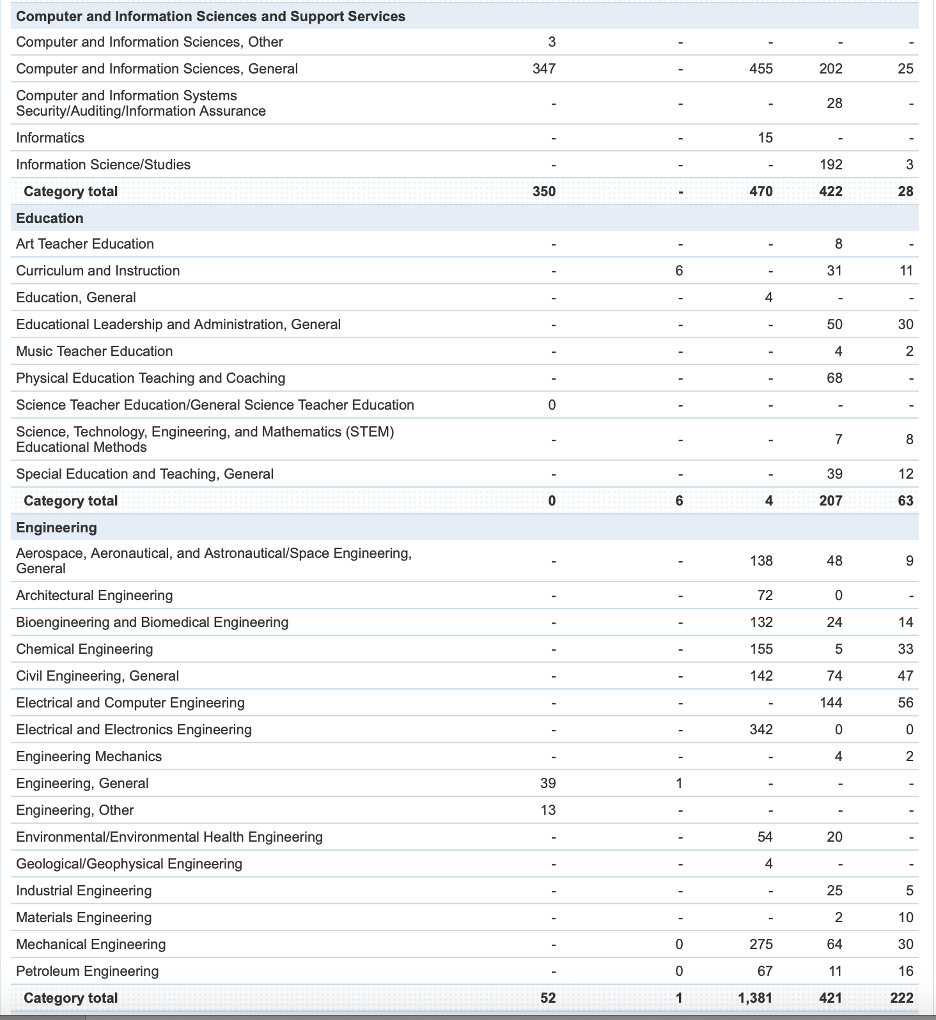
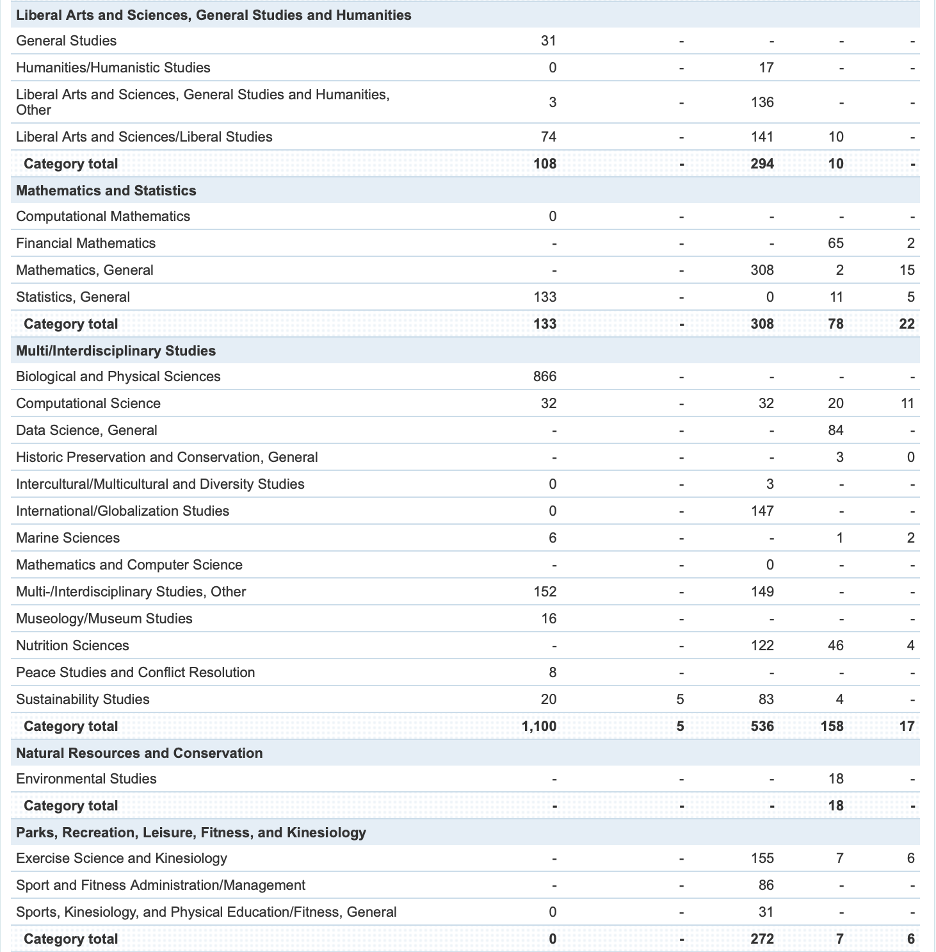
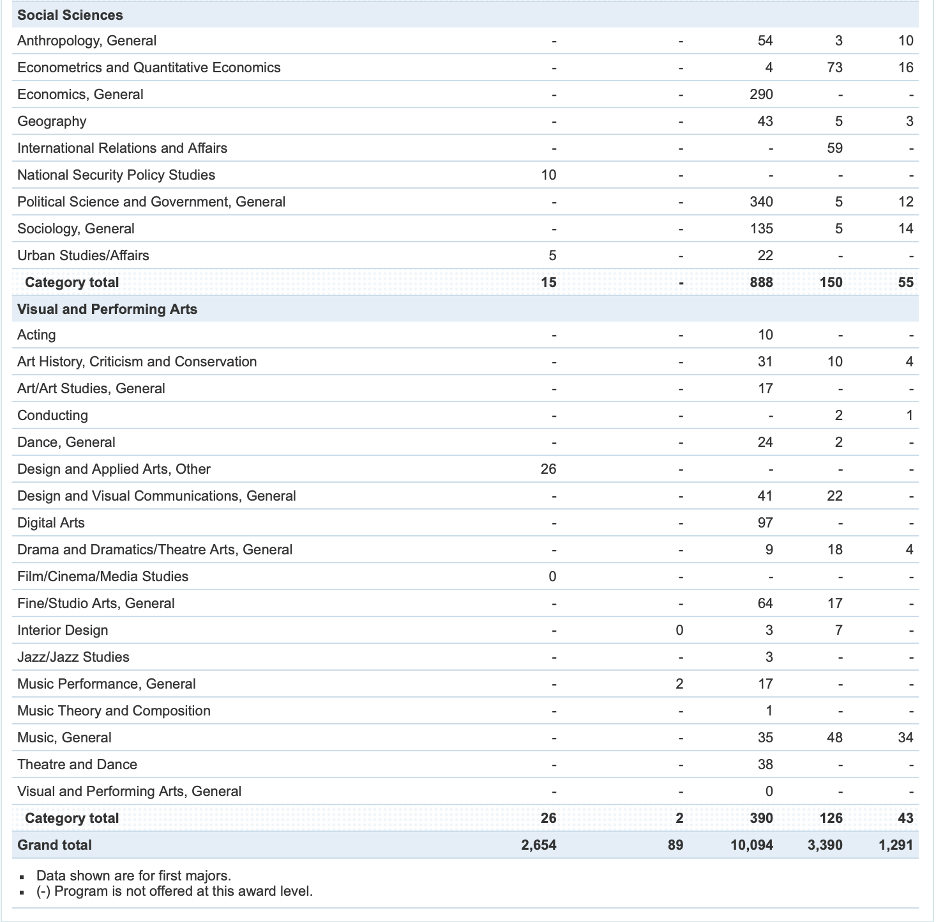
Programs/Majors
As you might imagine, the list of completions by program/major for a public flagship institution of UT Austin’s size is substantial. More than 10,000 undergraduate degrees were awarded for the most recent year reported.
The completions data by program/major is useful to see the programs offered, and more importantly, the more popular programs selected. It appears from this review that UT does not have many traditional liberal arts graduates compared to its students completing STEM programs and business programs.


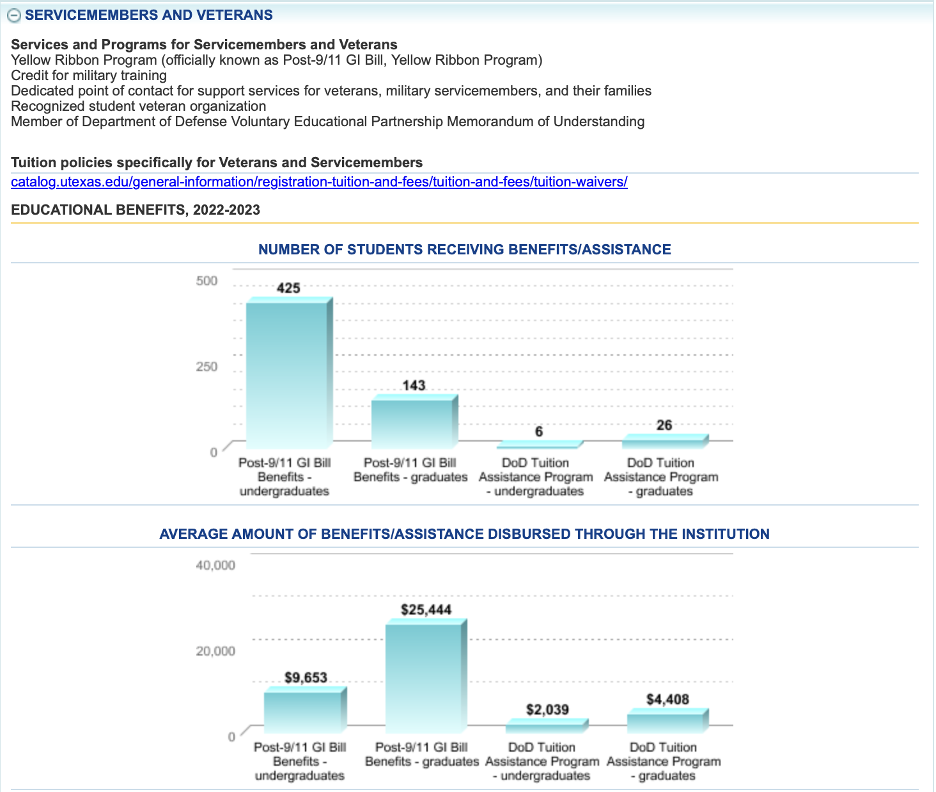
Servicemembers and Veterans
The Department collects data on the enrollment and outcomes success of students who are servicemembers and/or veterans (see chart below). Based on average revenues per student, UT Austin enrolls more veterans (568) than servicemembers (32), and most of their enrollments (425) are at the undergraduate level.
Varsity Athletic Teams
Given UT Austin’s notoriety as a formidable power in NCAA Division 1 sports, I was surprised at the lack of depth of its data table (see below). The link at the bottom refers the reader to another website operated by the Department of Education regarding equity in athletics. I believe this site is the compliance site to ensure that men’s and women’s athletics are equally matched in terms of participants.
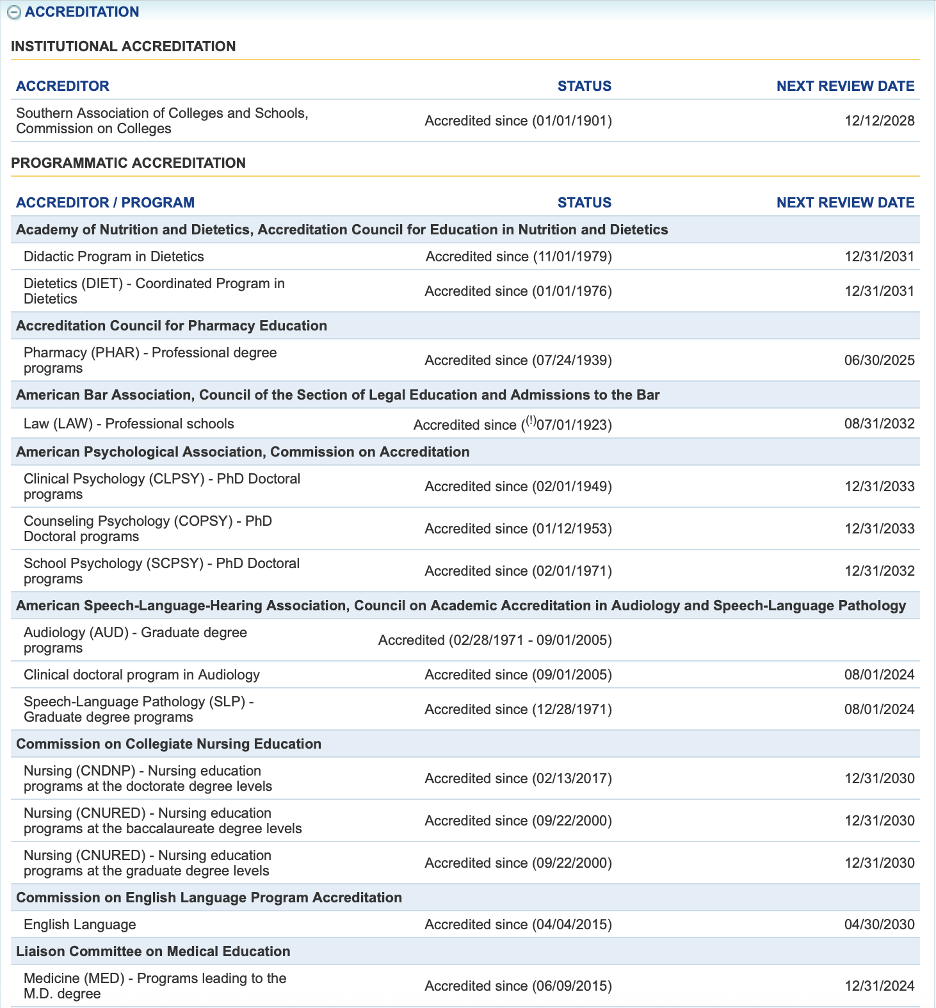
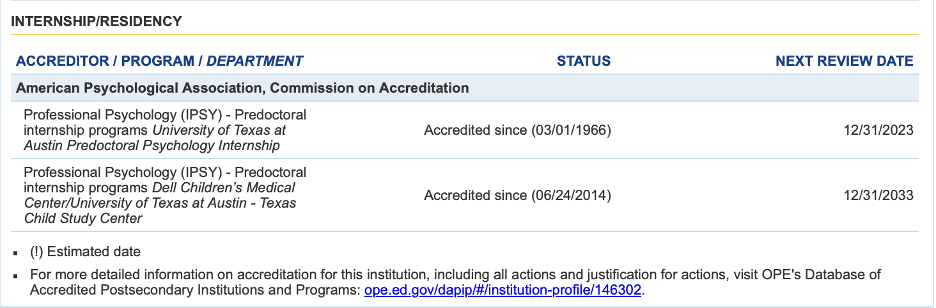
Accreditation
Many people associate accreditation with a college or university’s institutional accreditor. In the chart below, the institutional accreditor, in this case, the Southern Association of Colleges and Schools, Commission on Colleges, is listed first. The date of first affiliation is 1901. The remaining accreditors are specialty accreditors. It is not a surprise that there are a few of them, given UT Austin’s status as a research institution and state flagship university.
In all cases, the accrediting agencies listed include the date of the university’s first affiliation with that agency as well as the date of the next scheduled reaccreditation.
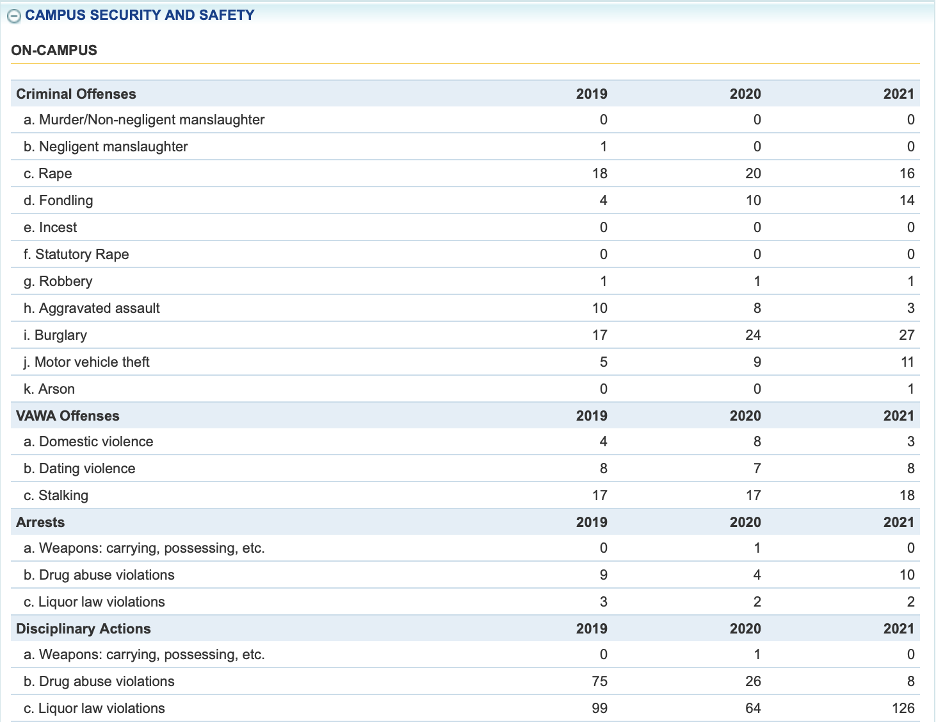
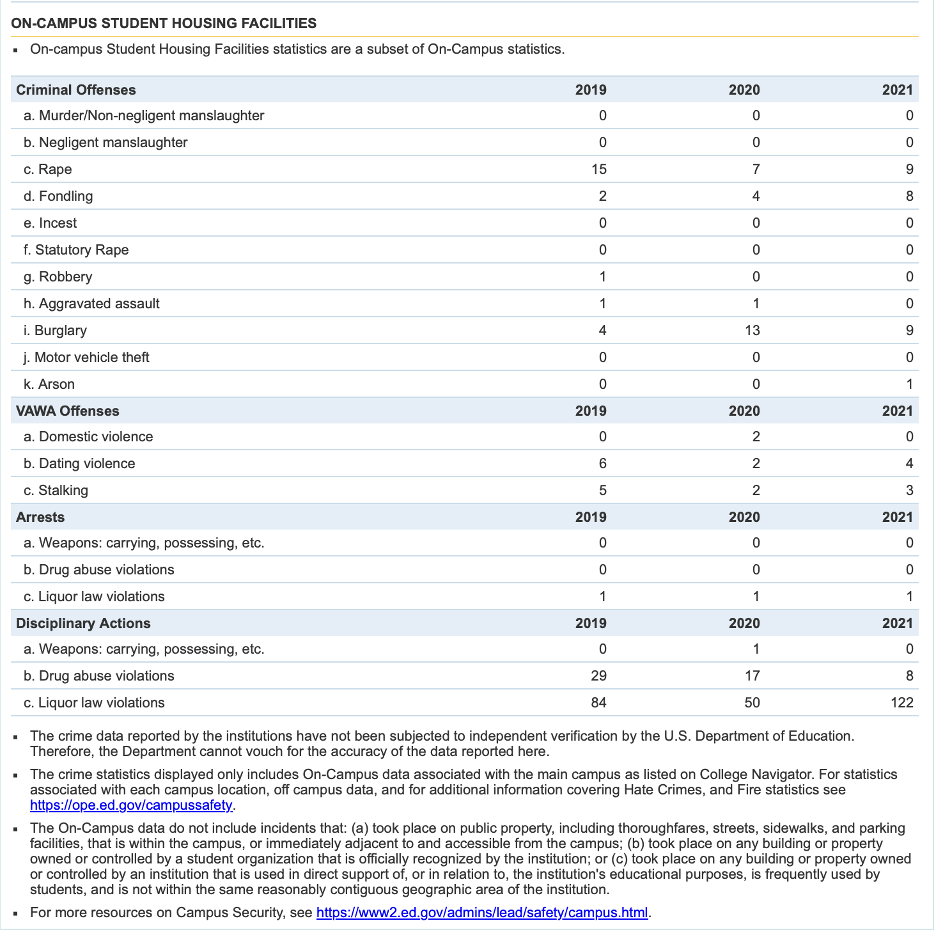
Campus Security and Safety
Ever since Congress passed the Jeanne Clery Campus Safety Act in 1990, college campuses have been obligated to file an annual report of crimes that occurred on their campuses. The report below is a shorter summary of the reporting required to be submitted to the Department of Education.
Cohort Default Rates
Colleges and universities that participate in federal loan programs are required to publish their loan cohort default rates (cohorts are defined by the financial year in which the loans were borrowed). Low cohort default rates are a good indicator that graduates can repay their student loans on a timely basis. The report below has 0% for the cohort default rates for two of the three years listed and a rate below 1% for the third year. Student loan repayments were suspended during the term of the Biden presidency and were only recently restored by the Trump Administration. These numbers will be more meaningful for all colleges and universities after a few years of repayment data are available.

A Worthwhile Tool
I use College Navigator all the time. The data presented is more substantive and more thorough than the consumer-oriented College Scorecard. When I share the data with parents of prospective college students, their biggest surprises include the number of merit aid grants, the average dollar value of merit aid grants, and the average net price of college for institutions that their children are considering.
The Ivy Plus institutions provide the lowest amount of merit aid (tuition discounts) but also are the most generous with financial aid to students from the lowest income quintiles. That data was obtained from College Navigator. I have also looked at the provisioning of financial assistance from Elite Private Colleges, Major Public Universities, HBCUs, and Community Colleges. I compared the practices of all these groups in a separate article. Community Colleges are in second place, primarily because of their low cost of attendance.
As a former college parent, I found the selectivity data, total cost of attendance data, and net price data to be most useful when my children evaluated potential colleges and universities.
Given the substantial resource cuts at the Department of Education, I hope the Department continues providing College Navigator data to the public. As American families continue to be concerned about the high cost of higher education, the data presented help confirm or dispel those concerns.