Shortly after the U.S. Supreme Court decision was issued that outlawed affirmative action, calls went out for elite institutions to end legacy admissions in order to admit more low income students. Many of these calls were for the 12 Ivy Plus institutions to end their admissions preferences. I wrote an article providing details of the Ivy Plus cost of attendance as well as major financial aid subsidies for low income students.
Because there are only 12 Ivy Plus institutions, I was challenged by a colleague to review admissions and financial aid data at other elite private colleges and universities. After this review of 66 additional private institutions, I had analyzed the costs of attendance and financial aid awards at 78 selective admissions private colleges and universities.
Some state flagship universities admit less than 50 percent of student applicants, and that triggered another review, this time of major public universities. I selected 88 state universities, not all highly selective. The 88 universities selected enrolled 3,058,832 students last year. While high population states had several public universities included, not all states were represented.
Historically Black Colleges and Universities enroll a significant percentage of students of color. I reviewed the cost of attendance and financial aid awards data from 97 HBCUs in order to see how their financial aid policies benefited their students compared to other colleges and universities, specifically the ones I previously analyzed.
America’s community colleges have been lauded for years for their low tuition and open access. I looked at the tuition, admissions and financial aid information from 50 top ranked community colleges. I compared their cost of attendance and net price per student with the other four groups.
Cost of Attendance Differs Widely
For purposes of discussion, I returned to my original analyses to provide a few summary data tables for the five distinct groups of colleges and universities.
Data for undergraduate and total enrollment, undergraduate cost of attendance, and the percentage of applicants admitted are provided in Table 1 below.
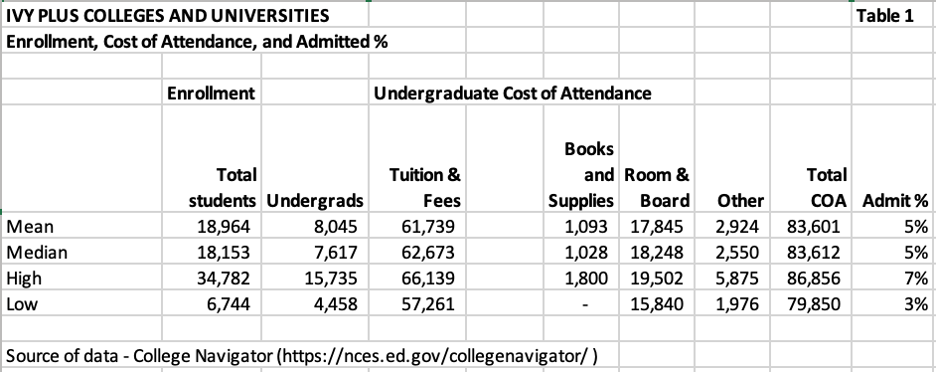
The mean and median enrollments for the 12 Ivy Plus institutions are similar although there is a wide range between the highest enrollment (Columbia University) and the lowest (Dartmouth College). The mean cost of attendance of $83,601 is only $11 lower than the median cost of attendance of $83,612. Admitted percentages are 5 percent for both the mean and median.
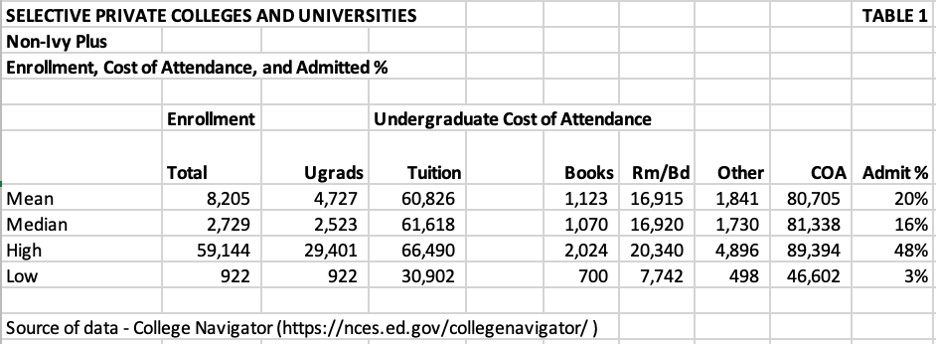
Total enrollments varied more widely when selective private colleges and universities were grouped together with a high of 59,144 students (NYU) versus a low of 922 (Harvey Mudd). If you believe that larger enrollments create greater efficiencies and lower costs, you would be wrong. The mean COA was $80,705 and the median was $81,338. The mean and median admitted percentages were 20% and 16% respectively.
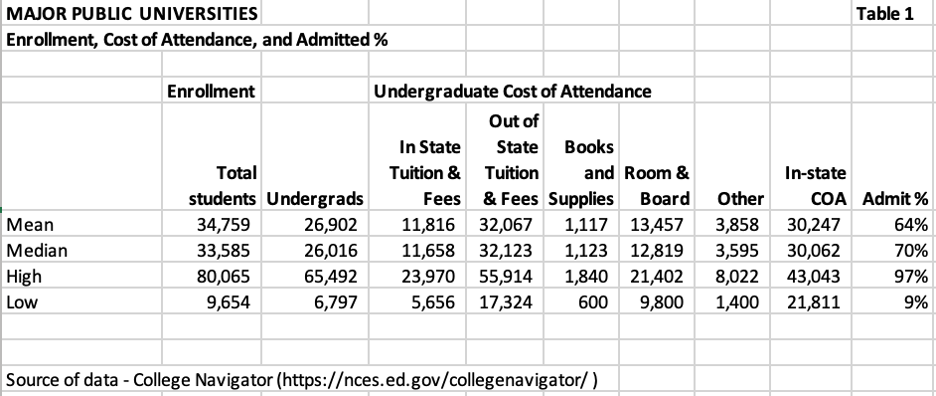
As expected, with subsidies from state budgets, the COA for major public institutions decreased dramatically from the Ivy Plus and Private Colleges and Universities. The mean and median in-state COAs were $30,247 and $30,062 respectively. For out-of-state students, the mean and median COAs were $50,499 and $49,671.
Mean and median enrollments were 34,759 and 33,583 while mean and median admitted student percentages were 64% and 70%. While these universities are not as highly selective as the first two groups of private universities, their percentages of students admitted are far less than open enrollment institutions.

HBCUs include private and publicly funded colleges and universities. Their enrollment is lower than the previous three groups with a mean of 3,045 and median of 1,879 students. Their mean and median COA is lower than major state universities with a mean of $26,308 and a median of $25,280. Their mean and median admitted students’ percentages were 80% and 85% and are less than the major universities’ admission rates.

Among the top 50 community colleges, their mean of 9,475 and median of 7,223 student enrollments were closer than their high enrollment of 51,896 (NOVA) and low of 1,149 (NCCC). COA mean and median were nearly the same at $11,979 (mean) and $11,086 (median). All applicants to this group of colleges were admitted.
Net Price Provides Insight Into College Business Models
Tuition discounting has been a practice utilized by private colleges and universities for years. Recently, large public colleges have utilized the practice to attract higher qualified students with merit scholarships. Because of the prevalence of tuition discounting, the Department of Education requires institutions to submit data on non-federal grants as well as federal grants.
In the series of Table 2 exhibits that follow, I have attempted to include enough data to provide a comparison between the relative wealth of students to the net tuition by income quintile. The results provide a contrast with some of the unsubstantiated statements of critics of institutions that admit high income students.

Approximately 40% of freshmen at the 12 Ivy Plus institutions are wealthy enough to be able to pay the $83,601 average COA. The mean percentage of Pell students is 16. Only 10% of students have federal loans primarily because these institutions have committed to include no loans in aid packages to students with a family income less than $125k or sometimes more.
At the same time, the percentage of full-pay students and very large endowments have allowed these institutions to provide a very low net price for the four lowest income quintiles averaging $3,117; $2,518; $6,490, and $16,012 for the $83,601 COA. You don’t have to be a mathematical genius to realize that the full pay percentage is lower than expected because of the high endowment subsidies for financial aid.

The 66 selective private colleges and universities that are not Ivy-Plus generally do not have the same endowment balances as the Ivy-Plus. Slightly more than 30% of freshmen attending these institutions pay the $80,705 COA. The mean percentage of Pell students is 16. The mean percentage of students with federal loans is 25%.
A lower percentage of full-pay students and lower endowments means that this group is not able to cover as much of the gap between federal financial aid and $80,705 cost of attendance as the Ivy-Plus group. The net prices for the four lowest income quintiles average $10,767; $11,000; $15,244; and $24,049.

As noted earlier, the mean in-state COA drops considerably to $30,247 for the 88 major public universities. The mean out-of-state COA is $50,499. The mean percentage of students who are full pay is 17%. The mean percentage of Pell students is 26% and the mean percentage of students with federal loans is 30%.
With a lower percentage of full-pay students and generally much lower endowment balances, you might assume that the subsidies of net price at the four lowest income quintiles would not be a significant as the non-Ivy-Plus privates. However, the net prices for those four lowest quintiles average $9,788; $11,180; $14,688 and $20,042.
For state universities, the net price is based on in-state tuition. As mentioned earlier, the mean in-state COA is $30,247. The mean out-of-state COA is $50,499. I didn’t collect the out-of-state percentage of students but am willing to wager that a major percentage of the higher out-of-state COA is subsidizing the net price for students from the lower income quintiles.

The mean COA for HBCUs is less than public universities at $26,308. The mean percentage of students who are full pay is 5%. The mean percentage of Pell students is 59%. The mean percentage of students who borrow federal loans is 53%.
With a much lower percentage of full-pay students and much lower endowment balances, those factors impact the subsidy to net price for students in the lowest four income quintiles. The mean COA for all students is $14,273. The only income quintile lower than that is the $0-$30,000 group with a mean net price of $13,729. The other four quintile net price means are $14,554; $16,373; $18,755; and $20,428.
It’s clear that the HBCUs do not have the ability to reduce the net price for students from the lowest earning quintiles. If those lower income quintile prospective students have options to attend major state universities or selective private universities, their net prices will be less.

Community colleges come to the rescue with the lowest mean in-state COA of $11,979. At this price point, the mean percentage of full-pay students is 19%. The percentage of students with Pell grants is 24%. The mean percentage of undergraduate students with loans is 12%.
Average net price is $9,456 for community colleges. With the lowest COA and the lowest average net price, this group comes in second to the Ivy-Plus institutions (highest COA) for the mean net price for the four lowest income quintiles. These are $7,557; $8,208; $10,178; and $12,388. The highest income quintile mean net price is $13,007.
What Does the College Tuition Data Indicate?
I think it’s worthwhile to organize data from each of the five groupings in another table, Table 3. This illustrates the percentage of sources of payments for tuition as well as the delta between the COA and Average Net Price.

This chart for the Ivy Plus institutions provides a strong contrast between the wealth of students. With approximately 40% of first year students receiving no aid, 55% receive an average institutional grant of $52,900. The average Pell grant of $5,128 is quite small compared to the Ivy Plus institutional grant. The average loan balance of $6,165 is low as well.
The gap of $60,600 between the average COA and the average net price will likely surprise the harshest critics of “legacy admissions” and wealthy students attending the Ivy Plus institutions. The facts are that students from the three lowest income quintiles pay less than $6,500 per year to attend and some of those costs may be offset from work-study jobs which are not deducted from net price.

With an average COA approximately $3,000 less than the Ivy-Plus group, the selective private colleges and universities provide an average institutional grant of $44,402, almost $8,500 less than the Ivy-Plus group. The average net price is $7,700 higher than the Ivy Plus group. My assumption is that most of this “gap” is covered by parents’ contributions since the average loan balance is $600 less than the Ivy Plus group.
The overall difference between the average COA and the average net price is approximately $50,000. The bulk of that difference is covered by the average institutional grant. Fewer students are full pay compared to the ivy-Plus and nearly 25% borrow federal loans to cover some of their costs. Endowment balances and full pay student percentages make a difference.

Only 17% of students attending major public universities are full pay. I was not able to find the data to separate in-state full-pay students from out-of-state full-pay students. The average net price reported is based on in-student rates, and the gap between in-state COA and average net price is less than $14,000.
The percentage of students with Pell grants increased to 26% for this group. Another criticism of the Ivy Plus and other elite private institutions is the percentage of students receiving Pell grants. Surprisingly, the percentage increase is not that great for public majors given the much lower COA and average net price.

Nearly 100% of students attending HBCUs receive aid. The average COA is lower than the major state universities at $26,308. Approximately 80% of students receive an average institutional grant of $10,682 and nearly 60% (59%) of students receive Pell grants.
When you look at net price per income quintile, it’s questionable how students from the lowest income brackets can afford to attend an HBCU. The net price for the $0-$30,000 quintile is $13,729. The average loan per student is $6,147 which is higher than the freshman dependent student cap of $5,500. Parent PLUS loans are another option, one that I believe should not exist given the financial burden added.

Even though community colleges have the lowest COA ($11,979) of the five groups I reviewed, the percentage of full-pay students is only 19%. While 24% of freshmen receive Pell grants, the average grant is the lowest ($3,884) of the five groups, most likely because a higher percentage of community college students are part-time.
Grants only reduce the average net price at community colleges by $2,500 to $9,456. In looking back at Table 2, the average net price for the $0-$30,000 income quintile is $7,557. Again, that’s not very affordable for anyone in that income bracket. The average loan amount is $5,500, close to the federal max for freshmen. Many students may opt to live at home, thereby reducing the average COA and their personal costs.
Final Thoughts on Financial Aid
During this review and analysis, I collected a lot of data from the National Center for Educational Statistics’ College Navigator dashboard. All this information is easily accessed by anyone with a computer or smart device and access to the internet.
Reviewing college and university data one-by-one is never as insightful as aggregating groups of colleges based on a similar trait or characteristic. My colleague who suggested that I compare my analysis of Ivy Plus universities with other elite colleges and universities thought some useful information would surface.
After reviewing data from the private colleges and universities, I realized that I needed to look at other groupings. Major public universities and community colleges are just two of many possible groupings of public colleges and universities including a state-by-state analysis. HBCUs are a distinctive group that can also be separated by private vs. public and state vs. state.
In Table 4 below, I listed the mean data for specific categories in each of the five groups as I reviewed them. Coincidentally, the group is sorted by Cost of Attendance from high to low.

It has been clear to me for some time now that the institutional wealth and wealth of the full-pay students at the Ivy-Plus colleges and universities provides a generous subsidy for students whose families are unable to afford an undergraduate education that costs $83,600 per year. The number and percentage of full-pay students are important anywhere they choose to attend.
No other group subsidizes the first three income quintiles as much as the Ivy-Plus institutions do even though the COA is substantially lower in the case of the publics and HBCUs. Student loans are a problem for the poorest families. None of the other four groups have the endowments, public subsidies, or wealthy full-pay parents to subsidize the COA for their lowest-income students.
The major publics have figured out a strategy to supplement their income which is to recruit out-of-state students. It’s amazing that the markup averages more than $20,000 per year for an out-of-state student. If I were a prospective student in the lower end of the highest income quintile, I would seriously consider attending my in-state major public.
Given the cost of college, it would be useful if data from the top quintile could be parsed into more categories. There’s a huge gap in families’ ability to pay for college between families earning $125,000 per year and those earning $250,000 or even $400,000 per year.
I am a long-time proponent of everyone having access to affordable higher education. Average net price is defined as the average Cost of Attendance minus all grants, federal, local, state, and institutional. Based on the data, most colleges are not affordable for lower income students.
As one of the first recipients of a Basic Education Opportunity Grant (Pell Grant original name) in 1973, I balked at the admissions preferences given to legacy students at that time. My $1,000 grant covered approximately 25% of the COA at Duke back in the 1970s. Today’s maximum Pell grant of $7,395 would cover 9% of Duke’s $82,749 COA.
I’m certain that legacy students are in the 43% of no-aid families at Duke, and that they cover a portion of the average annual grant of $50,142. If legacy admissions are banned, Duke (and other universities) would have to find full-pay families to help subsidize their grants to lower income families. Contrary to statements from those who oppose legacy admissions, lower income students would not replace them. The evidence is clear.
It’s obvious to me that we need to revise our financial aid system since grants do not cover a large enough percentage of the Cost of Attendance for our low-income students. A matching program for Pell Grants like the GI Bill’s Yellow Ribbon program would be useless given the size of the average institutional grants awarded today.
Increasing student loans is not the answer. Free community college program subsidies from each of the 50 states may be the only solution for low-income students other than subsidies from full-pay families at selective private institutions or out-of-state students at major public universities.
Economic principles indicate that alternative sellers will enter a market that is over-priced. We’re seeing some of that with increased growth in shorter credentials and certificates. Will these options ultimately replace a bachelor’s degree in stature? I doubt it. Will alternative forms of degrees like the three-year bachelor’s increase? If so, the only institutions that can likely afford to maintain the status quo will be the most selective institutions with the highest percentage of full-pay students.


