
It’s almost impossible for a week to go by without reading about financial difficulties for institutions in the higher ed sector. From small private colleges with projected enrollment declines to large public universities dealing with declining per student subsidies from the state legislature, the stories abound. Earlier this year, I wrote about projected losses in the SUNY System and last week, I wrote about proposed changes in Pennsylvania higher ed. I decided to look at Pennsylvania’s situation a little deeper.
As mentioned in my earlier article, Penn State’s president announced on January 22 that the Penn State system needed to adjust its operating model to offset a projected $100 million deficit in 2025-2026. She proposed a number of ideas how they plan to find savings in expenditures. Importantly, the Penn State plan differentiates between changes at its main campus and changes at the Commonwealth campuses.
Student Enrollments by Campus
In order to assess a few of their ideas, I created a list of the Penn State University System campuses in order to track public data about them. In Table 1 below, I list the main campus first, followed by the Commonwealth campuses, and bookended them with the Penn State World Campus (its online campus). The table lists the total enrollment for each campus and the undergraduate enrollment as reported in College Navigator.
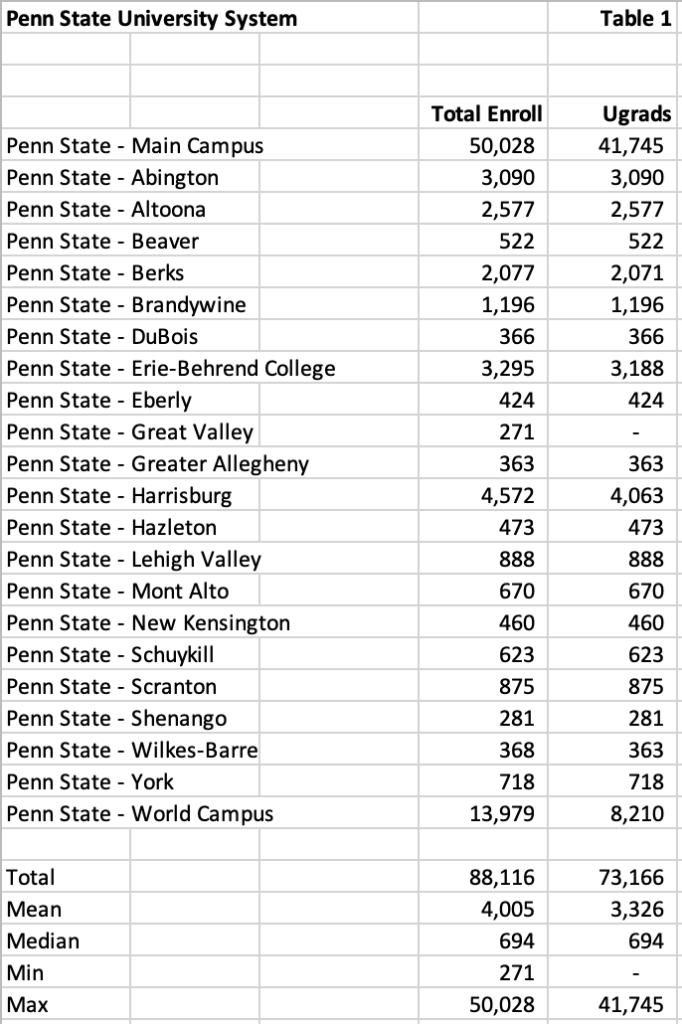
As you can see from the table, the main campus at Penn State (University Park) comprises 57% of the enrollment for all 22 campuses. The World Campus, which is operated out of University Park also, comprises 16% of total system enrollment. On a combined basis, the two institutions account for 73% of total system enrollment.
The median enrollment for the system is 694 students. The smallest enrollment is 271 students at Penn State – Great Valley (grad students only) followed by 281 students at Penn State – Shenango. There are only six Commonwealth institutions with more than 1,000 students enrolled.
The plan indicates that $54 million in annual operating expenses (14.1%) will be cut from the Commonwealth campuses. Based on some of those campuses’ low enrollments, perhaps some campuses should be cut rather than looking for similar expenses at each campus. The $383 million in overall expenses for the Commonwealth campuses reflects an average expense of $15,886 per student.
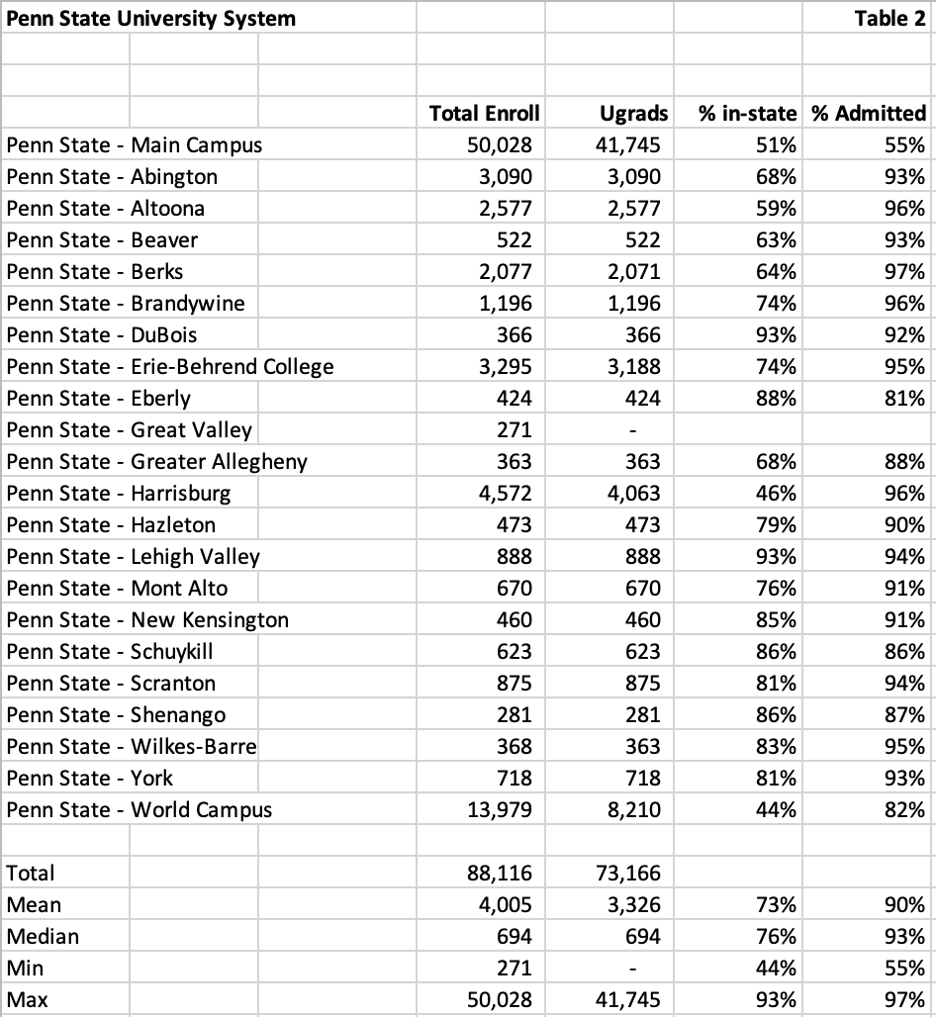
In-State Students and Admissions Rate
The data in Table 2 below includes the percentage of enrolled students that are in-state and the percentage of students that are admitted at each institution. The main campus at University Park is the most selective with a 55% admission rate. The mean admission rate for all institutions is 90% with a median of 93%. In-state percentages average 73% but are higher when the Main Campus and the World Campus are removed.
Adopting a test-option admissions policy is one of the stated goals of the plan. I’m not sure that this will make a difference anywhere other than the flagship campus given the mean admission rate of 93%.
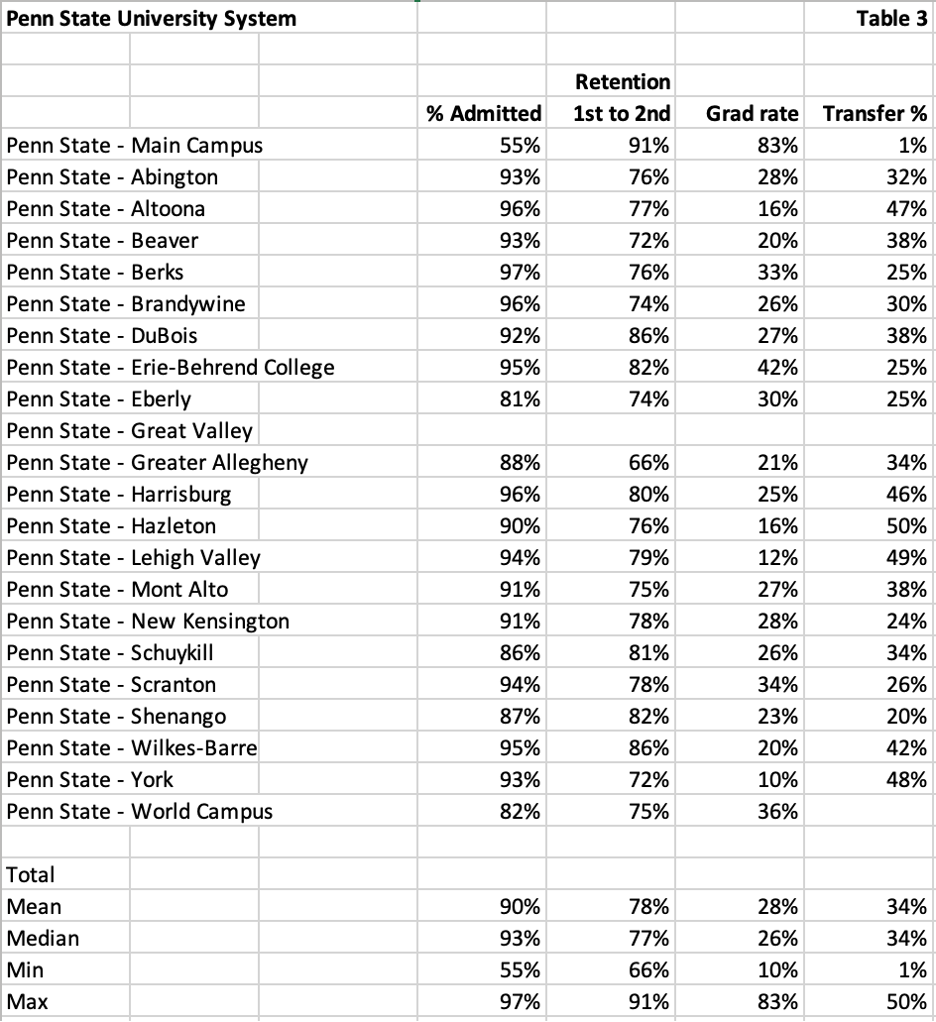
Graduation rates and Transfer Rates
It could appear from the first to second year retention rate and the overall graduation rate in Table 3 below, that the lower the percentage of applicants admitted, the higher the retention and the higher the graduation rate. That relationship appears to be accurate with the University Park flagship campus but is not consistent elsewhere.
Including the University Park graduation rate of 83%, the average graduation rate is just 28% with a median graduation rate of 26%. The mean transfer rate is 35%, like the median transfer rate of 34%. The lowest transfer rate is 1% at the University Park campus.
One of the stated goals of the plan is to increase the transfer student market for each of its campuses. Based on the median transfer rate of 35%, I would guess that the transfer out market for these institutions is good. I did not choose to utilize National Student Clearinghouse data to determine where these students transfer.
My guess is that it is more important to Penn State to have transfer articulation agreements with community colleges to replace the students from the Commonwealth institutions who are transferring out. I’ll comment about that later when I analyze the governor’s proposal.
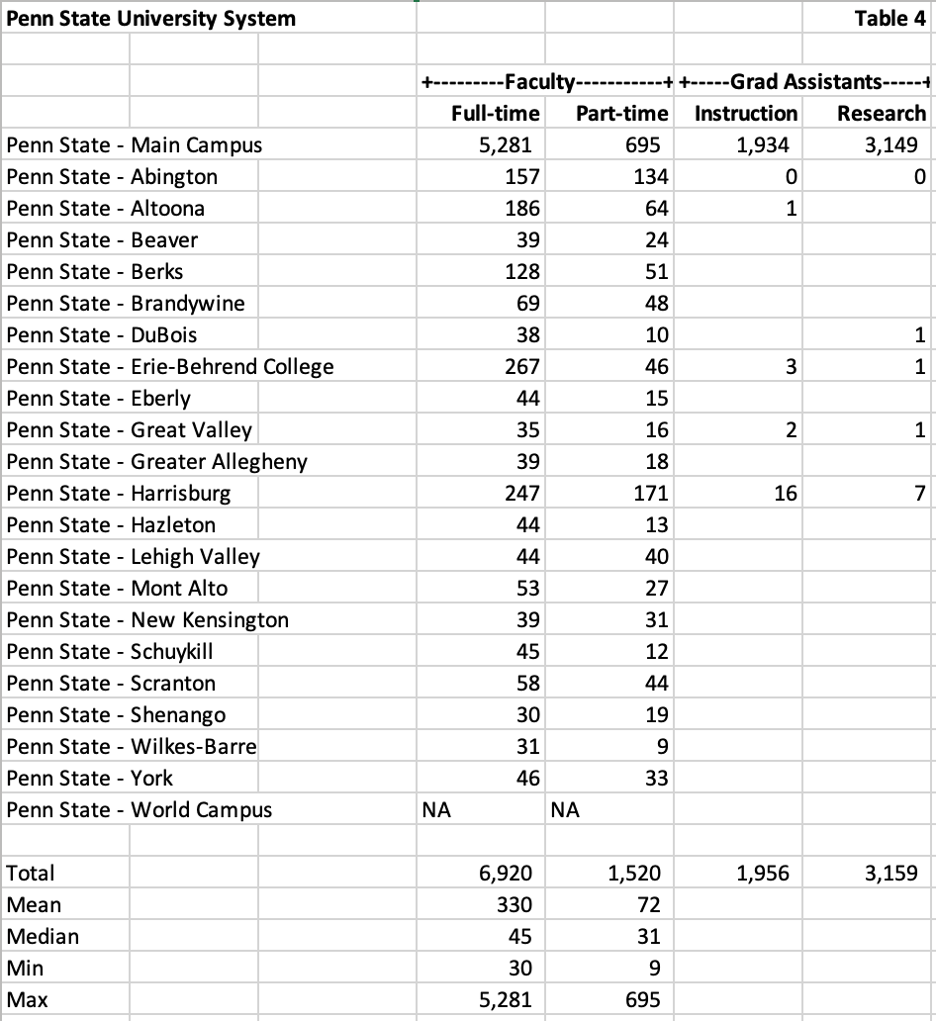
Faculty and Grad Student Distribution
Even though the University Park campus enrolls 57% of all students, its full-time faculty comprise 76% of all full-time faculty as shown in Table 4 below. Its part-time faculty comprise only 46% of all part-time faculty. However, if graduate assistants utilized as instructors are included, the ratio of either category is much higher.
The 3,149 research assistants at the main campus are likely supported by the annual $1.24 billion in research expenditures cited in the report. Given the 1,934 grad assistants assigned to instruction, it’s clear that the teaching load for full-time faculty at University Park is vastly different than the full-time faculty teaching load at other campuses.
It should be noted that Penn State’s World Campus did not disclose the numbers of full-time and part-time faculty members. I am sure this was not an accident. Whether the failure to disclose has to do with issues related to the employment of part-time versus full-tine faculty members would be speculation on my part.
Annual Cost of Attendance
Penn State’s President noted in her report that the state of Pennsylvania had not increased its per student funding for the past four years. Like other state flagships, Penn State’s University Park campus appears to have recruited out-of-state students to add more revenues to cover their costs.
In Table 5 below, you can see the nearly $20k per year difference in total cost of attendance at the main campus. Based on the medians for in-state and out-of-state cost of attendance, that gap drops to less than $10,000 per year. Increasing the percentage of out-of-state students at Commonwealth institutions is one of the goals of the plan. I’m not sure it’s achievable given the tuition cost and location for these colleges.
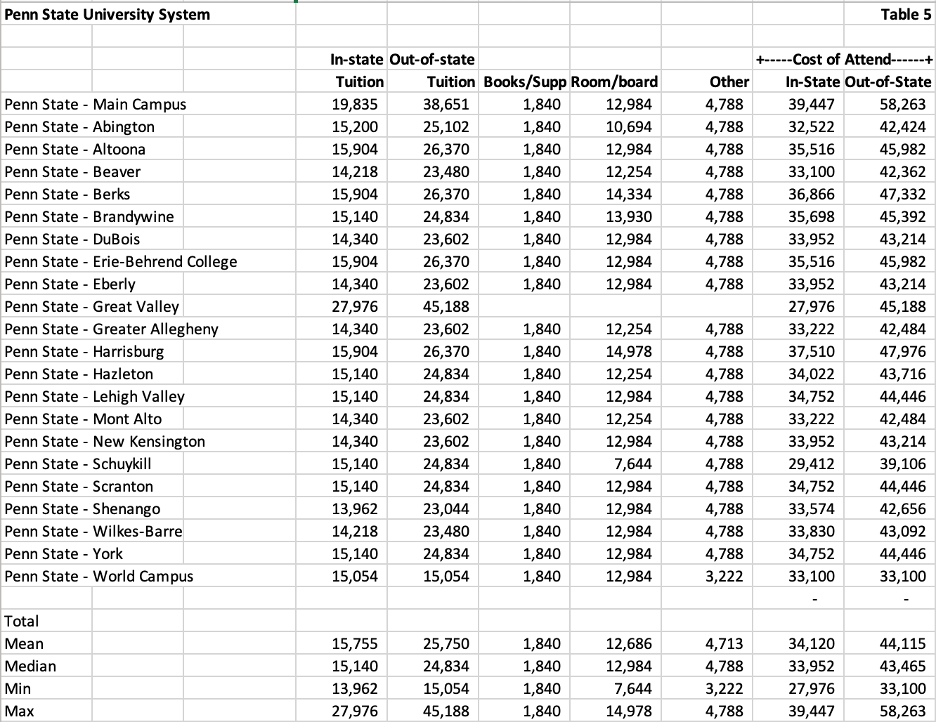
The plan does not mention what the 73,166 undergraduates spend on textbooks nor is there a goal to reduce textbook costs. The NCES reporting for all institutions is the same, $1,840 for textbooks and supplies (except Great Valley which did not disclose any costs). Think of the favorable impact for students if all course materials could be converted to OER.
While there are notable OER sources like OpenStax, I know of at least one Edtech company, BibliU, that attempts to contract for the lowest textbook prices from publishers as well as provides a comparison of textbooks to OER sources from multiple databases. If Penn State is interested in saving students money, they should consider implementing OER.
The highest tuition among the group is at Great Valley which is a graduate only institution. The Main Campus is the next highest tuition for in-state and out-of-state students. For those who are uninformed about the nuances of financial aid, the room and board costs of $12,984 for the World Campus are not actual charges but represent an average that World Campus students can use to determine their financial aid awards.
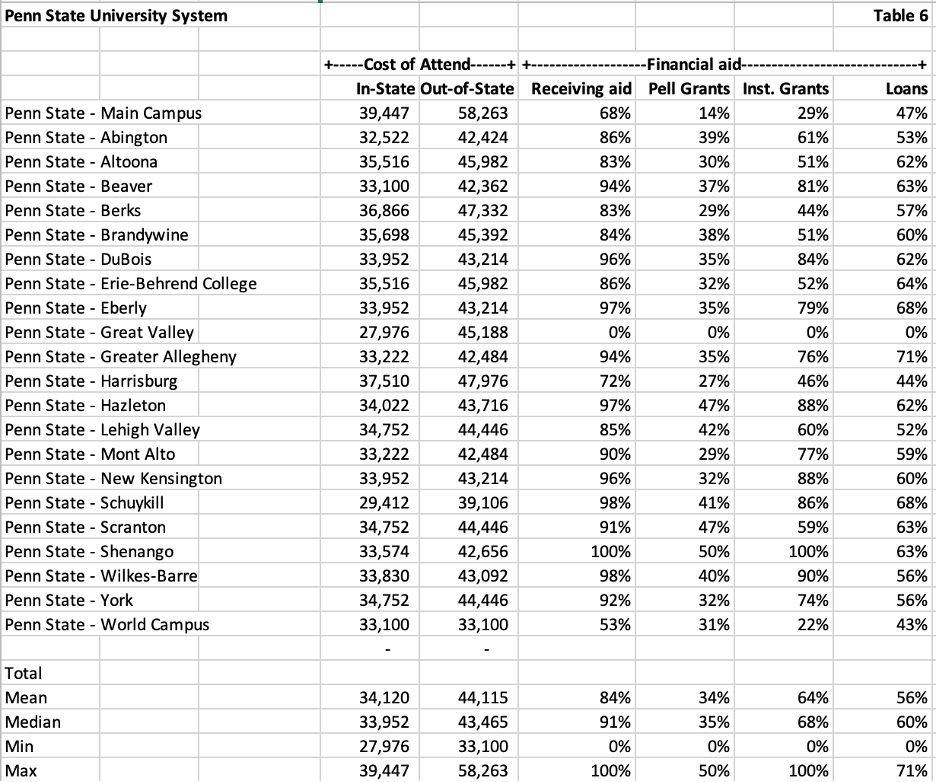
Financial Aid
In Table 6 below, you can see the percentages of students who apply for financial aid, receive Pell grants, institutional grants, and loans. It is not a surprise that the largest percentage of full-pay students attend the flagship campus. The median percentage of students receiving aid is 91%.
The percentage of students receiving Pell grants is lowest at the main campus. This likely correlates to a higher cost of attendance at the main campus as well as a higher net price (see Table 7 below). The median percentage of students borrowing loans is 60% with only a handful of campuses below 50%.
The median percentage of students receiving Pell grants is 35% with a high of 50% at the Shenango campus. Two other campuses have 47% percent of their students receiving Pell grants.
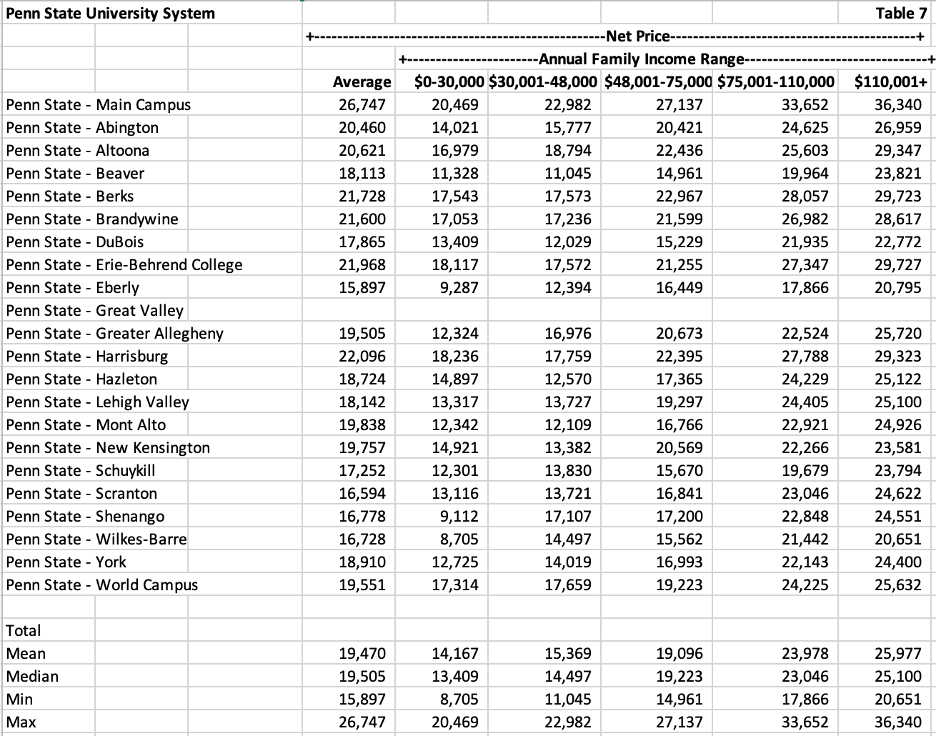
Net Price
In Table 7 below, the average net price as well as average net price per income quintile is displayed for each of the campuses. The main campus has the highest average net price of $26,747. Its net price per family income ranges from $20,469 for the $0-$30,000 bracket to $36,340 for the $110,001 plus bracket. With such a high net price for the lower income quintiles, it’s not a surprise that the percentage of students awarded Pell grants is so low.
The lowest net price is $15,897 at the Eberly campus. Eberly is one of three campuses with a net price less than $10,000 for the $0-$30,000 income quintile. With a median of $13,409 and $14,497 for the two lowest income quintiles, it’s not surprising that the median average net price is $19,505. Four-year colleges are generally not affordable for students qualifying for Pell grants.
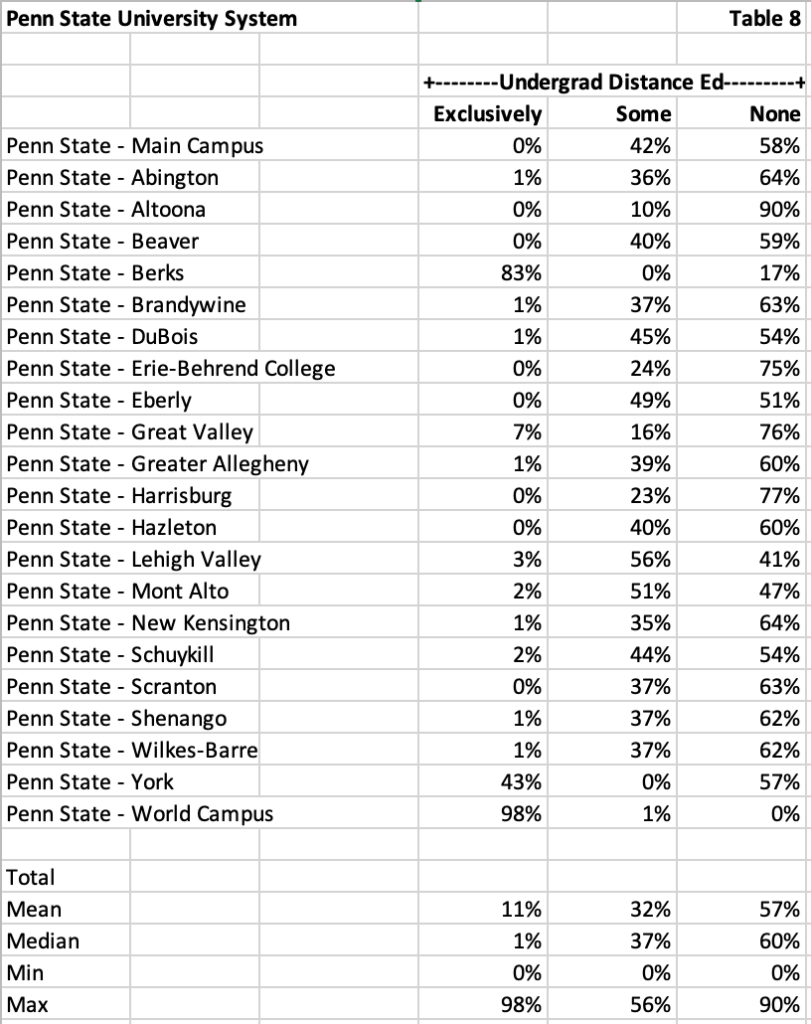
Percentage of Students Online
The report mentioned that Penn State wanted to take advantage of the resources offered at each campus as well as focus on discipline-based hubs of excellence. I decided to collect information on the percentage of students at each institution that were exclusively online, partially online, or only campus-based.
As you can see in Table 8 below, few of these campuses have a large percentage of students who are studying exclusively online. However, the percentage of students who are taking some online courses ranges from 0-56% with a median of 37%. I suspect that this statistic is much higher than it was pre-pandemic.
Oddly, the two campuses other than the World Campus that reported 0% of their students with some online courses (York and Berks) reported 43% and 83% of students studying exclusively through online courses.
The fact that all campuses report students taking some online courses confirms my recommendation in my previous article that many of these institutions should consider online course sharing as an option to achieve the goal of expanding resources that meet community needs.
The Governor’s Blueprint
Step 1 of the governor’s blueprint proposal includes the combination of the PASSHE institutions with the state’s 15 community colleges. I thought I would gather information from College Navigator for these two groups to see how different they were from the Penn State System colleges and if the funding proposals were reasonable.
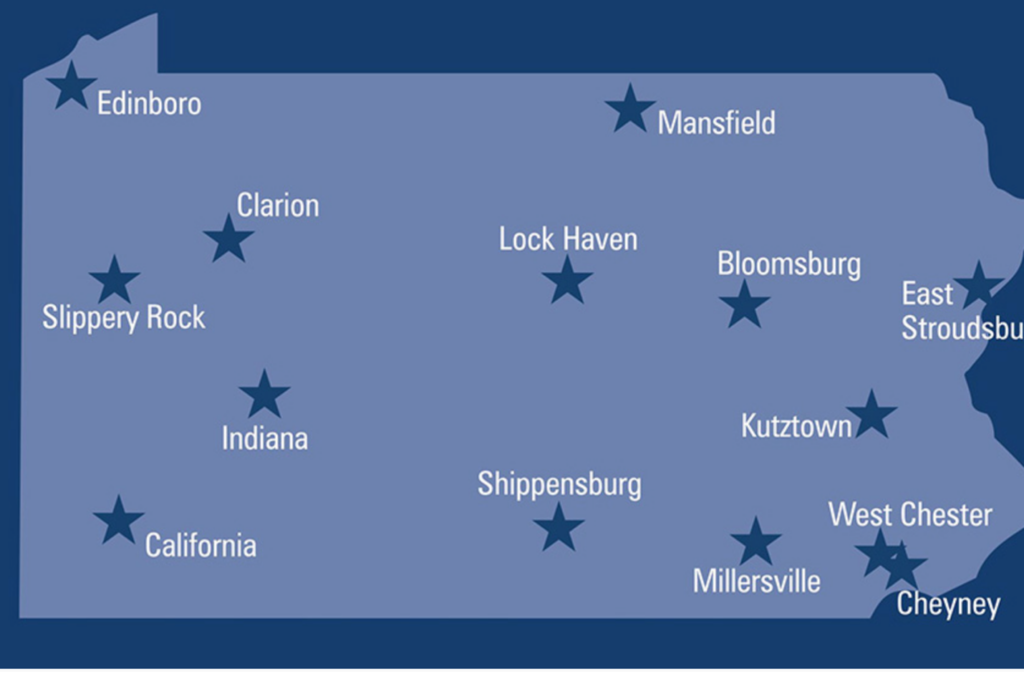
The PASSHE website provides an overview of the location of the PASSHE campuses (see graphic image below). As a reminder, most of these institutions were originally established as normal schools to provide a source for teacher education, primarily in rural areas of the state.
PASSHE Student Enrollments by Campus
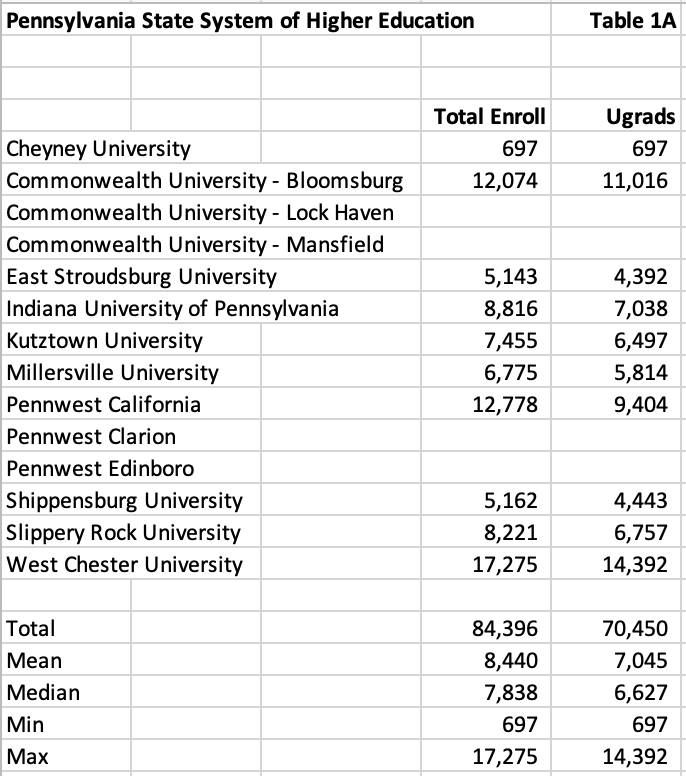
Table 1A below lists the PASSHE institutions and their total and undergraduate enrollments. Note that six of the 14 institutions were combined into two newly branded institutions, Commonwealth University and Pennwest. NCES and College Navigator have combined the data for these institutions under a single name as listed.
The two newly branded institutions are the second and third largest in the PASSHE system due to the combination of three institutions for each. However, West Chester University remains the largest in terms of enrollment (17,275) and Cheyney University remains the smallest (697).
Mean and median enrollments for PASSHE’s 14 institutions is substantially larger than the Commonwealth institutions operated under the Penn State system. Total overall enrollment and undergraduate enrollment is surprisingly similar, although most of the enrollments in the Penn State System are at University Park.
PASSHE In-State Students and Admissions Rate
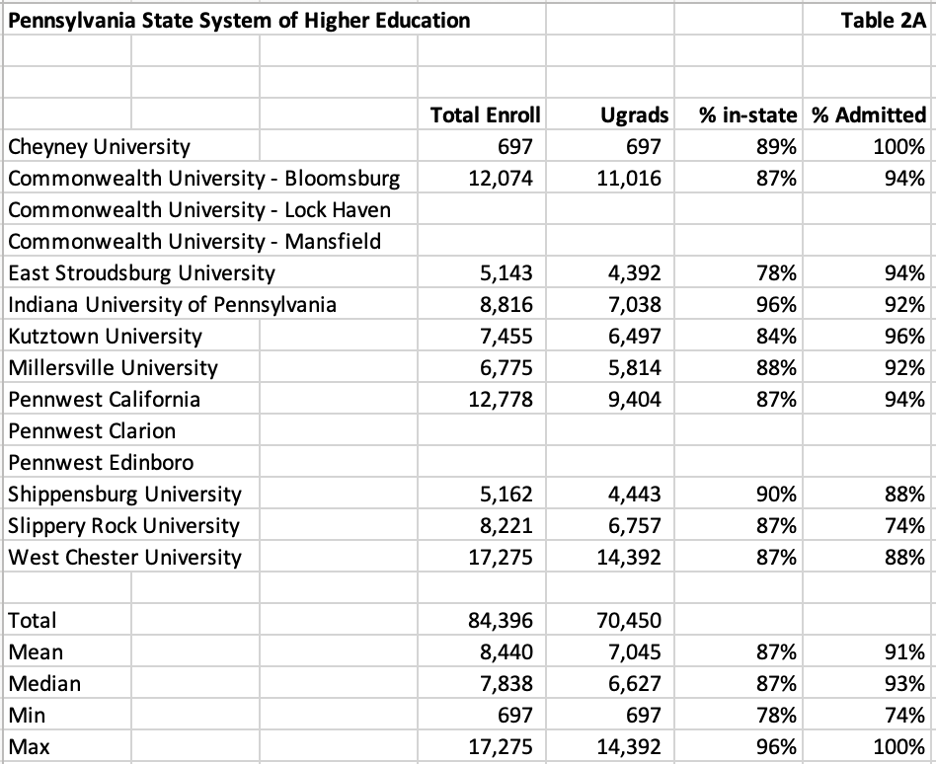
None of the schools in PASSHE are considered selective in admissions (See Table 2A below). The median for the group is 93% admitted and the mean of 91% is weighed down by Slippery Rock’s 74% admission rate. The vast majority (87% mean and median) of students are in-state.
PASSHE Graduation Rates and Transfer Rates
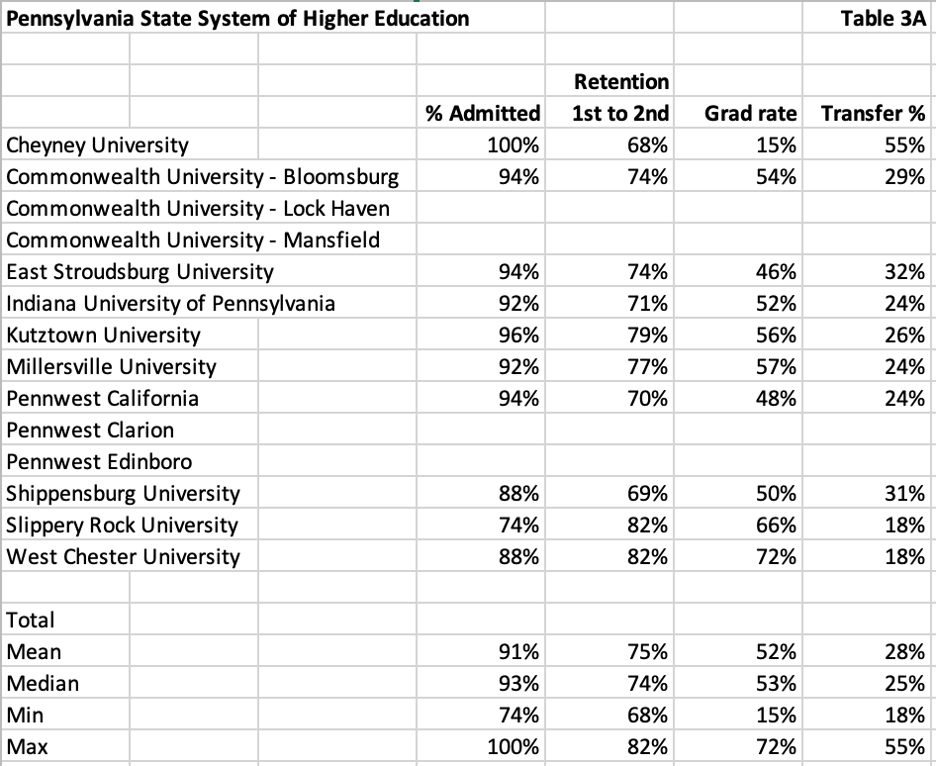
Table 3A below provides a comparison of the retention, grad rates, and transfer rates for the 14 PASSHE institutions. Interestingly, the mean and median graduation rates are higher than the Penn State campuses (52% and 53% versus 28% and 26%). The mean (28%) and median (25%) transfer rates for PASSHE’s institutions are lower than the mean (34%) and median (34%) transfer rates for the Penn State system institutions.
Even though the enrollments at PASSHE institutions have declined over the past decade, I suspect that the higher graduation rates and lower transfer rates reflect the importance of each of these campuses in their areas of the state.
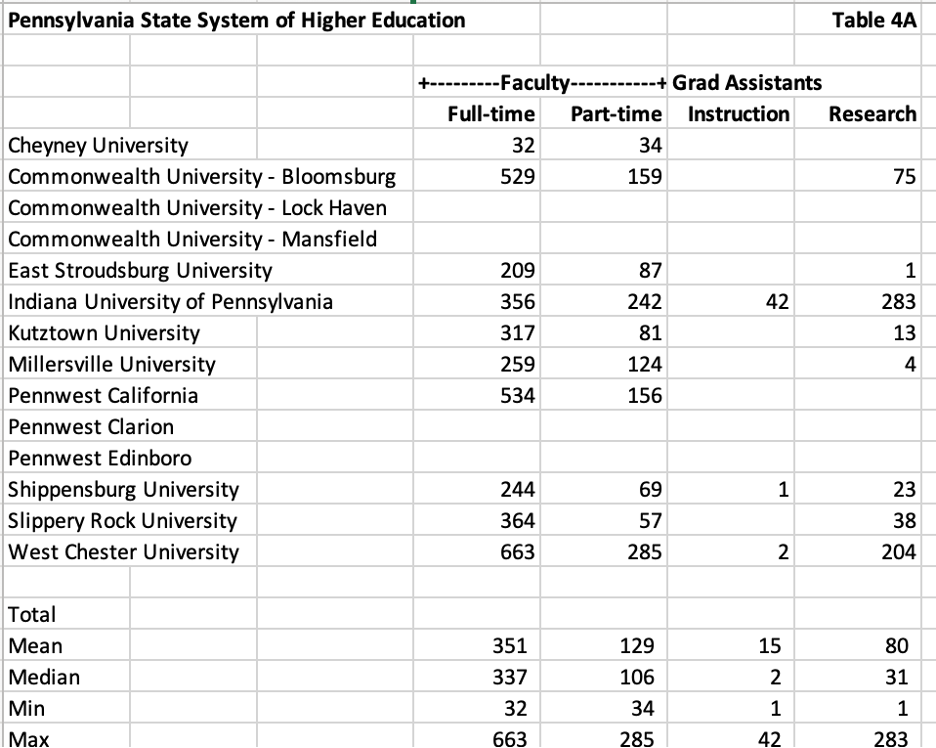
PASSHE Faculty and Grad Assistant Distribution
Table 4A below displays the faculty and grad assistant distribution by institution. The median number of faculty for this group of 14 institutions is much higher than the median number for the Penn State system institutions. Ratios of faculty to students for the newly branded Commonwealth and Pennwest institutions appear to be like West Chester’s.
Indiana University of Pennsylvania had a surprisingly large number of research assistants. I looked deeper into their degree data and found that the number of master’s and doctoral graduates at the institution was nearly half of the number of bachelor’s degree graduates.
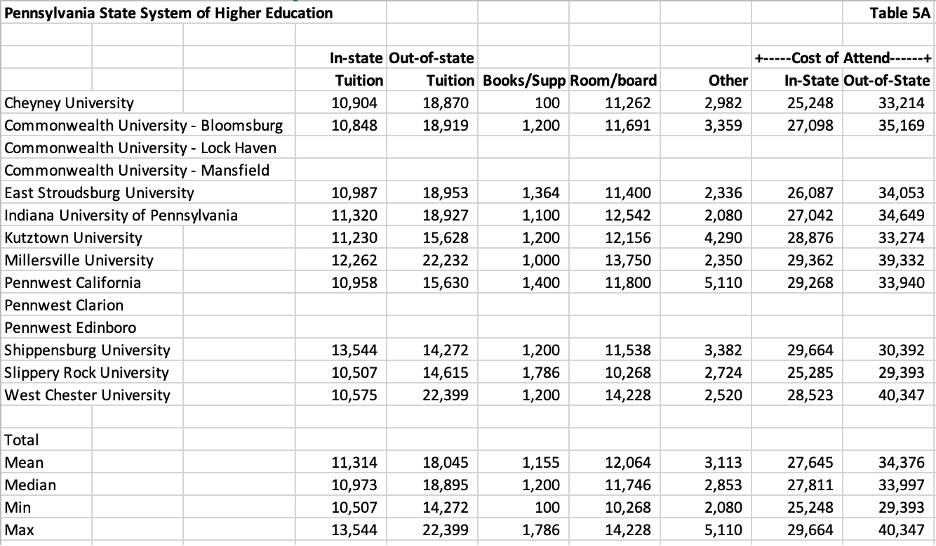
PASSHE Annual Cost of Attendance
Table 5A below provides the individual institution’s cost of attendance and its components. The in-state tuition mean ($11,314) and out-of-state tuition mean ($18,045) for this group are lower than the in-state tuition mean ($15,755) and out-of-state mean ($25,750) for the Penn State System institutions.
Clearly, the Penn State brand resonates for their in-state and out-of-state students and allows them to charge more than the PASSHE institutions. The lower in-state tuition for PASSHE institutions has a benefit for the governor who has proposed lowering the tuition for in-state students attending PASSHE institutions to $1,000 per semester.
The Inside Higher Ed article that covered this mentioned the PASSHE tuition to low- and middle-income students was $7,716 per semester. A Philadelphia Inquirer article presents the $7,716 as an annual number. I cannot derive either of those numbers from the NCES data. Regardless of the exact number, it’s a huge benefit for students to cut tuition to $1,000 per semester as well as a huge cost for the legislature to bear.
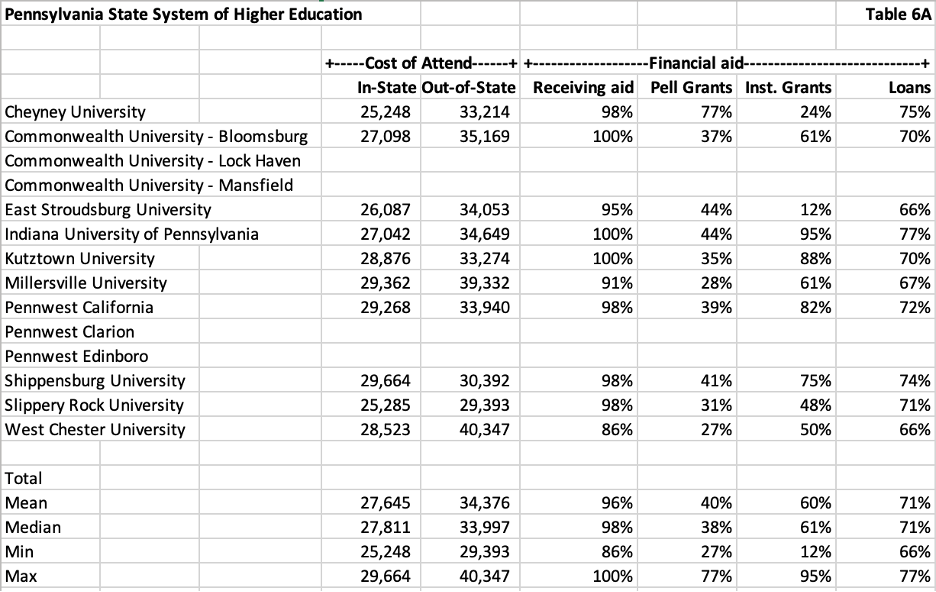
PASSHE Financial Aid
Table 6A below lists the percentages of students who applied for financial aid as well as the areas in which aid was awarded. Unlike the Penn State System where the flagship campus had the lowest percentage of aid applicants as well as Pell grant recipients, the PASSHE institutions appear to be similar.
The percentage of students receiving aid ranges from 86% at West Chester to 100% at IUP and Kutztown. The median percentage of students receiving aid is 98% compared to 91% at the Penn State System campuses.
The median percentage of students receiving Pell grants is 38% vs. 35%. The median percentage of students receiving institutional grants is 61% vs. 68%. The median percentage of students receiving loans is 71% vs. 60%. Across the board, the mix of Penn State students are slightly wealthier than the PASSHE students.
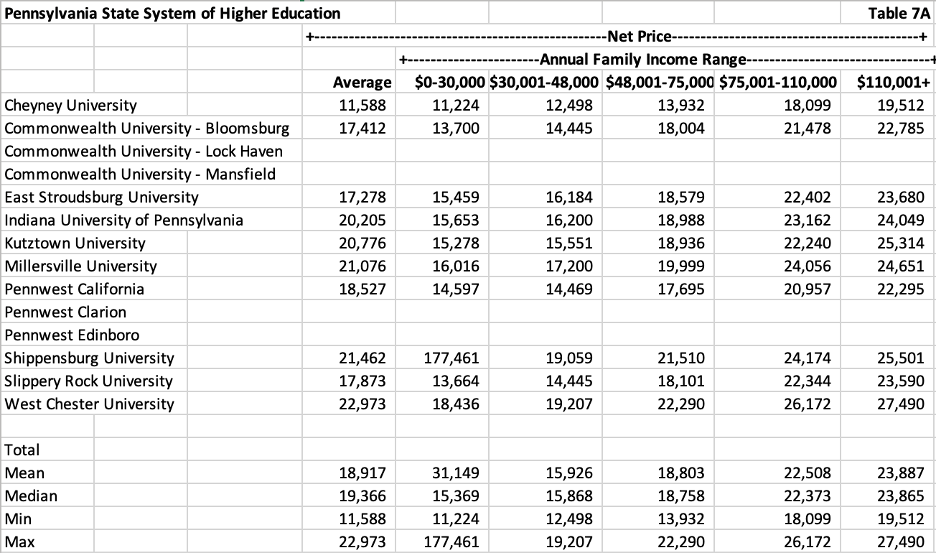
PASSHE Net Price
Table 7A below provides the average net price and net price for each of the five family income quintiles as designated by the Department of Education for the PASSHE institutions.
This past summer, I wrote several articles about the differences in average net price and average net price per income quintile for five major groups of higher education institutions. Later, I wrote a summary of those articles. My biggest finding was that the Ivy Plus institutions (aka the wealthiest) subsidized net price more for the three lowest family income quintiles than any other group. The group with the next lowest subsidy was community colleges.
In that analysis, I looked at flagship public institutions as a group. I did not look at other public universities nor did I conduct a state-by-state analysis. The average net price for the PASSHE institutions is $19,366 which is not too different than the $19,505 average net price for the Penn State System institutions.
Surprisingly, the median net price for the $0-$30,000 quintile and the $30,001-$48,000 quintile is $15,369 and $15,868 for the PASSHE institutions and $13,409 and $14,497 for the Penn State System institutions. It’s nearly a $2,000 difference for the lowest income quintile and $1,300 for the next lowest income quintile.
The difference is surprising because the median percentage for Pell grants is 38% for PASSHE institutions and 35% for Penn State System institutions. For the last three income quintiles, the Penn State System median net prices are higher at $19,223 (vs. $18,758), $23,046 (vs. $22,373), and $25,100 (vs. $23,865).
I pointed out that no group of colleges reduces the net price for the lowest income quintiles close to $0 other than the Ivy Plus institutions which have very large endowments, a high cost of attendance, and a high percentage of full-pay students. If the governor’s blueprint is approved, the PASSHE institutions may prove to be an exception.
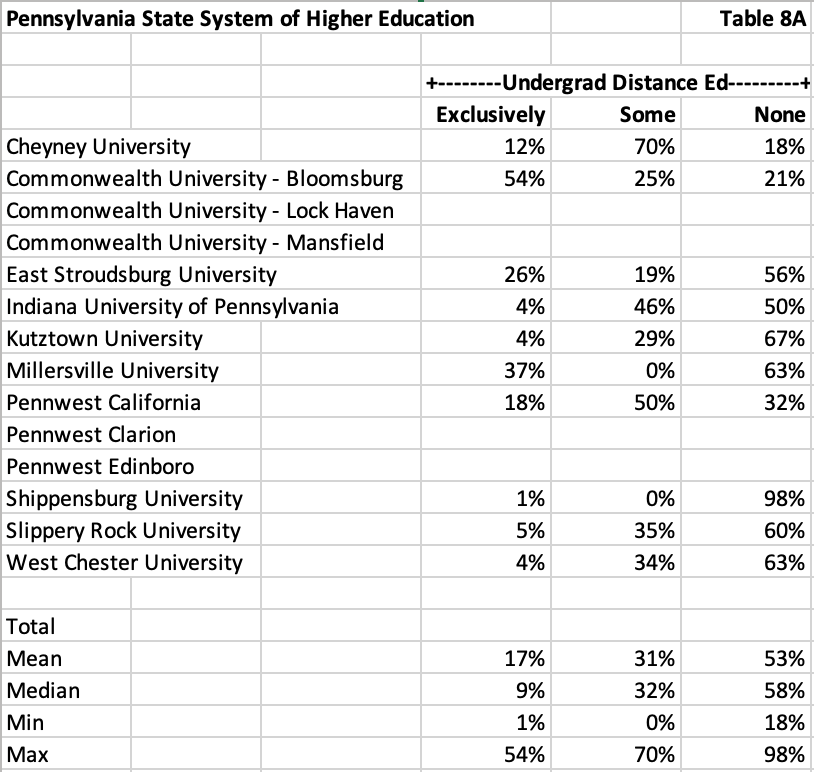
PASSHE Percentage of Students Online
Table 8A below provides an overview of the ways in which students embrace online courses at the PASSHE institutions. The exclusively online category ranges from a low of 1% at Shippensburg to a high of 54% at the Commonwealth institutions. Some online ranges from a low of 0% at Shippensburg to a high of 70% at Cheyney. No online ranges from a low of 18% at Cheyney to a high of 98% at Shippensburg.
The median percentages of each of these three categories are fairly similar to the Penn State System campuses. The Penn State median for Exclusively (1%) compares to the PASSHE median for Exclusively of 9%. The Penn State median for Some of 37% compares to the PASSHE median for Some of 32%. Lastly, the Penn State median for None of 57% compares to the PASSHE median for None of 58%.
As a group, the PASSHE institutions have a higher median enrollment than the Penn State System institutions. I think they might be more able to share online courses and programs than the Penn State System institutions. A potential problem with Penn State System institutions sharing online courses and programs could be the large enrollment of Penn State World campus that may be heavily governed by Penn State’s Main Campus.
Community Colleges
The Governor’s Blueprint intends to combine the PASSHE institutions with the 15 community colleges that are not affiliated with Penn State, the University of Pittsburgh, Temple University, or Lincoln University. There are 15 institutions listed in his proposal and on the state’s Department of Education website.
PA Community College Enrollments
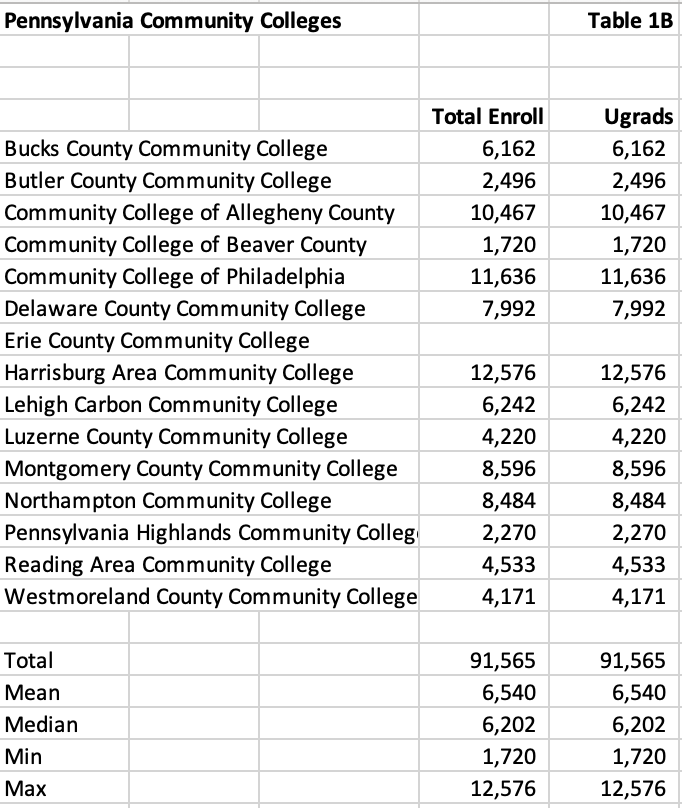
Table 1B below outlines the enrollments by institution. Erie County Community College is listed as one of the 15 by multiple sources. Data is unavailable from NCES likely because the institution is so new. Data from its website indicates its enrollment is approximately 450 students. No data is included for purposes of this analysis.
Excluding Erie CCC, enrollment ranges from 1,720 at CC of Beaver County to 12,576 at Harrisburg Area Community College. The median enrollment is 6,202. This compares to a median of 6,627 undergraduates at PASSHE institutions and a median enrollment of 694 undergraduates at Penn State System institutions.
Total enrollment at Pennsylvania’s community colleges exceeds total enrollments at the Penn State System as well as at the PASSHE institutions. All of the 91,565 students are undergraduates.
PA CC In-State Students and Admissions Rate
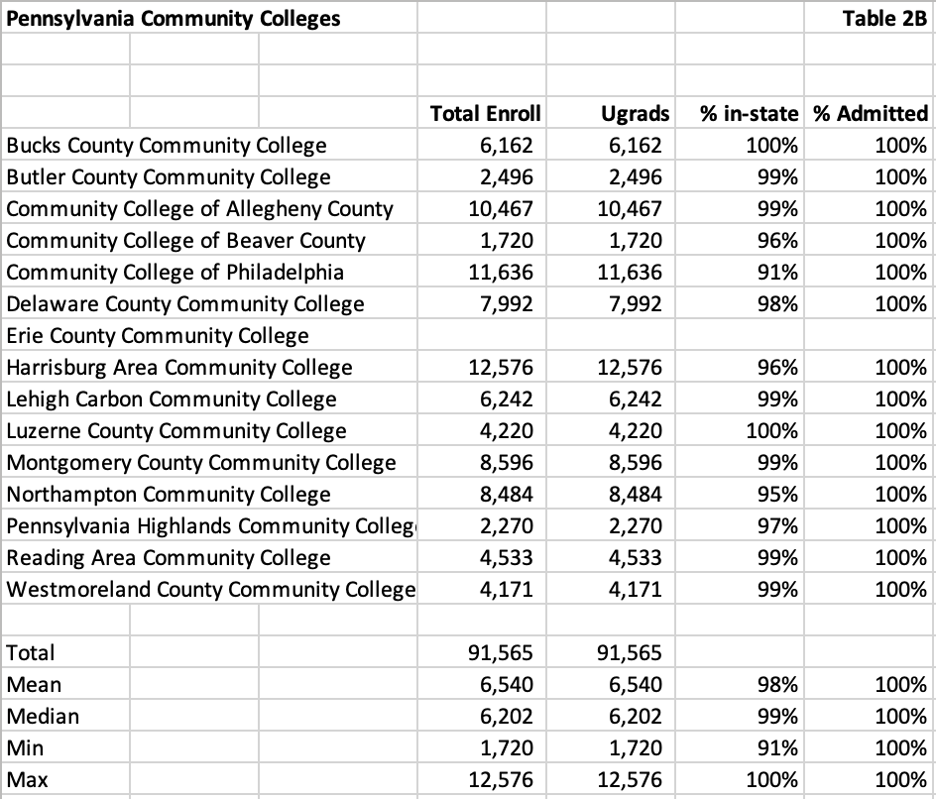
Table 2B below illustrates the open enrollment policies at all community colleges (100% admitted) as well as the high percentage of in-state students (median of 99%).
PA CC Graduation Rates and Transfer Rates
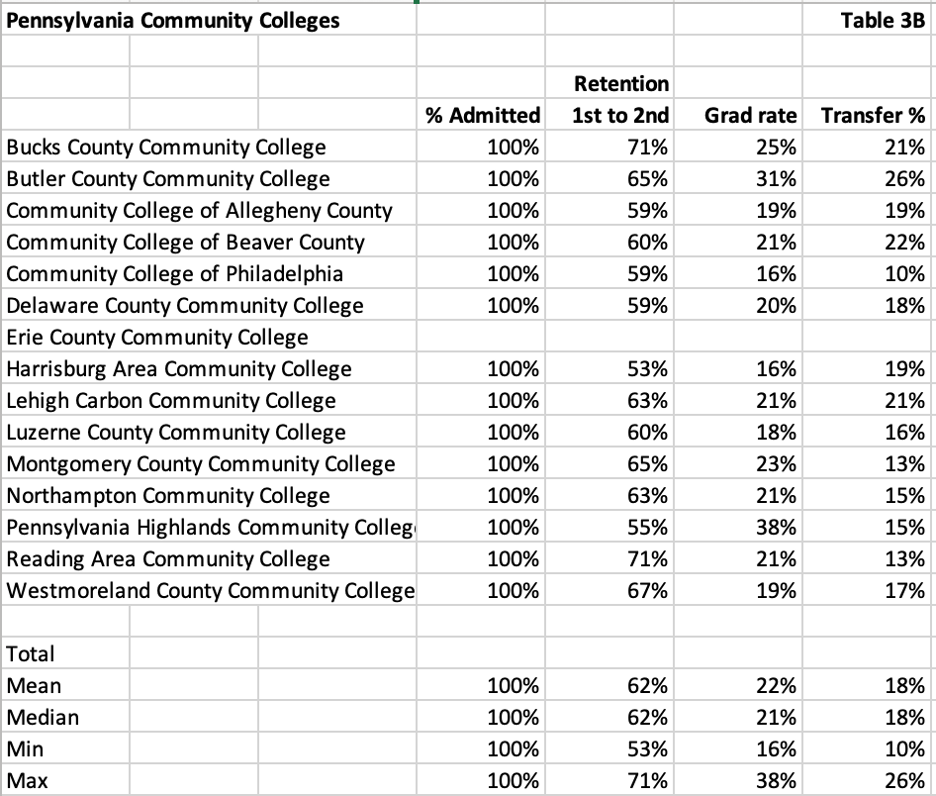
The data in Table 3B below is somewhat surprising. More than 50% of Pennsylvania’s community college students are retained from year one to year two (median is 62%). However, the median graduation rate is 21% and the median transfer rate is 18%. The two (grad rate and transfer rate) are especially inter-related for community colleges.
These grad rates and transfer rates compare to a median of 26% and 34% for Penn State System institutions and a median of 53% and 25% for PASSHE institutions. As noted previously, the PASSHE institutions have the best combined rates.
Based on the relatively high transfer rate for the Penn State System institutions (except the Main Campus), the small size of many of those Commonwealth campuses may serve as a motivation for many to transfer to a four-year college.
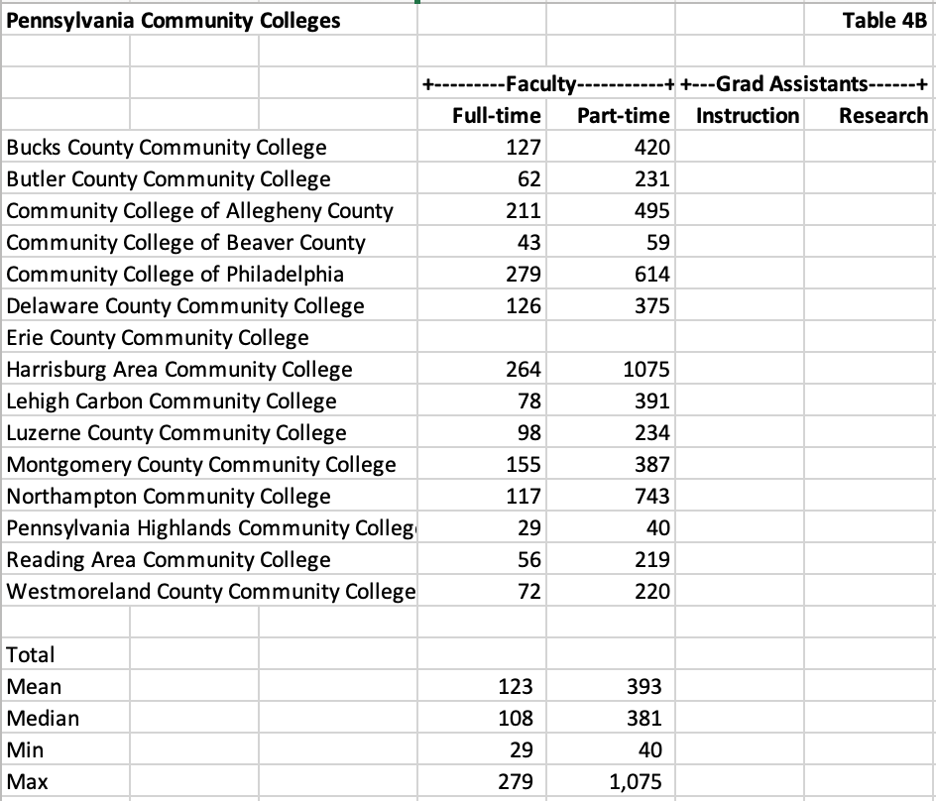
PA CC Faculty and Grad Assistant Distribution
Table 4B below provides a breakout of the faculty distribution for the community colleges. It should be noted that there is a much higher percentage of part-time faculty than full-time faculty for this group than the Penn State System and the PASSHE institutions. There is nearly a 4:1 ratio of median part-time faculty to median full-time faculty.
This is not a surprising finding given the percentage of part-time and working adult students that attend community colleges. The median of 108 full-time faculty compares to the PASSHE median of full-time faculty of 337. Given the vastly different median enrollment compared to the Penn State System institutions, the comparison is not relevant.
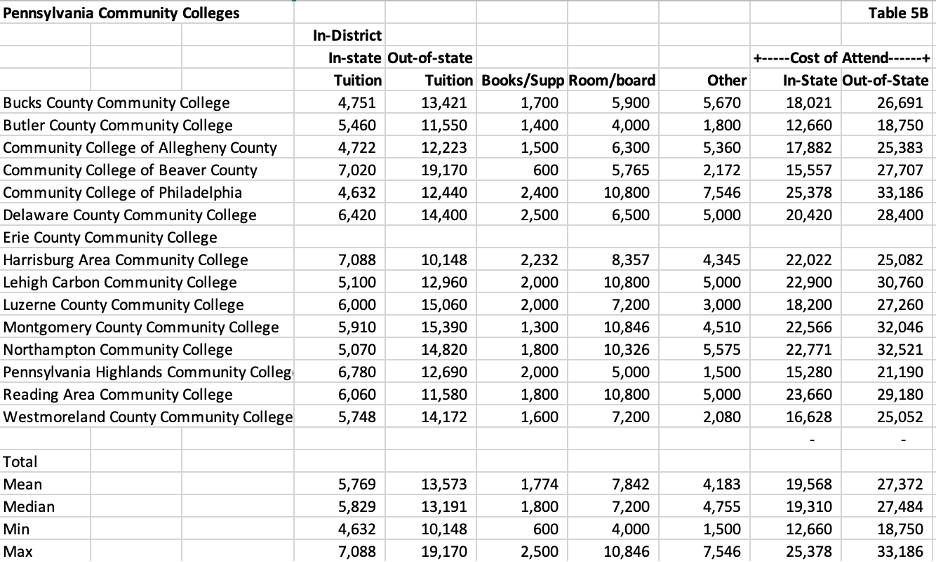
PA CC Annual Cost of Attendance
Table 5B below reflects the various components of cost of attendance for in-state and out-of-state students at Pennsylvania Community Colleges. As previously identified, there are not many out-of-state students attending PA community colleges. It should also be noted that there are three overall categories for tuition – in district, in-state, and out-of-state. In-district tuition was used in this table.
The in-district median tuition of $5,829 compares favorably to the median in-state tuition of $10,973 for PASSHE institutions and $15,140 for Penn State System institutions. Room and board and other expenses are generally estimates for this group of institutions that usually do not offer dorms. Students able to attend while living at home will not have the computed cost of attendance.
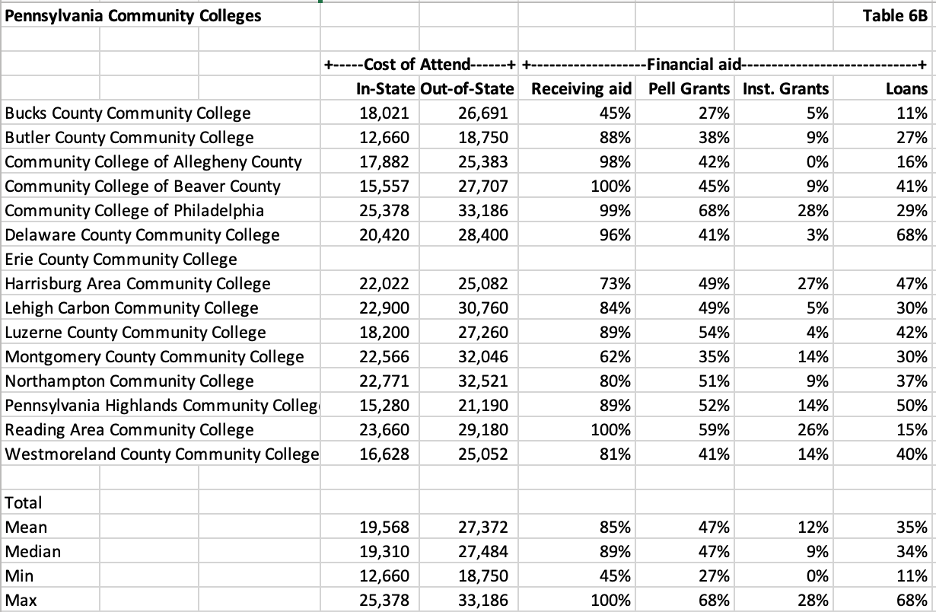
PA CC Financial Aid
Table 6B below reflects the overall percentage of students who request financial aid as well as the percentages of students who receive various components of financial aid awarded. The median percentage of students receiving aid is 89% but varies from a low of 45% at Buck County CC to a high of 100% at CC of Beaver County.
The median percentage of Pell grants awarded is 47% and varies from 27% at Bucks County CC to 68% at the CC of Philadelphia. The Pell grant median percentage is approximately 10% higher than the median for PASSHE students and Penn State System students. The median loan percentage is much lower for PA CC students and is likely directly correlated to the lower tuition and cost of attendance.
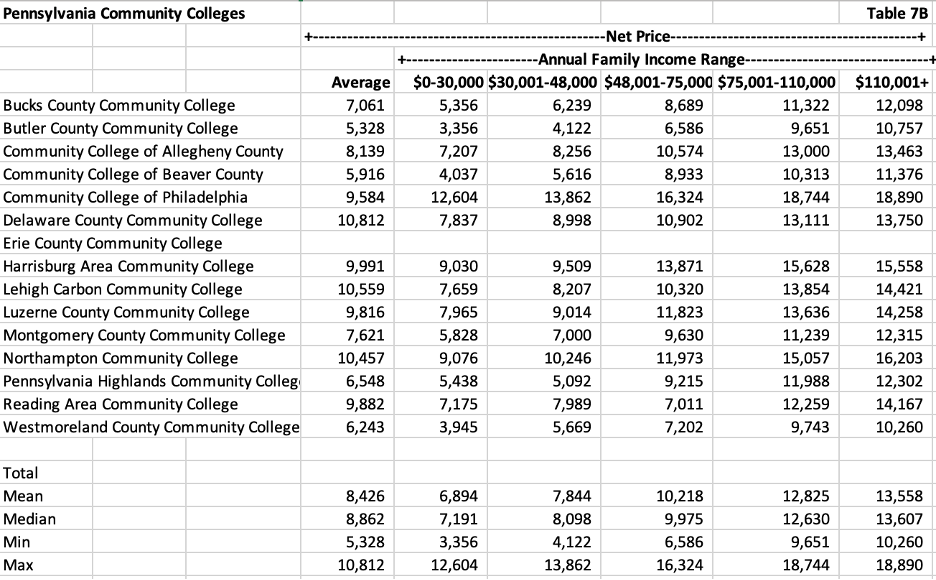
PA CC Net Price
Table 7B below reflects the average net price for each of the PA community colleges as well as the average net price for each of the quintiles related to family income. The median average net price is $8,862 and compares to a median average net price of $19,366 for PASSHE institutions and $19,505 for Penn State System institutions.
The median net price for the lowest income quintile of $0-$30,000 is $7,191 and ranges from $3,356 (Butler CCC) to $12,604 (CC of Philadelphia). The median net price for the same quintile is $15,369 for PASSHE institutions and $13,409 for Penn State System institutions.
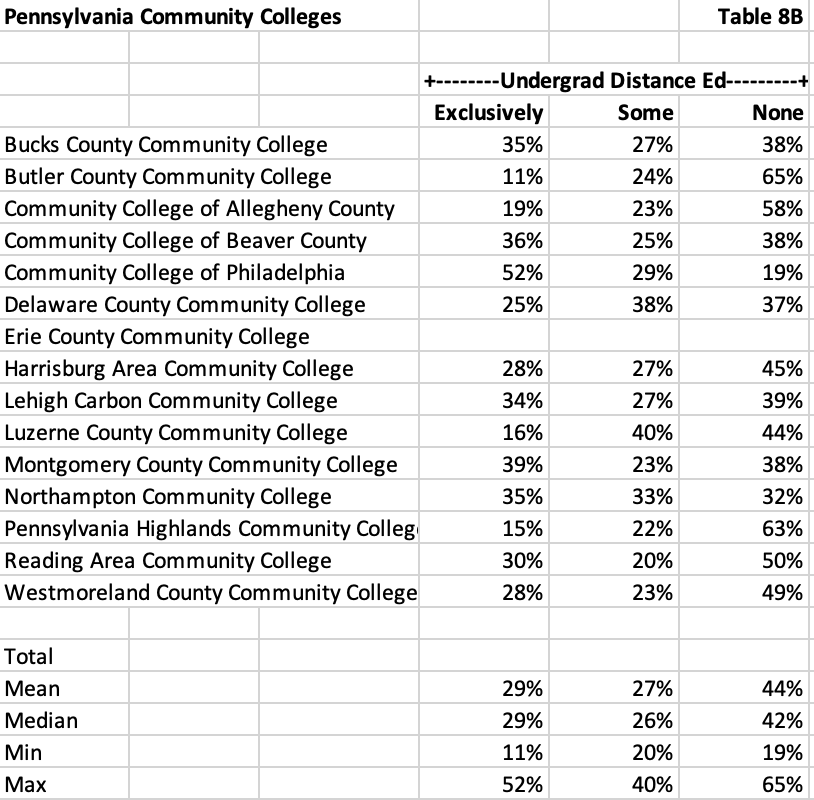
PA CC Percentage of Students Online
Table 8B below provides the percentages of PA CC students that exclusively attend classes online, attend some online classes, or do not attend any online classes. The median percentages for each of these three categories are evenly distributed. This is likely due to the percentages of part-time and working adult students.
These percentages bode well for the potential of the PA CCs to share courses, whether among each other or with high schools that are participating in dual enrollment programs. A course sharing consortium among state schools could result in savings that could be used to fund other components of the plan.
Final Thoughts
Call me a skeptic but I doubt that Penn State will eliminate the excess expenses that are needed to head off their projected deficit. I also doubt that the Governor will succeed with his plan to combine the PASSHE institutions with the state’s community colleges.
My analysis looked at many institutions, but not all. If the governor was truly bold, he would have included all public institutions in parts of his proposals.
It is clear to me that Pennsylvania has too many public institutions. There are overlaps in almost every city and county. Now is the time to eliminate or consolidate small enrollment colleges and to utilize modalities like online and technologies like course sharing and OER to eliminate redundant expenses. In the Philadelphia Inquirer article mentioned above, retired U of Penn professor Joni Finney mentioned that the Penn State Commonwealth campuses may be a cause of enrollment declines at the PASSHE institutions.
Roadblocks to streamlining operations include politics and unions. Meanwhile, the only certainty is that higher education continues to be too costly for our lower income students. Its relevancy and appeal to people who want to enhance their earnings through learning is waning as well. Time will tell whether Pennsylvania will break out of the mold and transform their public higher education institutions or watch as most of their institutions continue to struggle with declining demographics and affordability and relevance issues.


