
[Note: This article follows the format from two previous articles commenting on Daniel Greenstein’s analysis of private colleges across the U.S. and my review utilizing data from 15 private colleges and universities in Maryland and 24 private colleges in Virginia. For this article, I added data from 30 private colleges and universities in Florida, a state with lower risk from the Demographic cliff (of high school grads), to see if the profiles of their state’s private colleges were similar.]
Small private colleges have been the subject of many articles predicting their risks of closing. Whether it’s low enrollments, tuition discounting, or their fixed cost structures, the causes of financial decline are similar. In December 2023, I wrote an article summarizing some of the more recent publications forecasting these looming disasters.
Since then, I’ve generally focused my writing on small colleges and the percentage of students receiving tuition discounts. Tuition discounts are offsets to tuition revenues as well as to cash received from tuition revenues. In a highly competitive market where enrollments are declining and fixed costs are difficult to cut quickly, tuition discounting’s impact on cash collections needed to cover expenses is severe.
The Fragility of Small Scale
In October, Daniel Greenstein (Chancellor Emeritus of PASSHE) published Part 1 of a three-part series about the financial status of public and private institutions. Titled The Fragility of Small Scale, Mr. Greenstein used an “analytical engine” to look at data from 2010-2023 to evaluate the financial trajectory of an institution.
One sentence in the introductory paragraph could have been the lead line, stating that “below about 2,500 students, fragility becomes structural.” Mr. Greenstein wrote that 70-75% of the private colleges whose enrollments are below 2,500 fall into the highest risk category; between 2,500 and 5,000, the risk falls to 60%; at 10,000-20,000, the risk falls to 30%; and above 50,000, it falls to less than 15%.
Greenstein stated that small colleges don’t fail because they’re poorly managed. He blamed most failures on “unforgiving economics.” He further wrote that “the fixed costs of accreditation, compliance, technology, student services, and marketing vary only marginally with small size.” The smaller the student enrollment that these costs are spread across, the more any financial issues can have catastrophic consequences.
I was unsure about the enrollment breakouts for Mr. Greenstein’s risk analysis which is why I looked at Maryland and then, Virginia. Not satisfied with looking at data from those adjoining states, I looked at 30 private colleges and universities with undergraduate students that comprise the membership of the Independent Colleges and Universities of Florida (ICUF). I selected ICUF’s members because Florida is a state that is not expected to experience the demographic cliff of U.S. high school graduates. I added Full Sail University, a private, for-profit university that is not a member of ICUF.
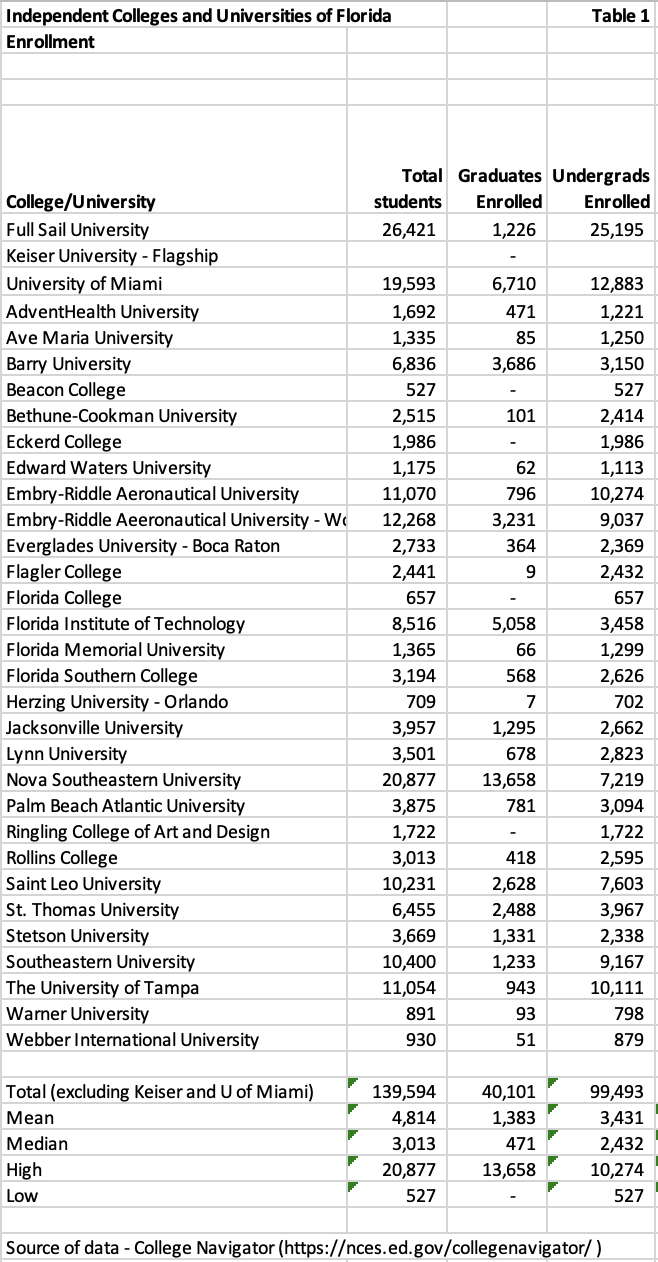
I listed the institutions and their total enrollment and undergraduate enrollment in Table 1 below. As you can see, 18 of Florida’s 31 private colleges and universities have enrollments that exceed 2,500 (note: it is likely 19, but Keiser University does not disclose enrollment information in College Navigator). Embry-Riddle Aeronautical University is listed as two separate institutions (because its Worldwide campus primarily enrolls its students online) that in the aggregate total more than 23,000 students. Nova Southeastern University has a total enrollment exceeding 20,000 students (4% of its undergrads attend online only, and 37% of its grad students attend online). The University of Miami is the next largest with just under 20,000 total students. After the University of Miami, the next highest enrollment belongs to St. Leo University with 10,231 students.
Five colleges have total enrollments under 1,000, with the lowest, Beacon College, having only 527 undergraduate students. I excluded Full Sail University, the University of Miami, and Kaiser University from calculations involving the mean, median, high, and low for the group.
Full Sail University was excluded due to its large enrollments that are primarily online. Kaiser was excluded due to its multiple campuses with no College Navigator-disclosed enrollments. The University of Miami was excluded due to its large endowment and high selectivity, which will be discussed later.
Excluding those three universities, the mean total enrollment for the remaining 28 colleges and universities is 4,814, and the median total enrollment is 3,013. The high is Nova Southeastern University at 20,877, and the low is Beacon at 527 students.
Liquidity
According to Mr. Greenstein, more than 60% of the sub-2,500 group of colleges and universities operate with less than a year of unrestricted net assets. This compares to two to three years for mid-sized institutions and five years or more for large research universities. Less than half of Florida’s private colleges and universities fall into this risk profile.
When a small private institution has a bad year of new student admissions, the downturn can set off a credit downgrade, pressure on debt-service, a draw on reserves, further tuition discounting to attract undecided and/or last-minute applicants, as well as further downturns.
Tuition Dependence and Price Compression
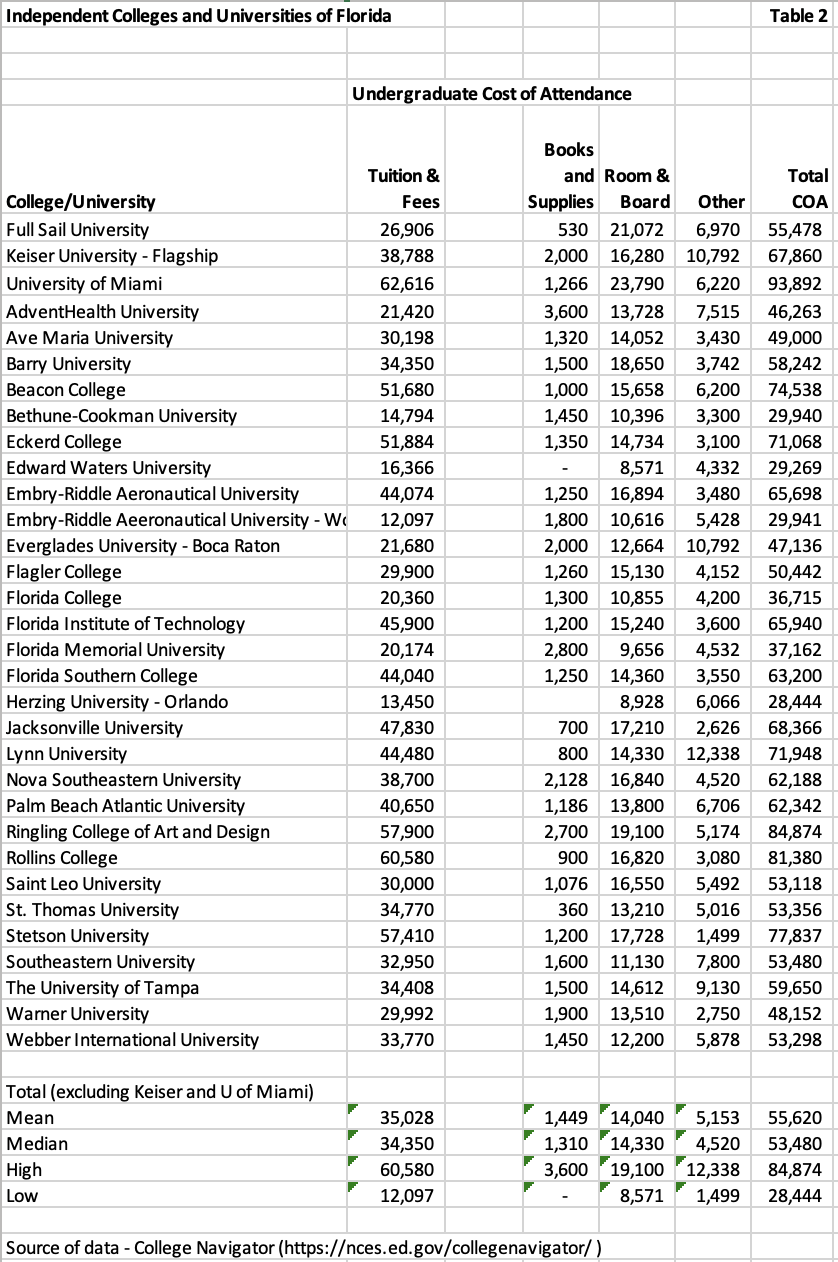
When 85-95 percent of your revenues are driven from tuition and fees, you expose yourself to even greater financial risks in a market with declining enrollments. I created two more tables for the 31 colleges and universities. Table 2 illustrates the Total Cost of Attendance (COA) for each of these institutions as well as the Mean, Median, High, and Low for the 28 institutions other than Full Sail, University of Miami, and Kaiser. The mean ($35,028) and median ($34,350) tuition are similar, although the group of 28 ranges from a low of $12,097 at Embry-Riddle Aeronautical University – Worldwide (94% online students) to a high of $60,580 at Rollins College. The mean ($55,620) and median ($53,480) Cost of Attendance follow that pattern, except the low COA ($28,444) is at Herzing University, whose students attend both online and in-person.
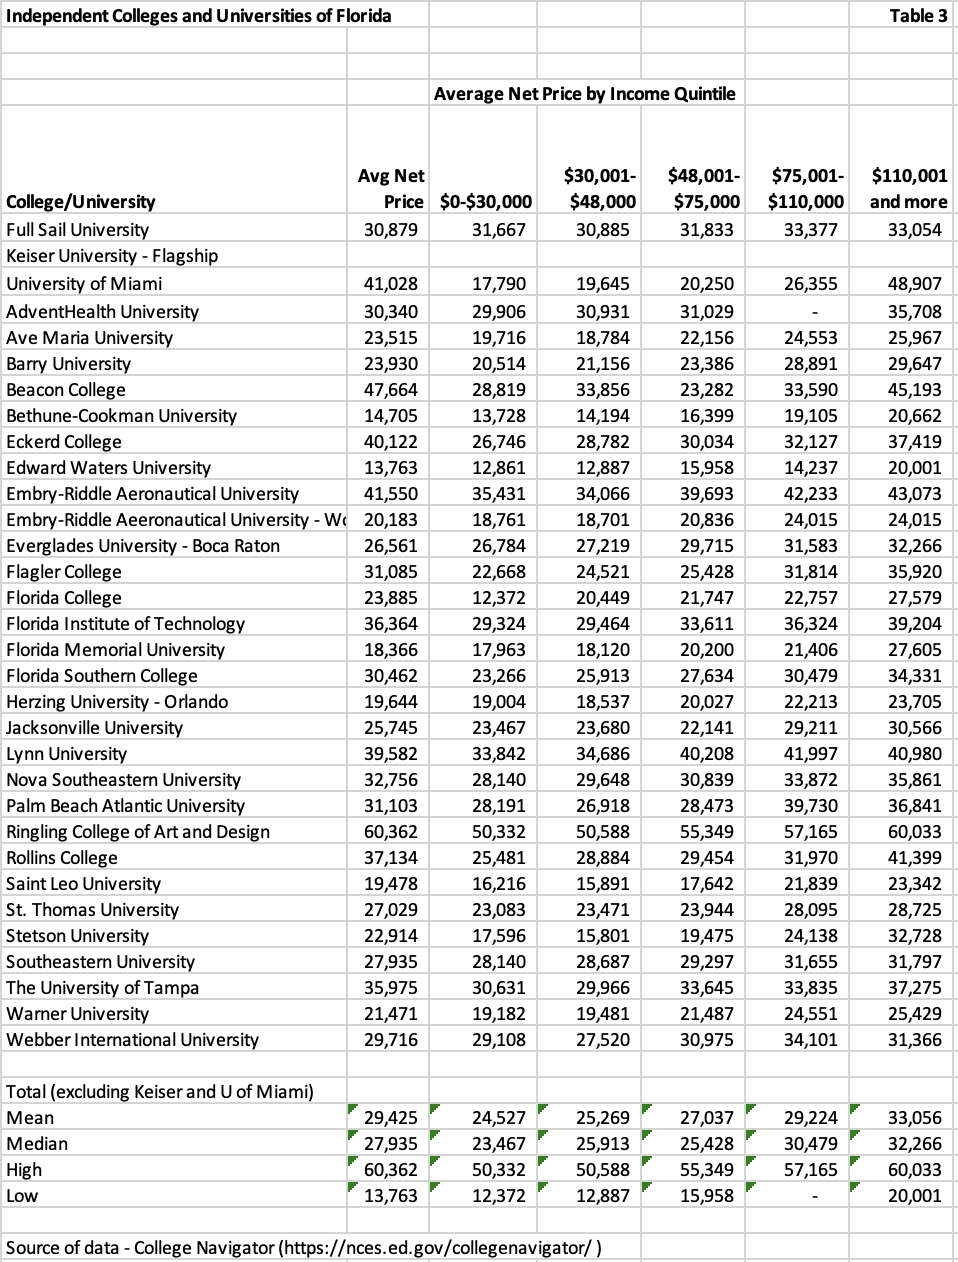
No analysis of the costs of private colleges is complete without looking at net price, which is the Total COA minus all grants. Table 3 below illustrates these numbers for the group. The mean ($29,425) and median ($27,935) average net prices are close (note, these numbers are higher than the same numbers for Maryland’s and Virginia’s private colleges). The institutions, however, range from a low of $13,763 (Edward Waters University) to a high of $60,362 (Ringling College of Art and Design).
Because I received Pell Grants during college, I like to review the average net price in the lowest income quintiles. Unlike Maryland and Virginia where Johns Hopkins (net price of $1,473 for students whose families’ incomes are in the lowest $0-30,000 income quintile) and Washington & Lee (net price of $76 for students whose families’ incomes are in the lowest $0-30,000 income quintile) charge far less than the mean ($24,527) and median ($23,467) in their groups, the lowest net price for that income quintile in Florida is Florida College at $12,372.
When the overall average net prices are multiplied times the number of undergraduate students enrolled, the product represents 85-95% of total revenues for institutions without large endowment income or graduate students.
Enrollment and Market Reach
Small private colleges and universities recruit regionally, not nationally, writes Mr. Greenstein. Proximity matters. The number of high school graduates in the Mid-Atlantic area is not shrinking as much as it is in New England, but it’s not growing like it is in Southern states like Florida. From 2010 to 2023, institutions with fewer than 2,500 students lost an average of 15% of enrollment, whereas the largest institutions grew enrollments. Larger institutions can leverage scale in marketing and recruiting, a benefit that smaller institutions often struggle to achieve. As mentioned earlier, more than half of Florida’s private colleges and universities have more than 2,500 students, a rosier situation than Maryland and Virginia.
Program Structure
Small colleges either have too narrow of an academic portfolio or too diffuse of an academic portfolio, notes Mr. Greenstein. College Navigator, the source of my data for these tables, has a section for each college/university titled Programs/Majors. Two examples illustrate his point.
Beacon College, the smallest in terms of undergraduate enrollment, had 116 graduates majoring in 8 unique degree programs. With approximately 552 graduates, Flagler College offers 38 different program categories, as listed in the most recent year. A narrow focus can restrict the number of students interested in your college. Too diffuse of a portfolio may generate instructional cost inefficiencies.
What Scale Buys
When enrollments reach or exceed 10,000 students, a shift occurs, according to Mr. Greenstein’s analysis. Operating margins are positive. Tuition dependency is less than 60%. Endowment balances per FTE student increase, and external funding increases.
The efficiencies from scale allow institutions to buy the following:
- Revenue diversification among graduate programs, auxiliaries, philanthropy, and research
- Fixed cost overhead spread across more students
- Market elasticity – national reach offsets regional/local decline
- Brand leverage – selectivity sustains price integrity
The Leadership Paradox
There are a few small enrollment institutions that are not at risk, according to Mr. Greenstein. These are wealthy liberal arts colleges with large endowments and loyal alumni.
Most presidents of small private colleges face the following challenges:
- Raise price and risk yield
- Cut price and erode margin
- Diversify and dilute mission
- Consolidate and lose identity
The math doesn’t work well without scale. Collaborations offer some relief, but most colleges lack the flexibility to initiate those partnerships within a reasonable amount of time. Waiting deepens the financial decline, and few partnership opportunities are available to financially distressed institutions.
The Price of Admission
Daniel Greenfield followed up his research piece about scale with an article about admissions selectivity in private colleges and universities. He opened with the statement “across nearly 1,000 private institutions, we see a simple, if sobering, pattern: as acceptance rates rise, financial resilience collapses.” He further writes that the relationship is not linear but is exponential. “Beyond 50% acceptance, the decline becomes a free fall. By the time acceptance exceeds 75%, nearly 9 out of 10 institutions are considered high risk.
I added data for the 31 institutions that I selected for his earlier paper. In Table 4 below, I included College Navigator statistics for the number of applications, the percentage accepted, and the percentage that enroll for each institution. Again, I did not include Full Sail, Kaiser, and the University of Miami in the mean and median statistics for the group. AdventHealth (and Full Sail, which is not included in the stats for the group) have asterisks in their columns representing that they did not provide admissions data but stated they have an open enrollment policy (meaning that they admit all who apply).
Based on Greenfield’s research on admissions selectivity, many of Florida’s private colleges and universities could be considered high risk. Excluding the three institutions previously mentioned, the lowest acceptance rate is 41% at the University of Tampa, and three institutions (AdventHealth, Bethune-Cookman, and St. Thomas) are open enrollment, meaning they accept 100% of all applicants. The mean for the group is 70% and the median is 73%.
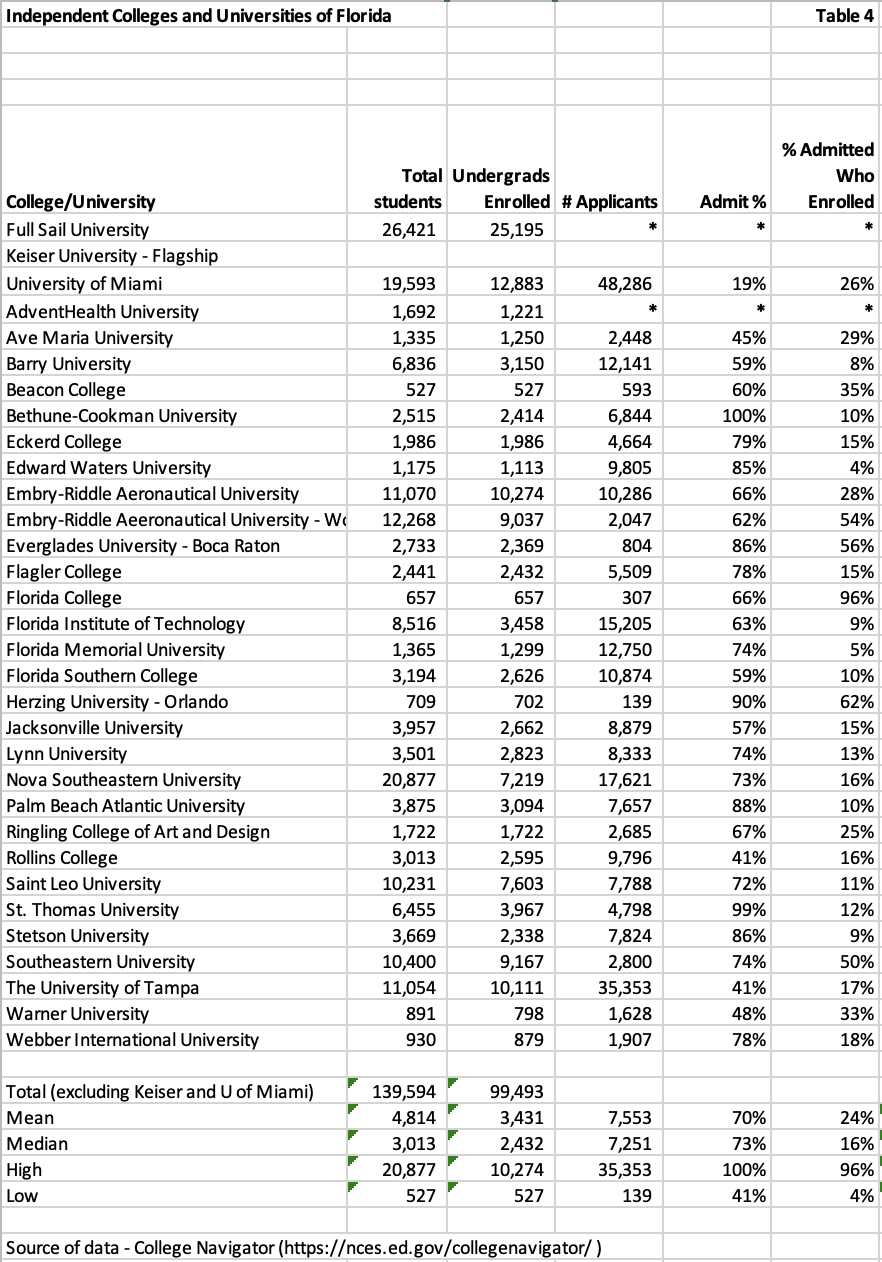
Greenstein’s paper discusses the differences in financial risk at institutions with acceptance rates below 10%, those between 10% and 25%, those between 25% and 50%, and those above 50% and those above 75%. Note that no private institution in Florida has a single-digit acceptance rate, and the University of Miami is the only one under 40% with 19%. There are four colleges and universities in the dataset with admission rates between 40% and 50%. These are: Ave Maria University, Rollins College, The University of Tampa, and Warner University.
When the acceptance rate exceeds 50%, Greenstein notes that liquidity falls below 75% and tuition dependency surpasses 80%. Institutions are trapped in a spiral of shrinking enrollment, rising discounts, eroding net tuition, and collapsing unrestricted assets. By the time they reach a 75-85% acceptance, most institutions exhibit 3-5 signs of financial decline. At a 85-100% acceptance rate, tuition provides 90% of revenue, reserves are almost non-existent, and financial distress is structural, not cyclical.
Selectivity matters because “it is a proxy for pricing power and brand elasticity.” Institutions have the power to control pricing without offsetting demand. Beyond 50% acceptance, the market sets the price of tuition, and institutions’ margins decline as net price declines. Institutions with more than 50% acceptance rates are in the part of the higher education market that is overcrowded and price sensitive.
Some of this market effect is evidenced by the percentage of those admitted who enrolled. The median percentage for the group of 28 is 16%. Five of the colleges and universities have single-digit enrollment percentages. At the same time, five of the colleges have enrollment percentages of 50% or better.
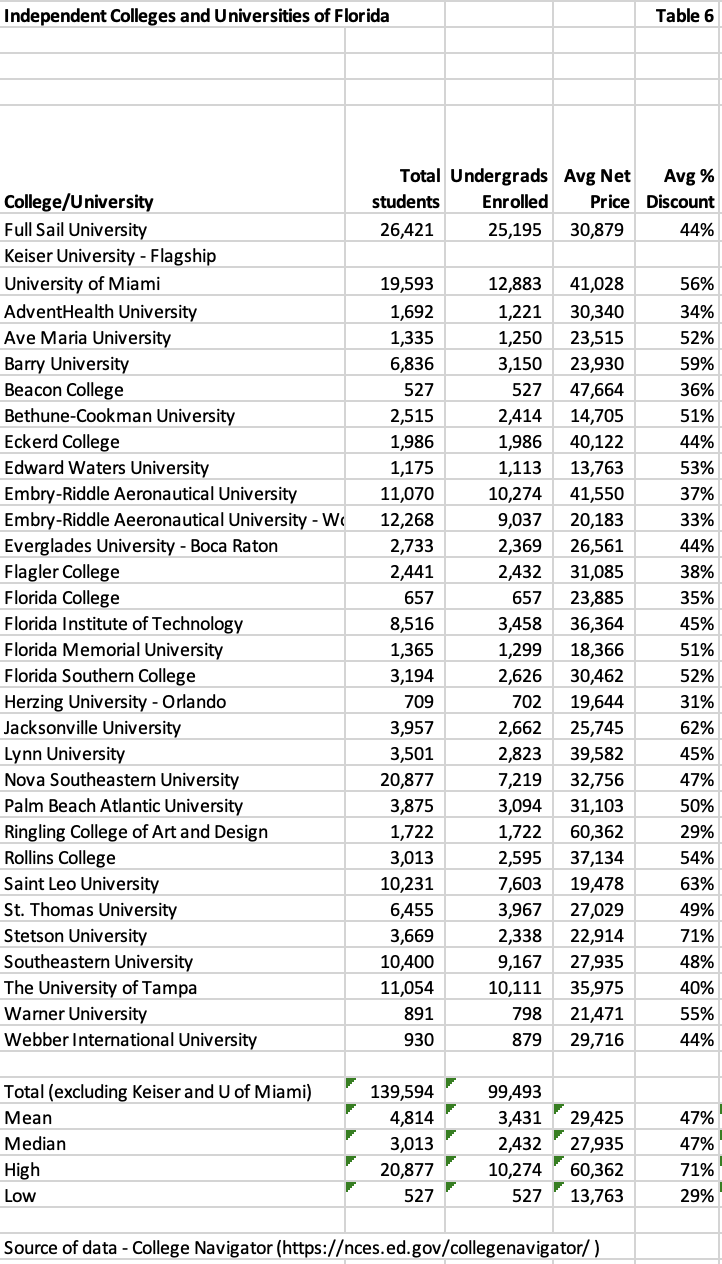
Although Mr. Greenstein emphasized the net price as the primary source of cash for institutions without large endowments, it’s also important to look at the discount percentage (1 minus the average net price divided by the total cost of attendance) to evaluate the impact of the market on pricing. In Table 6 below, the net discount percentage is calculated for each of Florida’s private colleges.
The University of Miami has a discount percentage exceeding 50%, but a percentage of that is more than likely covered by their endowment. The remaining 28 colleges have a mean average tuition discount percentage of 47% and a median average tuition discount percentage of 47%. Florida’s private colleges’ and universities’ mean and median discount percentages are nearly 10 percentage points less than Maryland’s and Virginia’s. This means more net cash for operations for Florida’s private institutions because the Florida Bright Futures Scholarship Program provides scholarships for Florida residents at its public and private colleges and universities, and those grants would be included in the grants offset from the Cost of Attendance.
The highest (or steepest) average tuition discount percentage is at Stetson University, with a rate of 71%. Stetson has a very high admit percentage and a single-digit enrollment percentage, exhibiting fierce market competition. The 71% discount rate is their “solution” to enrolling students. The lowest average tuition discount percentage is at Ringling College of Art and Design, with a rate of 29%. Ringling also has a 25% enrollment rate.
The low selectivity at almost all these institutions and high average discount rate illustrate the market dependency issue emphasized by Mr. Greenstein. Stetson University has the highest average discount rate (71%) and one of the highest admission rates (86%). Would the Florida market react positively to a lower tuition and a lower discount rate? It appears that the market isn’t as competitive as the Mid-Atlantic, with an average discount percentage nearly 10 percentage points less than Maryland and Virginia.
Mr. Greenstein discusses that each of the 1,000+ institutions in his dataset was scored across approximately 36 different financial and operational metrics. Among those were: liquidity, margin, tuition dependency, enrollment trend, and cost structure.
Risk archetypes appear in layers when institutions have low selectivity, writes Greenstein. Enrollment fragility and tuition dependency appear in nearly every institution. Academic program sprawl and financial distress appear as liquidity erodes.
Greenstein writes that the conclusion from this data analysis should not be that colleges need to increase their selectivity. Selectivity defines the institution’s structural position, as well as the pricing power and market elasticity it commands. Strategy should be guided by understanding that position, not trying to increase selectivity.
Greenstein recommends that institutions with an acceptance rate of more than 70% should consider scale initiatives such as:
- Collaborating with other institutions to share administrative and technology costs
- Specializing in mission or program areas where competition is low
- Diversifying through adult, online, or workforce-aligned programming
- Partnering with states or systems to simulate the economies of scale that you lack
He also recommends considering financial restructuring or mergers before financial reserves are depleted. Greenstein did not recommend adding graduate programs, but the third bullet could theoretically include graduate programs (in my opinion).
Where an institution is on the selectivity curve matters, writes Greenstein. Elite colleges have room to adjust their operating models without breaking. Open enrollment (100% acceptances) institutions do not. Institutions in the middle have too much cost to shrink and too little market to grow. Once the market takes over, the odds of recovery diminish rapidly.
Revenue Streams
Tuition-dependent institutions should be resourceful in their quest for stable or increasing revenues. In Capitalizing on College, author Joshua Travis Brown cites a college president who referred to his quest for diversifying revenues as his “Tabletop Strategy.” Additional markets, modes of operation, or degrees were referred to as adding legs to the existing table of operations. The more legs, the stronger the institution.
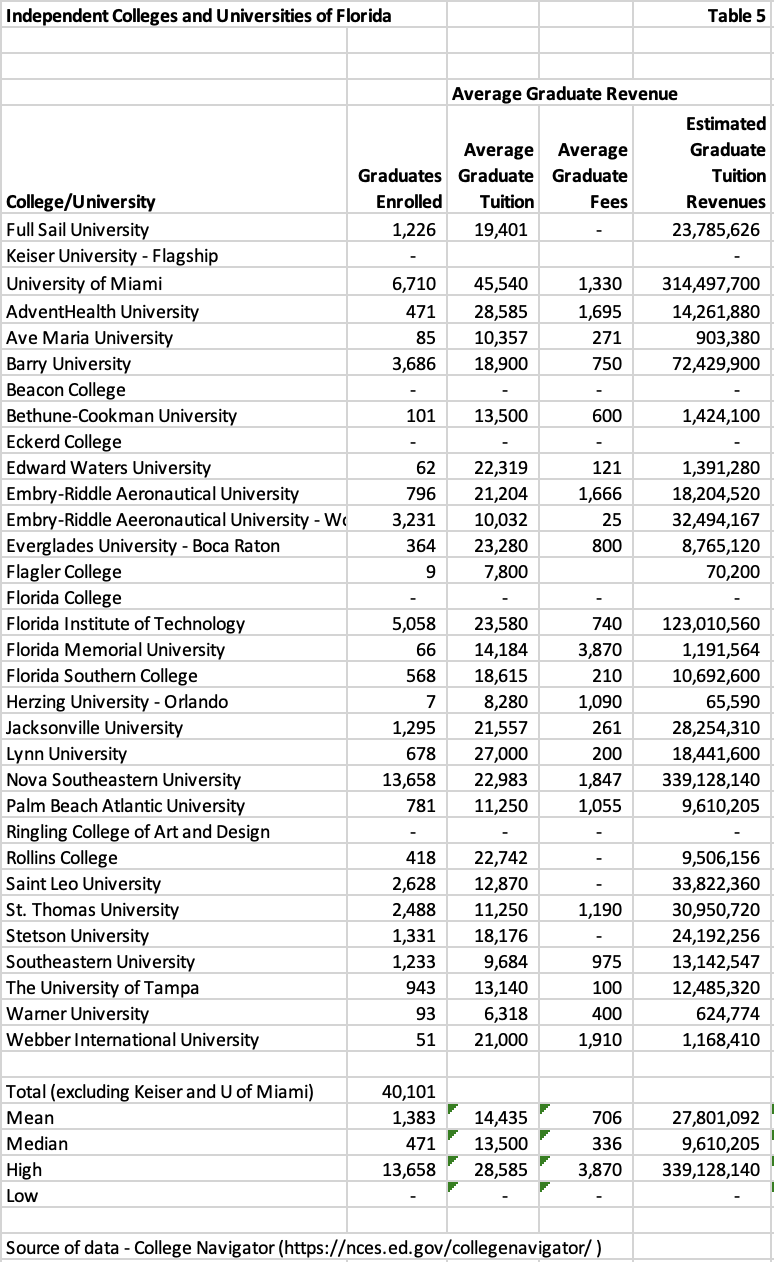
Many of the ICUF institutions appear to be offsetting non-selective undergraduate enrollments with graduate enrollments. In Table 5 below, I used the average graduate tuition and fees for each institution and multiplied them times the number of graduate students to derive an estimated graduate tuition revenue. While this may not take into account financial aid or discounts, it’s a relatively useful tool for seeing how much revenue each institution generates from its graduate programs.
With 13,658 graduate students, Nova Southeastern University has an estimated $339 million in graduate revenues. The mean ($27,801,092) and median ($9,610,205) estimated graduate tuition revenues for the other 27 colleges and universities are quite different but indicate how graduate tuition revenues can enhance the colleges’ financial situation. Stetson University, one of the least selective and with a single-digit enrollment rate, receives a little more than $24 million in graduate tuition revenues.
The range of estimated graduate tuition revenues for the other 27 institutions goes from a high of $123,010,560 at Florida Institute of Technology to a low of $0 at three colleges with no graduate students.
One of the first colleges or universities to receive accreditation approval for its online degree programs was the University of Phoenix, approximately 30 years ago. While many colleges are familiar with the online format (and even the holdouts adapted during the recent COVID pandemic), very few have successfully implemented it on a large scale.
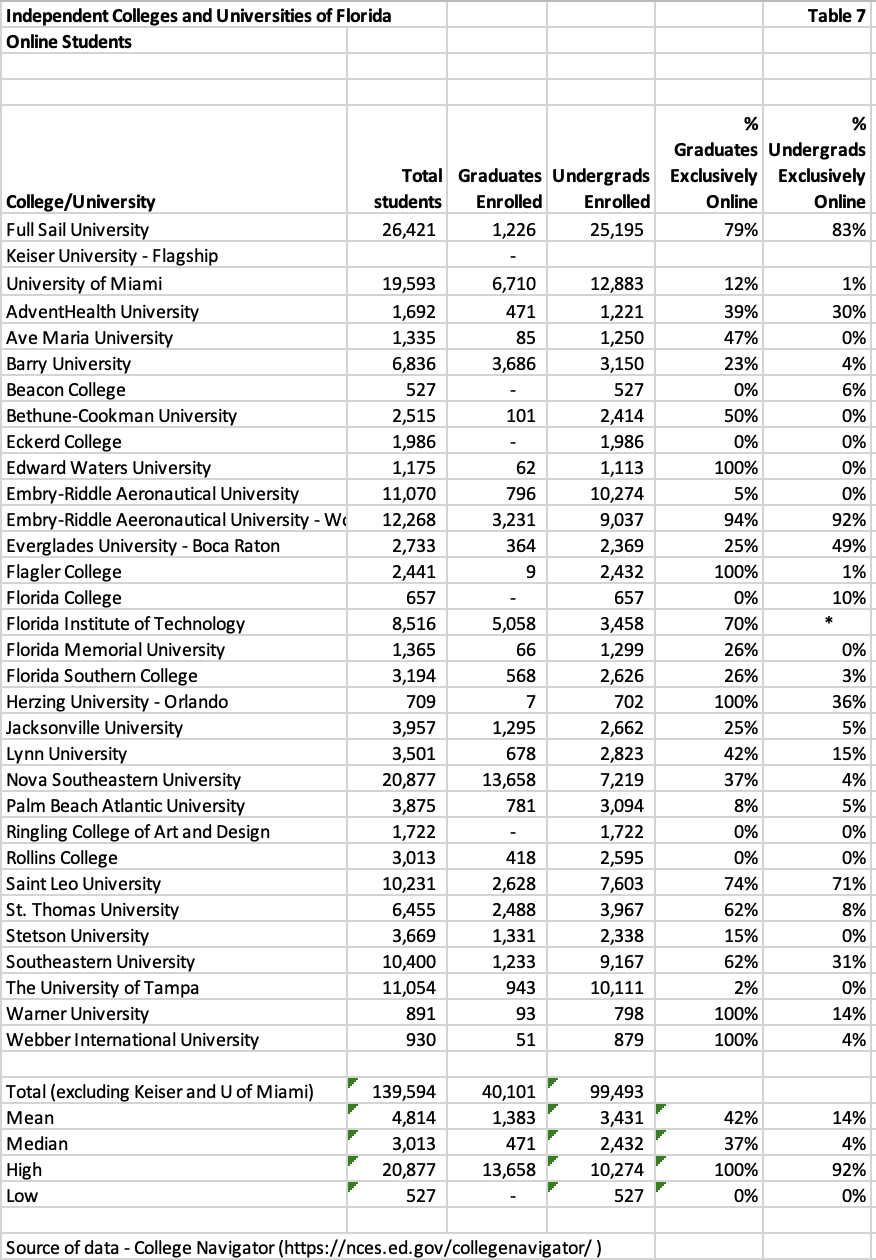
College Navigator provides data regarding the percentage of undergraduate and graduate students who are studying exclusively online, partially online, or not online at all. Table 7 below includes the percentage of students who are enrolled exclusively online at each of the colleges and universities. With nearly 80% of its 26,400 students enrolled exclusively online, it’s obvious why Full Sail was excluded.
The median of the group of 28 is more representative of their utilization of online courses and programs for incremental enrollments and revenues. While 4% of undergraduate enrollments is the median for undergraduates, 37% of graduate enrollments is the median for graduates.
Five of the 28 colleges and universities enroll 100% of their graduate students exclusively online. Embry-Riddle Aeronautical University – Worldwide enrolls more than 90% of its 12,268 students exclusively online. I did not exclude them since they are a separate division of Embry-Riddle Aeronautical University, which enrolls none of its 10,274 undergraduates exclusively online. If combined, the online enrollments at Embry-Riddle are approximately 50% exclusively online.
Another source of revenue diversification is adult education. Since many of these students enroll exclusively online, I did not attempt to create a chart from the enrollment age data included in College Navigator.
A Few More Thoughts
I found both of Mr. Greenstein’s studies to be informative. While some of the findings are intuitive (increased tuition discounting leads to decreased operating margins, for example), having a 1,000-plus institutional dataset to use for analysis is impressive.
Building my own small dataset utilizing enrollment, tuition, net price, and admissions selectivity for 30 private institutions in Florida, plus the 39 in Maryland and Virginia allowed me to grasp the significance of Greenstein’s findings as well as the market situation impacting many of our private institutions. I don’t intend to add to my articles about Greenstein’s findings, but I may add data from other states from time to time as I work with a few selected colleges and universities.
Most senior administrators working for at-risk private institutions are aware of many of these challenges. Some may have found enrollment and revenue solutions, and others may still be treading water in a competitive market. The findings of Greenstein’s research may be more relevant for their board members as they consider strategies for success or survival.