
Strada Education Network has been an innovative supporter of education initiatives since its founding in 2014. Last week, Strada Education Foundation released a new research report announcing the development of the State Opportunity Index.
“The State Opportunity Index was developed to help states build a stronger connection between education after high school and equitable pathways to opportunity, so students realize the full value of their education and employers have the workforce they need to fill high-demand, high-wage jobs.”
Five Higher Education Priority Areas
The report issued by the researchers establishes a baseline for how states are doing as measured in five key areas for improving higher education:
- Clear Outcomes – Collecting and providing the education-to-employment data needed to make informed decisions.
- Quality Coaching – Providing guidance and support to help students map a career path and navigate challenges.
- Affordability – Removing cost as a barrier to post-high school education.
- Work-Based Learning – Creating more opportunities for applied learning and career exploration.
- Employer Alignment – Positioning students for career success.
Looking at these five areas as a group, they provide a framework for improving higher education policies and practices to support educators, students, and employers.
Higher Education Progress Classifications
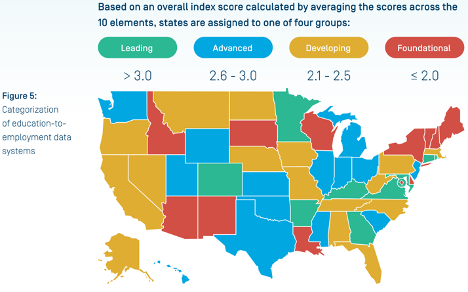
The researchers created a four-scale index and color code to measure state progress in each of the priority areas. These include in order of ranking from highest to lowest:
- Leading (Green) – State is at the forefront and has made the most progress toward creating equitable pathways to opportunity.
- Advanced (Blue) – State has made substantial progress toward creating more equitable pathways to opportunity.
- Developing (Yellow) – State is in the early stages of creating more equitable pathways to opportunity.
- Foundational (Red) – State is just beginning to create more equitable pathways to opportunity.
The report also includes analyses of findings by race, gender, and first-generation status to highlight obstacles. Future updates will refine these analyses and add new data sources when available.
Return on Investment
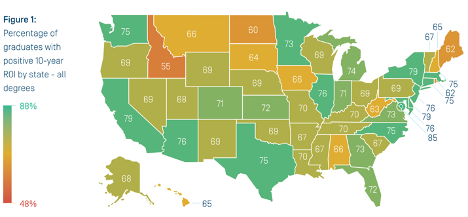
In addition to the five priority areas included in the Index, a return on investment (ROI) calculation is included for each state. For purposes of the report, ROI is developed by calculating the percentage of the graduates who would likely experience a positive return on their investment based on the income distribution for recent college grads in the state.
An ROI is positive if graduates in that state earn higher wages than those whose education did not progress beyond high school and if the earnings premium over a 10-year period is greater than the investment in post-high school education.
Improvements in each of the five priority areas should enable more graduates to experience a positive ROI as well as to experience more equitable pathways to opportunity. Each state’s positive ROI value incorporates data from bachelor’s and associate degree holders, with their costs of education and earnings premiums.
The Opportunity Index looks at earnings premiums by individuals and not by median or mean, like many other reports.
The percentage of recent college graduates who can expect to exceed the positive ROI threshold within 10 years ranges from a low of 55 percent in Idaho to a high of 79 percent in California, Delaware, and New York.
Post-completion earnings play the most important role in determining positive ROI. Students making at least $50,000 per year are likely to experience positive ROI in even the most expensive state. Students making less than $30,000 will not experience ROI regardless of the cost of their education.
Figure 1 below provides the ROI calculations by state for all graduates with bachelor’s and associate’s degrees. The report provides separate figures for bachelor’s and associate’s graduates.
Clear Higher Education Outcomes
Most learners are unaware of outcomes data for specific educational programs and institutions. Access to accurate and timely data benefits all stakeholders. Without data about education and employment outcomes, students are unable to make critical decisions about their education and career goals. Program major and institution are crucial choices.
State longitudinal data systems have the highest potential for improving the connection between education and opportunity. While most states collect an array of data, few host a central database for collecting and distributing education-to-employment (E2E) data. Even fewer have the staff capacity to act after analyzing that data.
States establishing robust E2E systems will enable policymakers, institution leaders, researchers, learners, and the public to understand the connections between post-high school education and labor market opportunities and demands.
The report’s researchers identified 10 critical elements that contribute to the potential of state databases to strengthen the connection between education and opportunity. These 10 elements are organized in a framework that highlights four required functions:
- Collect
- Integrate
- Provide
- Impact
No state has completely developed its databases across all 10 elements of the framework, but most states are making progress. Only a few states have enhanced their wage records to produce insights into occupational outcomes of post-high school programs.
Figure 5 below categorizes the 50 states by their progress in establishing education-to-employment data systems. Only nine states are included in the Leading classification.
Quality Coaching
Quality coaching is an important component of improving student completion outcomes. The report’s researchers write that “coaching is available in many forms and ideally should be adapted to different stages of the education-to-career journey.”
Examples of areas where coaching is applied at different stages include:
- Career services
- Community organizations
- Job centers
- Institution-provided advising
- Student success programs
“Guidance that incorporates career exploration, mentorship, and support with the job search is also tied to stronger earnings and employment outcomes.”
The researchers measured coaching progress by determining what percentage of recent graduates had access to education-to-career coaching and guidance while pursuing a degree that provided timely information and support to help them connect their education to a career.
Researchers utilized a national survey of individuals who graduated from public two- and four-year institutions between 2020 and 2023. The survey also included graduates from public four-year institutions in California, Florida, New York, and Texas (the four largest states).
The researchers defined coaching in three dimensions:
- Self-reported experiences of coaching and guidance
- Timely information about career and earnings possibilities
- Support for setting goals and overcoming obstacles.
Findings included the following key points:
- Approximately one-fourth of graduates from two-year institutions and one-fifth of graduates from four-year institutions experienced personalized coaching that included key information and support.
- A higher percentage of students experienced some of these dimensions:
- Coaching or guidance
- Early information on education to career pathways
- Support to develop a plan and overcome barriers.
- Recent bachelor’s grads who reported receiving all three dimensions of quality coaching were more likely to hold a first job that required a degree and are more likely to be satisfied with their jobs and their progress toward long-term career goals.
The nation, and the four-year sectors in the four states surveyed, are characterized as Foundational. Significant improvement is needed to provide the coaching that students need.
Affordability
The cost of education after high school continues to be a major concern for prospective students. Keeping the cost affordable requires a commitment on the part of state and federal policymakers, institutions, and business leaders. Despite multiple scholarship and tuition assistance programs, most students need more financial assistance.
Approximately 85 percent of degree-seeking students receive some combination of grants, scholarships, or loans. However, expenses not covered by aid remain a barrier to achieving their education and career goals.
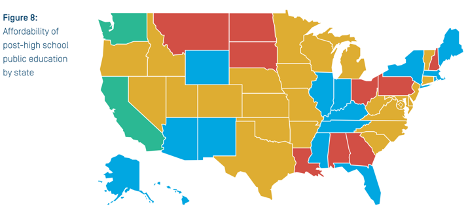
The researchers measured affordability based on the number of hours a student would need to work annually, earning their state’s median wage for college students to cover the net price of their education. Researchers utilized the net price of attending an in-state public institution reported to the U.S. Department of Education. Net price deducts grants.
Based on net price, California and Washington are the most affordable states to attend college. A student would be able to cover the net price by working less than 10 hours per week during the school year and full-time during the summer.
The most expensive states to attend college are Alabama, Georgia, Louisiana, Montana, New Hampshire, North Dakota, Ohio, Pennsylvania, and South Dakota. Students working more than 30 hours per week during the school year and full-time during the summer could not cover their expenses.
Some states, notably Mississippi and Wyoming, have a low net price but are not among the most affordable because wages in those states are relatively low.
Two states are considered Leading, 15 states are considered Advanced, 25 states are considered Developing, and nine states are Foundational (see Figure 8 below). It’s no surprise that four-year institutions are more expensive than two-year institutions. Only one state is at the Foundational level for two-year institutions.
Work-Based Learning
Internships, co-ops, clinical rotations, practicums, and apprenticeships are a few examples of work-based learning that allow students to apply what they’ve learned through their coursework to professional contexts. These opportunities allow students to expand their professional networks and social capital in ways that support their long-term careers.
The researchers claim that internships and apprenticeships have the strongest evidence base for improving student outcomes. However, states are not currently tracking how many individuals experience internships and apprenticeships each year. The researchers chose to use participation in paid internships as their metric for quality work-based learning.
To measure progress toward access to paid internships, the researchers conducted a nationally representative survey of individuals who completed their public college education between 2020 and 2023. Individuals were asked if they participated in an internship during their time in college and if they were paid.
Approximately 25 percent of recent bachelor’s graduates and 10 percent of recent associate’s graduates reported that they held a paid internship while enrolled in school. Just under half of four-year graduates and approximately one-fourth of two-year graduates participated in internships, both paid and unpaid.
Grads who completed a paid internship are more likely to have a first job that requires their degree (73%) compared to those who did not complete an internship (44%).
Employer Alignment
Graduates of programs aligned with the type of employees sought by corporations thrive in work that uses what they have learned in school. To encourage these types of programs to align with employers, institutions need regional labor market data about the availability of opportunity jobs.
Restricted access to high-demand programs is a signal that post-secondary education is not aligned with labor market opportunities. Institutions may cite lack of funding as a justification for restricted access, but these restrictions impact students who could benefit the most.
One important signal of misaligned education is the percentage of college graduates who work in jobs that do not require a degree.
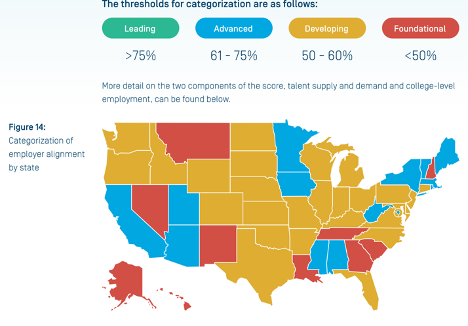
The researchers developed an employer alignment metric for each state and the U.S. by averaging the supply/demand ratio for a group of high-demand, high-wage jobs in each state and the estimated percentage of bachelor’s degree holders between 26 and 30 who were employed in college-level jobs.
Occupations in the group included those that required a bachelor’s degree and those that required an associate degree. The nine occupational areas included embrace approximately one-third of total labor market demand in the U.S. based on job postings.
Findings included the following:
- No states meet overall employer alignment criteria for Leading.
- Top states for meeting the demand for talent in opportunity jobs include Alabama, Rhode Island, Utah, and West Virginia.
- The range of young people (26-30) with bachelor’s degrees who are employed in college-level occupations is tighter across states than the range of supply/demand ratios.
- The top states for college-level employment are Maryland, Massachusetts, Utah, and Washington, DC.
Figure 14 below illustrates the employer alignment by state.
The Road Ahead
The report’s researchers write that “the State Opportunity Index is a first step in helping policymakers, educators, and business leaders measure and improve the connections between education and opportunity in their state.” Additionally, the economic future of the U.S. depends on students completing post-secondary education programs.
To rebuild students’ and citizens’ trust, the following must occur:
- Affordable education options should be available to all students.
- Education programs should better position students for career success.
- Institutions, employers, policymakers, and students need access to education and employment data.
- Paid internships and apprenticeships can help students find more satisfying jobs with better earning potential.
- Quality coaching is a game-changer for students.
A Few More Thoughts
I enjoyed reading the State Opportunity Index report and compliment Strada for supporting the research. The metrics chosen to evaluate states’ progress are a great start. There are more recommendations and more charts in the report than what I covered in my overview. I recommend this report to anyone interested in improving learner-to-career outcomes.
The choice of average net price to measure affordability aligns with my work, exposing the inadequate support of low-income students by almost all colleges and universities other than the Ivy Plus group. As the researchers noted, almost everyone who applies for aid still needs a source of additional funds.
Despite having the lowest cost of attendance of any sector in higher ed, my research indicated that the average net price for the top 50 community colleges was approximately $9,500 per year. For students whose family income was in the lowest quintile ($0-$30,000), the average net price only declined to $7,557. That’s unaffordable.
The State Opportunity Index ranks the states based on the hours per week it takes a student to cover the cost of the average net price. Most community colleges are affordable using that metric. Many public four-year colleges have a much higher net price. My analysis indicated the average was $17,962. Students in the lowest quintile net price was $10,518.
Few community colleges can attract many out-of-state students paying a higher price. In several of the states I reviewed, the out-of-state price for a community college was the same as the out-of-district price for an in-state student. Four-year publics, particularly flagships, award approximately half of their undergraduate seats to out-of-state students willing to pay the much higher tuition.
College administrators ignore the fact that many families are savvier about the components of a higher education return on investment, namely the net price to them and the job opportunities for their son or daughter when they graduate.
States need to make sure that coaching is available to all students, particularly those from lower-income families. Again, the inclusion of a metric related to coaching by the State Opportunity Index researchers was brilliant. Paraphrasing an old advertising slogan, “a mind is a terrible thing to waste.” So is a student’s time and their money.
Kudos to Strada, its researchers, and its Strategic Advisory Group. I look forward to reading future updates about this great work!


