It’s no secret that many colleges are in financial trouble. Non-elite private colleges have embraced the practice of offering tuition discounts in the form of merit scholarships for so long that more than 60% of their tuition is discounted. Public colleges and universities are subject to pressures from state higher education finance decisions as well as political winds that influence their funding.
Every year since 2003, the State Higher Education Executive Officers Association (SHEEO) has published its annual report about state higher education funding and enrollment trends. The FY 2023 report, published in May 2024, provides some interesting insights about the current funding and enrollment status of public universities.
SHEEO is often the organization reporters interview when a public university or system has financial issues. When WVU announced its major budget cuts, SHEEO’s Tom Harnisch said he expected more flagships to follow in WVU’s footsteps. I last wrote about this report in 2021 and thought it was time for an update. Almost all the material that follows is from the 2023 report.
Education Appropriations and Enrollments
The 2023 report highlights that state and local funding for higher education totaled $129.8 billion in FY 2023. In addition, 28 states used some portion of the $1.7 billion in federal stimulus funding provided to states for higher education in 2023. The states contributed $116.4 billion, and local governments contributed $13.4 billion to higher education.
In the SHEEO-provided table below, you can see that tax appropriation covered 81.7% of total funding in 2023, local tax appropriation covered 10.3%, non-tax support (mostly lotteries) covered 4.1%, and federal stimulus covered 1.3%.
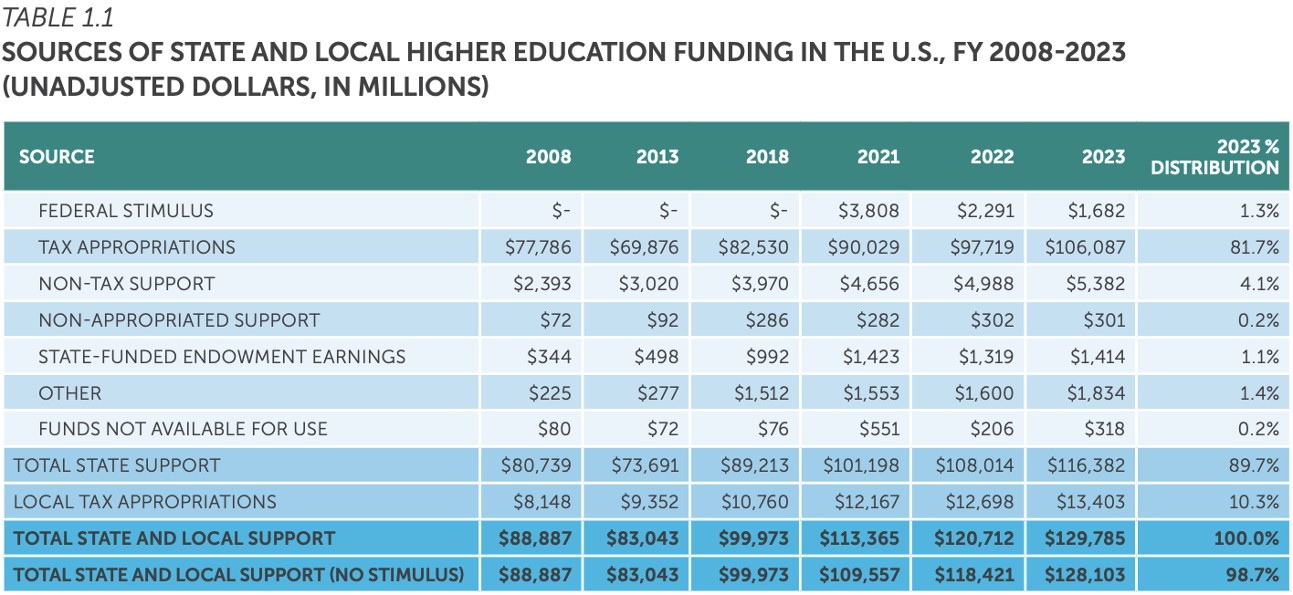
SHEEO notes that the proportion of total higher education funding from local appropriations has increased in 23 states over the past 15 years (2008-2023).
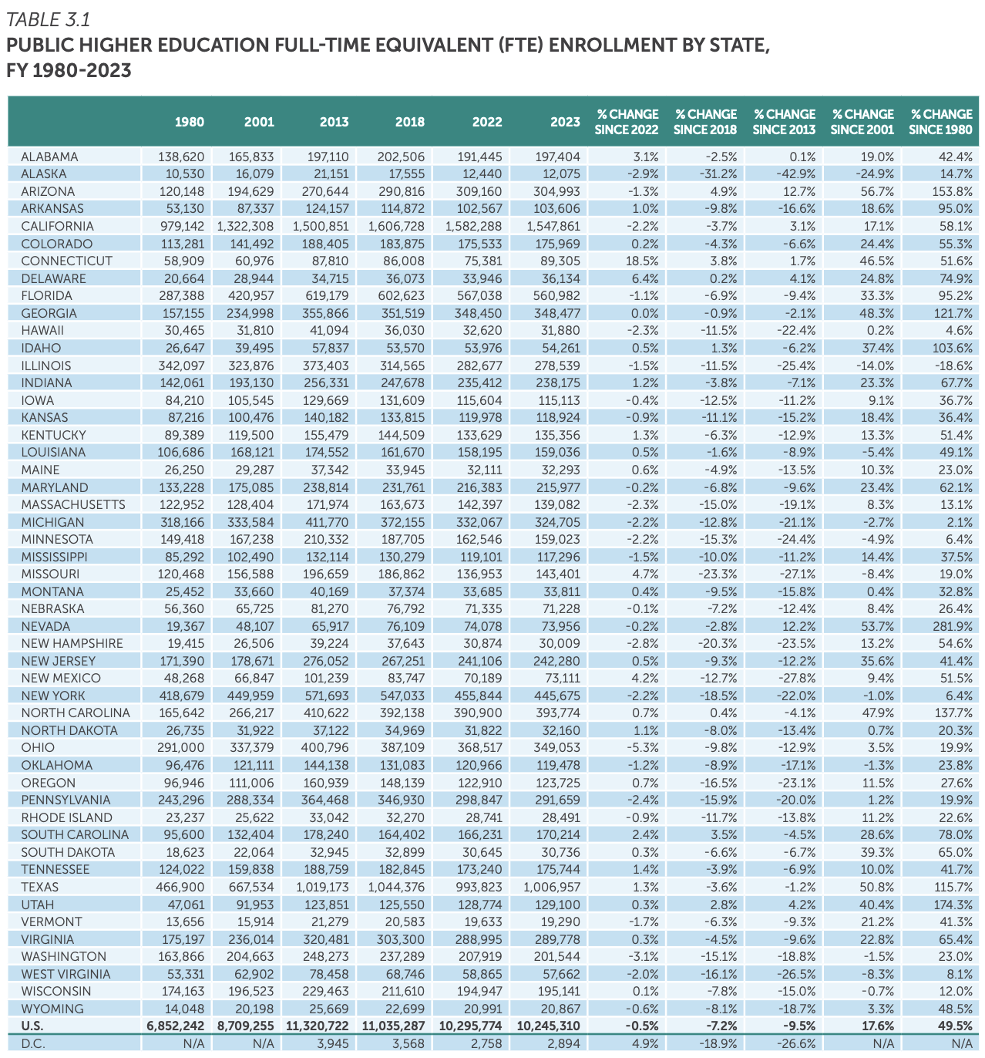
SHEEO converts student enrollments to full-time equivalents (FTEs). There were 10.2 million FTE students enrolled in 2023. Net FTE enrollment declined .5% in 2023. This was the 12th consecutive year of enrollment declines. FTE enrollment at public funded universities has decreased 12.1% from its 2011 peak.
FTE enrollment increased from 6.85 million in 1980 to 10.2 million in 2023. COVID-19 and the ensuing economic recession altered the traditional counter-cyclical enrollment trend, with the largest year-over-year decline on record in 2021 (3.3%).
Table 3.1 from the report appended below provides public higher education enrollment data by state at major transition points since 1980, including the last two years. The changes between those points are included in the columns to the right. While the percentage change since 1980 is 49.5%, the percentage growth in enrollment since 2001 is only 17.6%, a notable difference.
Education appropriations per FTE increased 3.7% beyond inflation to $11,040. This was only the second time since 2008 that inflation-adjusted appropriations per FTE were greater than the levels in pre-recession 2008. As you can see from Figure 3.2 appended below, there are more states that appropriate less than 11,040 than those that appropriate more.
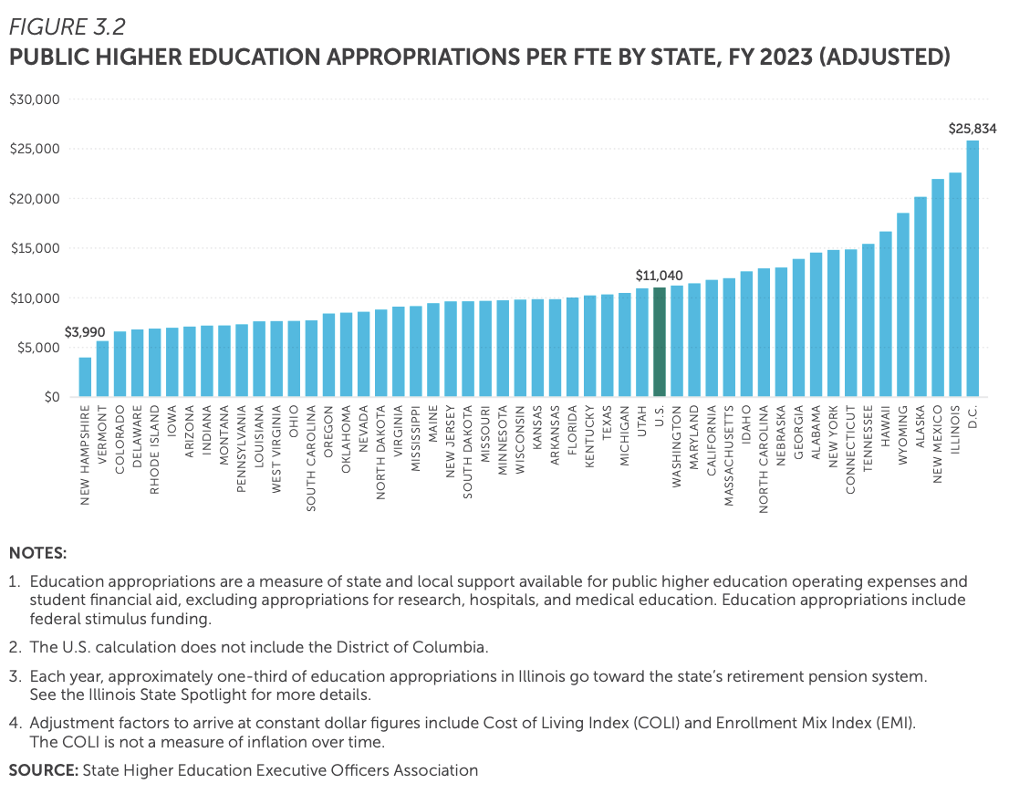
Figure 2.1 from the report (appended below) illustrates the changes in FTE enrollment, appropriations per FTE, and net tuition revenue per FTE since 1998. The light blue shaded portion of the bars indicates the portion of education appropriations per FTE and illustrates 2023’s increased share.
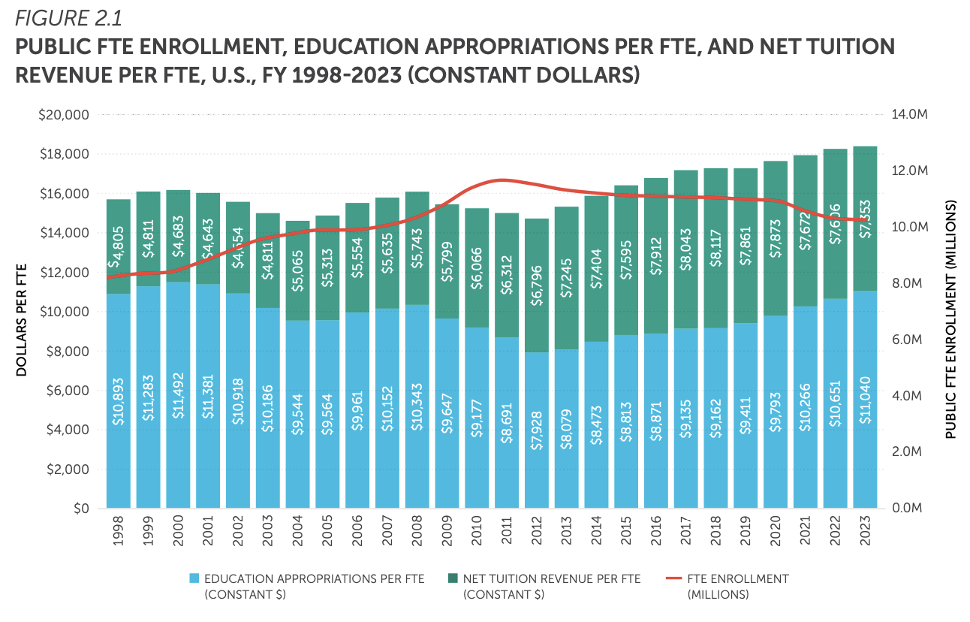
SHEEO writes that three trends can explain the increase in 2023:
- Increasing state commitments to higher education funding.
- A sharp decline in FTE enrollment.
- Generous federal stimulus funding.
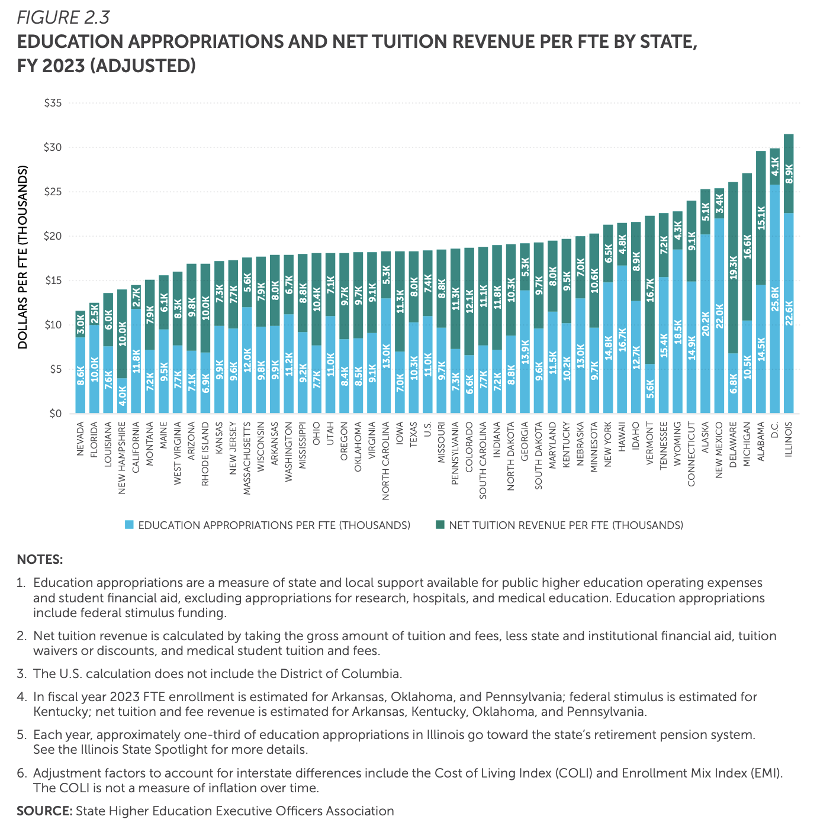
Another figure from the report provides the education appropriations and net tuition revenue per FTE by state in 2023. The states are ranked from the lowest (Nevada) to the highest (Illinois), and the portion covered by tuition is shaded in green. I like to check out where a specific state is to the left (below) or right (above) of the U.S. median.
State public financial aid is any appropriated student financial aid for public institutions excluding student loans. Public aid accounted for 80.2% of state financial aid funding in 2023, reaching an all-time high of $1,050 per FTE. In 2023, 27 states increased their financial aid funding per FTE. Most states awarded more financial aid per FTE to students attending four-year institutions.
Net Tuition and Fee Revenue
SHEEO defines net tuition and fee revenue as the total amount of tuition and fees received by public institutions minus state and institutional financial aid and medical tuition and fees.
Notably, inflation-adjusted net tuition and fee revenue has increased substantially since 1980. Over the past 43 years, tuition revenue per FTE at public institutions has increased 179.6%. These increases are primarily due to increases in tuition and fees and an increasing enrollment of out-of-state, international, and graduate students.
Public institutions received $7,353 in net tuition and fee revenue per FTE in 2023, a 3.3% decrease from 2022. This year’s decrease is the largest single-year decrease since 1980. Net tuition and fees per FTE range widely across the states due to student mix, the level of state support, and whether state institutions are permitted to increase their tuition.
The lowest net tuition and fee revenue per FTE is $2,461 in Florida, and the highest is $19,338 in Delaware. Net tuition and fee revenue per FTE declined in 36 states from 2022 to 2023. This is an anomaly, given that net tuition and fee revenue has increased in all states since 1980 and by more than 100% in 42 states.
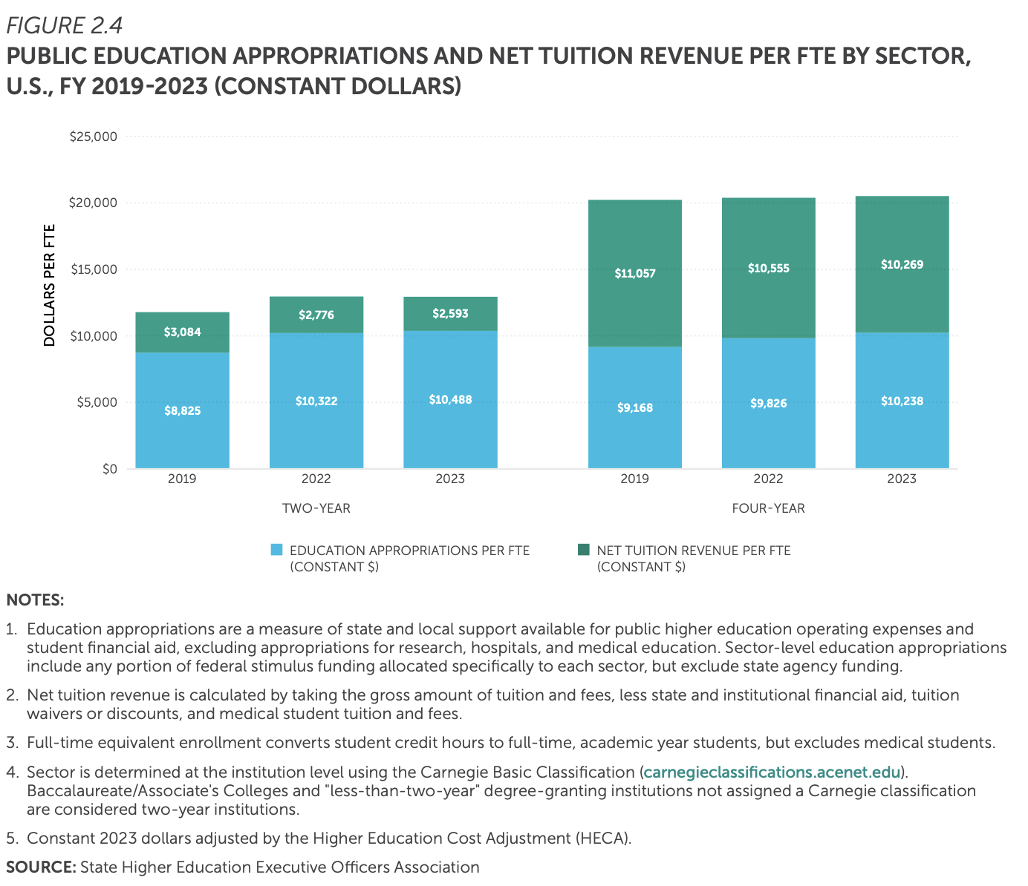
Net tuition and fee revenue averaged $2,593 per FTE at two-year institutions, a 6.6% decrease from 2022. Net tuition and fee revenue per FTE averaged $10,269 per FTE at four-year institutions, a 2.7% decrease.
Total Education Revenue per FTE
If you add education appropriations and net tuition and fee revenue (excluding that used for capital debt service), the sum is total education revenue. The combination of these two revenue sources is how state institutions cover their expenses.
Total education revenue increased by 0.8% from 2022 to 2023. SHEEO notes that many institutions have not been able to increase tuition and fee revenue to offset declines in state funding, keeping total education revenue from reaching an all-time high. Only 13 states experienced an all-time high for total education revenue in 2023.
It’s not a surprise that total education revenue varies widely by state. Total education revenue ranged from a low of $11,570 per FTE in Nevada to a high of $31,076 in Illinois. Total education revenue per FTE decreased in half of all states from 2022 to 2023.
At two-year institutions, total education revenue per FTE averaged $13,061 per FTE, a .1% decrease from 2022. At four-year institutions, total education revenue per FTE averaged $20,373, a .6% increase from 2022. The major difference between two-year and four-year institutions is the much higher tuition revenue collected by four-year institutions.
You can see this difference between the higher tuition revenue for four-year institutions versus two-year institutions highlighted in the figure below. The average state appropriations per FTE is close for the different institutional types. The tuition differences are substantial, and the time to completion is double (for four-year).
Student Share
Since 1980, students (and their families) have increasingly picked up a larger proportion of the total education revenue at public institutions through tuition and fee revenue.
SHEEO reports that the average student share of total education revenue in 1980 was 20.9%. In 2023, the average student share of total education revenue was 40.2%. The latter statistic means that across the U.S., students and their families are picking up 40.2% of the total education revenues at public institutions.
Naturally, the average student share varies widely by state. There were 21 states in 2023 where the student share averaged more than 50%. At the same time, average student share decreased in 35 states from 2022 to 2023. SHEEO believes the decreases represent efforts from states to increase college affordability.
There is a major difference in average student share between two-year and four-year institutions. At two-year schools, the average student share in 2023 was 19.9%. It was more than double at 50.4% at four-year institutions.
There are only three states—Florida, South Dakota, and Wyoming—where two-year students are responsible for a greater portion of public institutional revenue than students attending four-year institutions.
Implications of the Data
The authors write that 2023 defied the trend from previous years following a decline in the economy. Instead of deep cuts in state funding and major growth in student enrollment and tuition revenue, inflation-adjusted state and local appropriations per FTE increased, and enrollment decreased.
The 2023 year was the 11th straight year that state and local appropriations per FTE increased. It was only the 2nd year that the education appropriations per student exceeded the 2008 level. States allocated less federal stimulus funds in 2023 than in 2022, but these funds are expected to end.
COVID-19 altered the typical counter-cyclical enrollment trend, where college student enrollment increased in the years following economic recessions. Enrollment at public institutions decreased by 6.1% from 2020 to 2023. This decline represented the equivalent of 665,976 FTE students.
Net tuition and fee revenue did not increase enough to cover inflation during that same three-year period beginning in 2020. The continued decline in tuition revenue pressures the states not to cut funding for their higher education institutions. If credential production is expected to increase to meet workforce needs, states will need to provide adequate funding.
Final Thoughts
I am grateful that SHEEO produces and publishes this report each year for years. In the U.S., our public institutions educate a substantial percentage of our college students.
The SHEEO report is always a retrospective analysis. This is helpful to observe trends and use them to predict trends (which the report does not do). Many articles forecast increased demand for micro-credentials and other short-term certificates to meet the demands of the workforce.
If those trends reduce FTE enrollments, particularly at four-year public institutions, state legislatures may shift some funding from four-year institutions to two-year institutions. Offsetting that shift could be enrollments in dual credit programs that shorten the time a student is enrolled at a two-year college before transferring to a four-year university.
The future is anything but certain. Nonetheless, expect volatility in funding in all but the wealthiest states.


