
My interest in business models stems from one of my summer jobs during college. What I learned still informs my thoughts about private school tuition discounting today. I worked at a resort motel in Ocean City, Maryland. From July 4 through the third week in August, all the motels in the area were fully occupied.
I worked for a proprietor whose four properties were not part of a national chain. Reservations were made by phone. The Internet did not exist.
Summer weekends were very busy, and all our rooms were usually booked in advance. We had fewer reservations for Sunday arrivals than Sunday checkouts and depended on walk-ins. The proprietor would call on Sunday morning and ask how many rooms were open that night. Depending on the weather and the number of open rooms, he would adjust the room rate up or down.
I witnessed first-hand how the laws of supply and demand were in play. The theoretical lessons from my economics course transformed my workplace. I never forgot those lessons, and throughout my career, I learned to focus on the basics of the business models of my clients, my companies, and my competition.
The Cost of Private School
Earlier this week, I was reminded of business models when I read an article by San Francisco Chronicle reporter Kellie Hwang titled “Here’s the total cost of a private school education in San Francisco – and how it got so high.” Ms. Hwang reported that “the cost to send a child to 13 years of elite education [in San Francisco] tall[ies] $520,000 from kindergarten through high school.”
Ms. Hwang adds that the average private school tuition in the San Francisco area has risen nearly 70 percent over the past two decades but more than 240% over the past four decades. Annual tuition today averages over $38,000, but the highest school charges $61,315. Nearly one-third of San Francisco school children attend private schools.
Education “costs” are blamed for higher tuition at the area’s independent schools. Ms. Hwang cites a National Association of Independent Schools (NAIS) that reports inflation-adjusted tuition grew by 102% from 1990 to 2020 while median family income grew by 23%. During this period, the ability of families to pay private school tuition clearly decreased.
Faculty and staff salaries are reported by NAIS (and Ms. Hwang) as the largest cost for private schools. The low student-to-teacher ratios and student support services are cited as cost drivers of the independent school business model as well.
Private School Finances
After reading Ms. Hwang’s article, I wasn’t sure that the faculty and staff salaries were the only reason tuition increased so rapidly. Having written about private school finances in the past, including an article last month about private school tuition discounting, I thought I would attempt to build a rudimentary business model by looking at six other financial components, which include:
1. The Prototype
I created a fictional school named All Saints Independent School (my apologies if a school exists by that name). I built a model that used 500 students as All Saints’ total enrollment for grades K-12 in 1990. I established 50 students (10%) of the 1990 total as financial aid recipients and 50 students (10%) as teacher/staff children receiving tuition remission. Full-pay students totaled 400 or 80% of overall students.
Ms. Hwang stated that private schools in the San Francisco area have increased their tuition by an average of 4% per year since 1990 and that the average tuition for the fiscal year ending June 30, 2024, was $38,000. Using that data as a base, I built the following sections of my model and rounded the 1990 tuition to $10,000.
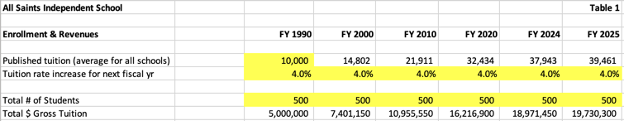
2. Enrollment and Revenues
In Table 1 below, I highlighted in yellow the cells with manual inputs. In this example, it’s the Fiscal Year (FY) 1990 tuition, the tuition rate increase (used 4.0% for each year), and the total number of students (used 500 for each year). I collapsed the spreadsheet to highlight every ten years as well as FY 2024 and FY 2024.
Without changing the overall enrollment, the gross tuition increased from $5M in FY 1990 to $19M in FY 2024. That’s nearly a 400% increase with no change in enrollment, just the compounding effect of an annual 4% increase in tuition over 34 years.
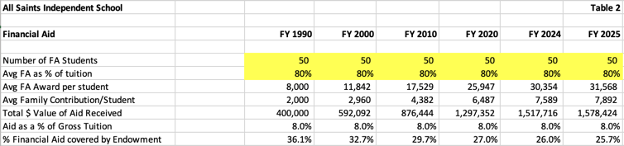
3. Financial Aid
Once again, in Table 2 below, I highlighted in yellow the cells with manual inputs. In the example below, it’s the number of financial aid students and the average financial aid award as a percent of tuition. There is a line titled % of Financial Aid covered by Endowment that is derived in a separate section that I will discuss below. This is a calculation, not an input.
Without changing the number (or percentage) of students receiving financial aid or the percentage of aid received, the average family contribution increased from $2,000 in FY 1990 to $7,589 in FY 2024, a nearly 400% increase matching the impact of the 4% tuition increase on tuition revenue since I did not change the percentage of aid received. Given that Ms. Hwang reported that the average family income increased by 23% over the same period, these assumptions may be flawed.
Keeping the average financial aid award at 80% meant that the school’s annual portion per student increased from $8,000 in FY 1990 to $30,354 in FY 2024. Holding the number of financial aid students constant caused the total annual aid to increase from $400,000 to $1.5M. It could have been a lot higher if the average award increased or the percentage of FA students increased.
Even though a portion of the financial aid budget is covered by restricted endowment funds, the percentage of financial aid covered by tuition (a tuition discount) increased from 64% in FY 1990 to 74% in FY 2024. The discount percentage would have been higher if the net yield from the endowment had been less than 3% (see endowment section 6 below).
4. Tuition Remission
Table 3 below provides an overview of faculty and staff children at All Saints who receive a tuition remission (TR) benefit. The number of TR students was held constant over the period, and the cells are highlighted yellow to indicate that the number is a manual input.
I assumed for purposes of this model that the TR benefit is 50% of tuition with no additional aid available. Private school tuition remission benefits range from financial aid only to 100%. I believe the middle of the market is closer to 50%; I am not sure if that includes additional aid.
Based on the assumptions, the average faculty and staff member’s tuition contribution starts at $5,000 in FY 1990 and is $18,971 in FY 2024. If faculty and staff salaries increased at the same rate over the period as the general workforce, the increase in family contribution would likely lead to a decrease in the number of families able to afford to send their children to All Saints or a change in the profile of a faculty member, likely someone whose spouse earned enough money to be able to pay the 50% contribution.
I added a row for the percentage of tuition remission covered by a restricted endowment. My assumption is that there are no endowment funds dedicated to cover this expense.

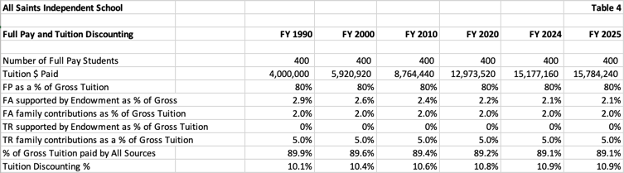
5. Full Pay and Tuition Discounting
Table 4 below requires no inputs. The number of full-pay students is calculated after the financial aid students and tuition remission students are subtracted from the total students enrolled. The FY 2024 overall tuition discount rate of 10.9% is approximately half of what the national average tuition discount is for independent schools. Holding the number of FA students at 10% kept the overall tuition discount rate below average because the tuition discount percent for financial aid at independent schools is between 16-18%.
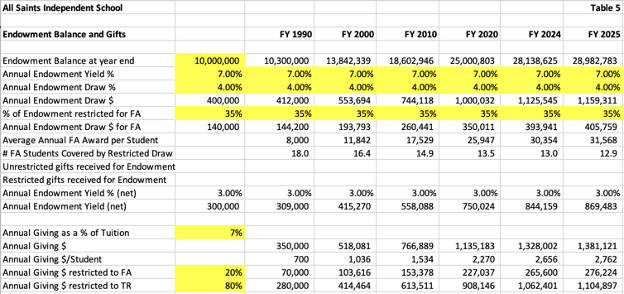
6. Endowment Balance and Gifts
During the 34-year period used for modeling purposes, many private schools increased their fundraising activities to replace and expand their physical plant, add capacity for students, add capacity for faculty, and cover increased expenses not passed through to families.
Table 5 below reflects the assumptions I made for the purposes of this analysis. I assumed that All Saints had an endowment balance at the beginning of FY 1990 of $10M, roughly two times its annual revenues. I assumed the annual endowment yield for the period was 7% and the annual endowment draw was 4% with a net yield of 3%.
As a result, the endowment increased by 2.8 times over the 34-year period, simply by effectively investing and being disciplined with the draw. I did not assume that any major gifts were received, adding to the balance.
I felt it was important to include an annual giving section in the analysis. I assumed the monies received each year would be 7% of gross tuition. Annual giving increased from $350,000 in FY 1990 to $1.3M in FY 2024.
I opted to allocate 20% of annual giving to restricted funds covering financial aid. This is a lower percentage than the 35% of restricted endowment balances. My reasoning is that development teams usually attempt to solicit unrestricted annual giving funds.
Observations
The article that triggered my business model review was about private school education in San Francisco. Given that the percentage of K-12 students attending private schools has increased in San Francisco, it’s unlikely that enrollments would have remained flat during the period in my analysis.
At the same time, increasing enrollments may have required funding an expansion of the school’s physical plant as well as faculty and staff. I felt like keeping enrollments flat allowed me to gain more insight into other components of revenues and expenses.
I don’t believe for a minute that holding the number of financial aid students constant, as well as the percentage of aid covered, is reasonable for the period, given that inflation-adjusted tuition increased 102% while inflation-adjusted family incomes increased 23%.
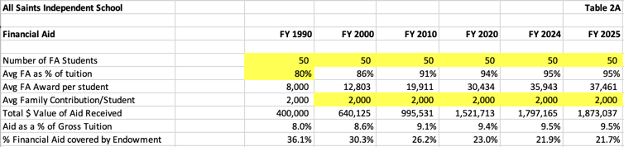
In Table 2a below, I opted to hold the number of financial aid students constant at 50 while keeping the annual family contribution flat at $2,000 per year. That change in assumptions increased the percentage of aid received by financial aid students over time from 80% to 95%. The annual increase in aid required reached approximately $280k in FY 2024.
The answer to the question of how to cover the increase in aid is complicated. Before I make suggestions, I want to review another change in assumptions.
The next area that I wanted to reassess was tuition remission. My first assumption was to keep it at 50% with no financial aid throughout the period. After reading that the inflation-adjusted tuition increased 102% versus an inflation-adjusted family income increase of 23%, I decided to keep the teacher/staff contribution amount flat at $5,000 per child per year.
That change could have been implemented by changing the remission amount every year (difficult to administer), by keeping the 50% remission with a financial aid component, or by switching tuition remission to financial aid only but guaranteeing the aid by not commingling the funds with the financial aid budget.
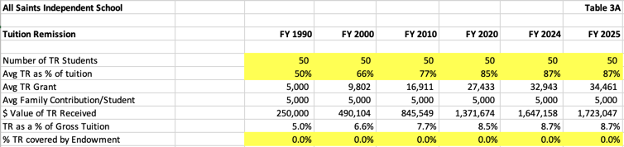
I opted not to determine what the change in policy could have been because I think that the inclusion of a guaranteed remission percentage of 25% or higher will attract employees whose spouses’ incomes may be high enough to preclude the awarding of financial aid. Nonetheless, Table 3A below illustrates what the combined remission plus aid percentage would be if the annual contribution per student is capped at $5,000 per student per year.
Maintaining the number of students receiving tuition remission at 50% with no financial aid would have been difficult with the nearly four-fold increase in tuition. At the same time, some faculty and staff could have resigned to work for private schools with a better tuition remission benefit. They could have possibly been replaced by faculty whose families had the means to pay 50% of tuition.
By maintaining the families’ contribution to $5,000 per student, the school’s annual tuition remission expense increased by $700k in FY 2024 from the base case scenario.
How Should Expense Increases Be Covered?
With a $280k annual increase in financial aid and a $700k annual increase in tuition remission benefit expense increasing the hypothetical discount percentage to 17%, how should All Saints cover those increased expenses?
Increasing tuition could be an option. However, if the $1M gap is covered with a tuition increase, you must consider covering the increase in tuition for the FA students and the TR students since the assumption was that the school would hold their annual contributions flat. FY 2024 tuition would have to be increased by 9% to cover the $1M.
Another solution to covering the funding gap is increasing the number of full-pay students. That would be an incremental 26 full-pay students using the FY 2024 tuition, assuming that there would be no incremental operating costs for the school because the students could be evenly distributed across the 13 grades. If the incremental costs are 50% of tuition, the number of additional full-pay students would have to double.
The school could decide to change the way in which financial aid is awarded and award aid to students whose families have higher incomes, increasing the average annual contribution of $2,000. However, making that change would depend on how many financial aid students are graduating or leaving. It’s not apt to happen quickly given the distribution of 50 financial aid students over 13 grades. If financial aid was only awarded in grades 9-12, it could occur quicker, but it’s still a slower solution.
All Saints could also change its tuition remission policy. Assuming faculty and staff children would be grandfathered at existing contribution percentages or dollars, that change would not occur quickly either.
All Saints could also decide to seek assistance from donors to cover the difference. If the gap were to be covered by raising restricted funds for the endowment, $25M would have to be raised to cover the $1M expense, assuming a 4% annual draw.
I think it would be more difficult for All Saints to raise the money through annual giving than raise it by increasing tuition. The annual giving amount collected would have to increase by approximately 80%, and counting on it continuing would be difficult.
Final Thoughts
As I mentioned in my January 3 article, independent schools do not have access to federal financial aid programs, and very few have access to state aid programs. I believe that the cost of private school tuition is close to the tipping point where the pressure for enrollments will increase, and schools facing steep competition will offer merit scholarships to attract a mostly full-pay student.
The 2021 NBOA study that I mentioned in that article indicated that the average discount rate was 18% in the FY 2020 school year. The study indicated that 81% of all discount dollars were used for need-based financial aid. Tuition remission benefits were 16% of discount dollars, and merit-based scholarships were 3%. My revised scenarios for financial aid and tuition remission increased All Saints’ discount rate to 17%, a number much closer to the national average in FY 2020.
My scenarios were derived to point out other items in the typical independent school business model beyond the usual explanation of faculty and staff wage increases. As mentioned, I could have increased the number of students receiving financial aid and decreased the number of faculty and staff students receiving tuition remission. I could have also increased the overall enrollment, but that would have added complexity (and perhaps capital requirements) to my attempt at a simple analysis.
The most notable point from Ms. Huang’s article was that tuition increased at a much higher inflation-adjusted rate than family incomes. She attributes the higher increases in tuition to faculty and staff expenses. I know that is not the real explanation. There are some combinations of wage increases, faculty and staff increases, financial aid increases, merit scholarship increases, and tuition remission increases that result in higher tuition increases.
There are many options to adjust the business model when there is high demand from families who can afford to pay the tuition. For those few independent schools serving markets where there is still a surplus of high-income families, treasure your good fortune. For all others, be sure you understand the economics of all the components before you commit to spending resources that may not be recoverable through tuition increases or enrollment growth.