Many years ago, I was fortunate to attend a private school in Maryland. After I graduated from college, I served as a member of the school’s alumni association board and as a trustee of the school.
In 2021, I published a five-part series of articles about my work for the school under the title A Private School Finance Primer. During a recent discussion with a friend, he suggested I expand my discussion about enrollment planning in A Private School Finance Primer – Part II. I’ll begin with a discussion about tuition.
The Role of Tuition in School Market Position
It doesn’t take an advanced degree to realize that gross tuition revenues are calculated by multiplying the number of students enrolled by the tuition charged. If you asked the classic question “what comes first, the chicken or the egg,” my vote would go to “tuition” and not “students enrolled.”
Tuition establishes an independent school’s position in the marketplace. In a typical market, each school may have its uniquely priced tuition based on its perceived position in the broader private school group or subset of a group.
Unaffiliated independent schools don’t discuss tuition with each other for obvious (antitrust) reasons. It doesn’t mean that they can’t and shouldn’t know what their direct competition is charging though.
Table 1 below is a representative comparison of tuition at 10 fictional independent schools in a specific market area. There’s no magic number for how many schools to include. The schools listed should be the ones that your school’s leadership team believes are its competitors for student enrollments.

The table lists the schools and two consecutive periods (years) of enrollments (usually obtained each year from the schools’ websites). It also calculates the change in enrollments from one period to the next (in this case, two consecutive years). The table also provides the number of price levels and the current year’s published pricing by level (I used the most popular grade groupings for pricing). Lastly, the table provides the change in pricing from the lowest tuition to the highest.
I highlighted Leader School as the home school. The reader of the table can compare Leader School’s total enrollment and tuition pricing compared to the other schools as well as the median of the schools. I note that Leader has the second highest enrollment among these schools and its tuition is below the median at all levels. The median enrollment of NAIS schools nationwide is 638, very close to my example.
Whether lower tuition has boosted Leader’s enrollments is an observation that the school’s leadership team should be able to make. Should Leader increase its tuition to close the gap between it and the highest enrollment school, Rider School? That is a worthy discussion point during budgeting or strategy meetings.
As a former independent school parent, I believe that it’s always important to look at tuition pricing from the perspective of the parent. Table 2 below illustrates the impact of tuition increases at Leader with its Pre-K to 12th grade student population. The model begins with the tuition by level for the previous year. It inflates last year’s tuition for the budget/current year, and provides an opportunity to increase tuition year-by-year for the next 14 years.
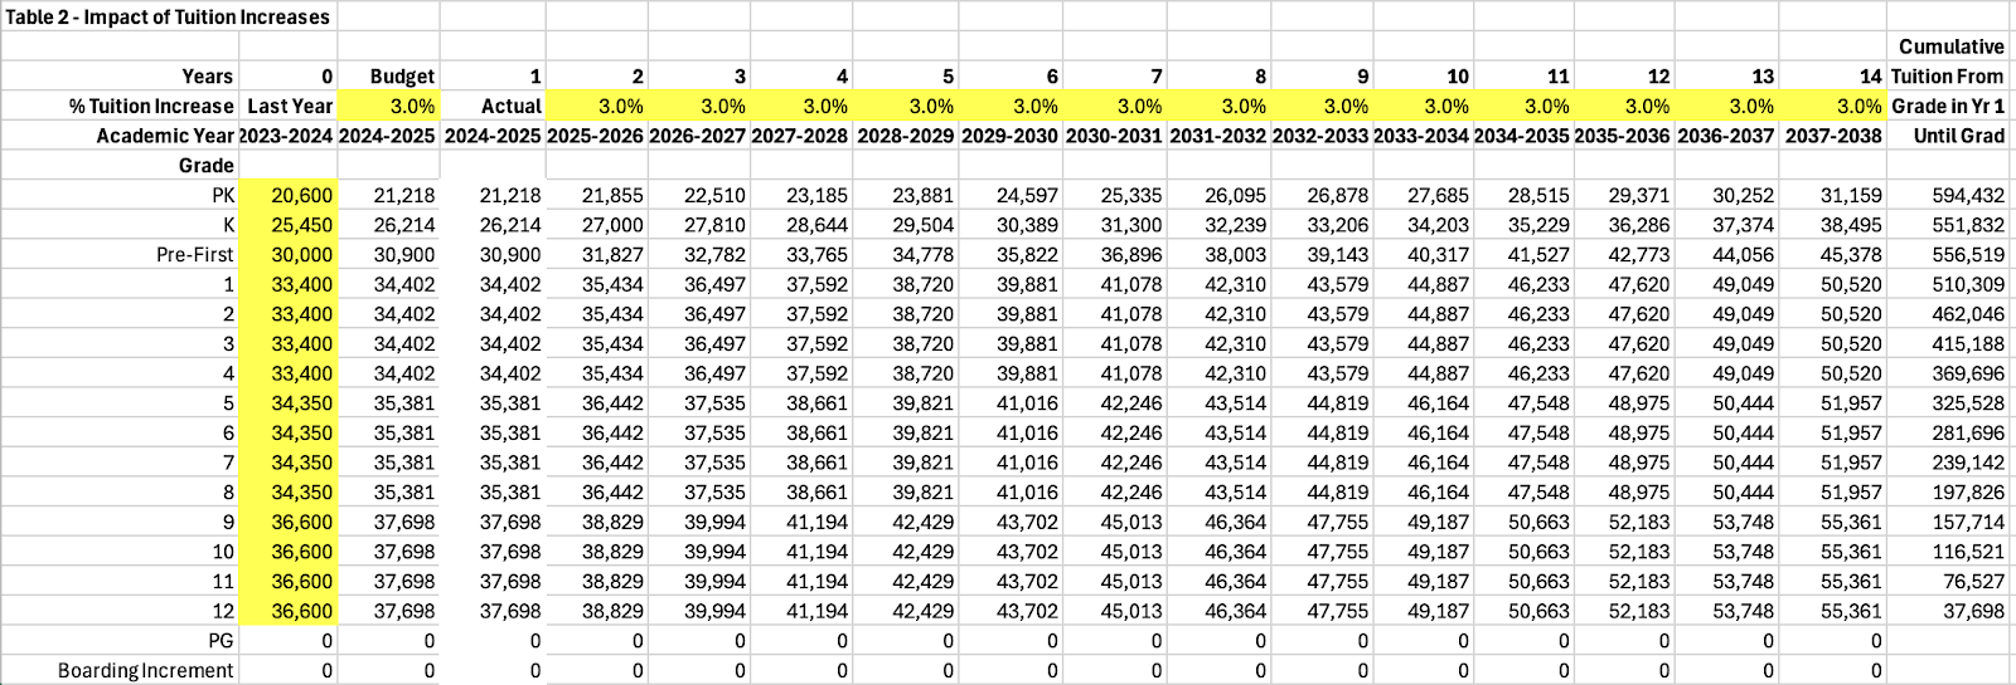
Table 2 allows an administrator or Board member to look at where tuition will be at any increment over a projected period. That period could be two years, four years, six years, etc. It also calculates what a parent would pay over a period from their child’s grade this year until they graduate.
For a new Pre-K student, their parents can expect to pay $594,432 if their child attends until graduation. For a new 9th grade student, their parents can expect to pay $157,714 if their child attends until graduation. These numbers are dependent upon tuition increases averaging 3% per year.
These assumptions can easily be modified to a higher or lower percentage. An important point to remember is that most tuition dollars are paid from after tax income. The higher the tuition, the higher the income required for parents to be able to afford to pay it.
Given the substantial sum required to send a child to private school from PK through 12th, should the school’s leadership team and board look at various entry points to the school as strategic decisions by members of the community regarding how much money they can afford or choose to spend? It could make a big difference if they identified those parent profiles before their competition does.
Table 2 was built to include a Post-Graduate (PG) year and a Boarding Increment for Boarding students. Leader has neither, so the rows are blank.
I believe that school leadership teams and boards set tuition increases based on an overall revenue target. After reviewing tuition, that leads to a discussion about enrollment. Later, I will return to tuition.
Board-Level Analysis of Enrollment at Leader School
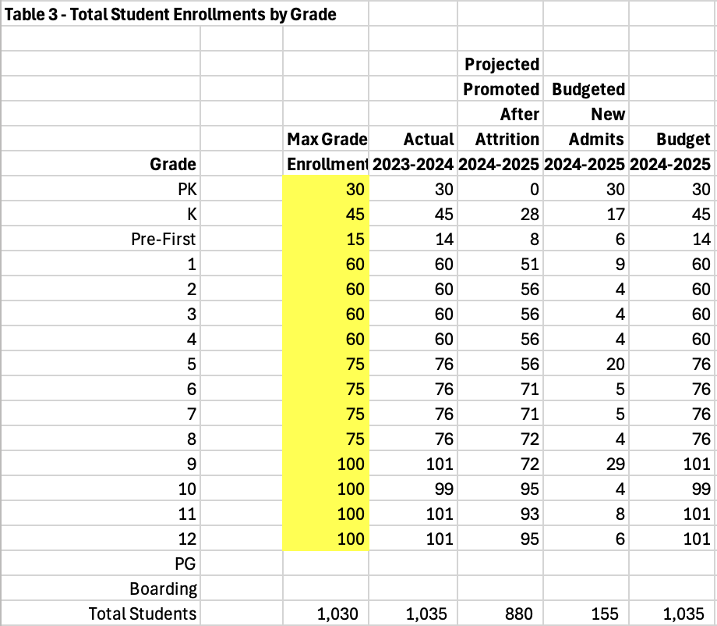
I like to look at enrollment from the perspective of a board member who receives the occasional snapshot of student enrollment at the beginning of the school year. Table 3 below provides that snapshot for the school year just completed at Leader School.
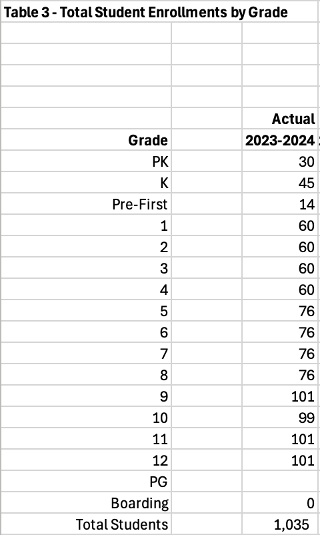
How are we doing at Leader School, a board member might ask? Are we at capacity? Do we have room for enrollment expansion? What can you tell me?
Most independent schools operate traditional campuses with a fixed cost operating model. Leader School is no exception. Leader does not enroll online students. Hypothetically working with Leader’s Director of Admissions, I added a column for Table 3 titled Max Grade Enrollment. See expanded Table 3 below. New numbers inputted are highlighted in yellow.
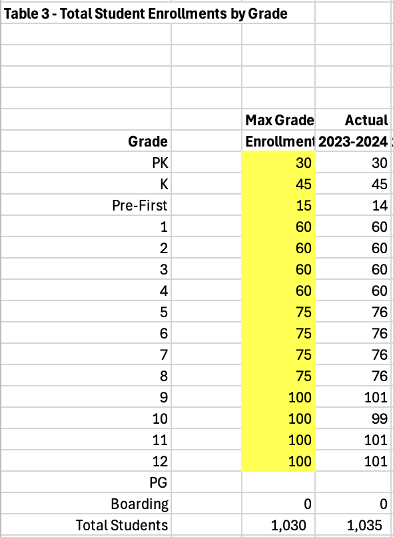
Max Grade Enrollment was calculated several ways. In the Lower School (PK through 4), it’s based on the number of physical classrooms available to host 15 student sections. Reviewing the numbers, you can see that there are 2 sections in PK, 3 in K, and 4 sections in 1st through 4th grades.
In the Middle School, Leader adds a section of 15 students. It should be noted that the Middle School doesn’t operate the same way as the Lower School. In the Middle School, students change classrooms during the school day. The Middle School capacity per grade is 75. In the Upper School, an expansion of enrollment occurs in 9th grade to 100 students.
Comparing the Actual enrollment for FY 24, the school exceeded its theoretical Max Grade Enrollment. The school can take the approach that the Max number can be flexible or absolute. For example, a flexible definition would allow each grade in the Lower School to add 1 to 2 students per section..
The same applies to Middle and Upper Schools.
Never “adjust” the Max Grade Enrollment without comparing it to this year’s actual enrollment by grade. Any adjustments should be included in the plan for next year’s budgeted enrollment. The Max Grade Enrollment is designed to be a reminder that growth can only go so far before additional costs are required.
Budgeted enrollment is straightforward if all students are full-pay (FP) students. However, Leader has a financial aid program that awards needs-based financial aid (FA) to students beginning in the 5th grade. There are no merit-based financial aid awards. Leader targets awards to 5% of 5th and 6th grade students and 10% of 7th – 12th grade students.
Leader also has a tuition remission (TR) program for children of employees. That program is need-based. Employee children are eligible for tuition remission, beginning in kindergarten. Leader targets TR awards to 5% of grades K through 12th.
Full-Pay Enrollment
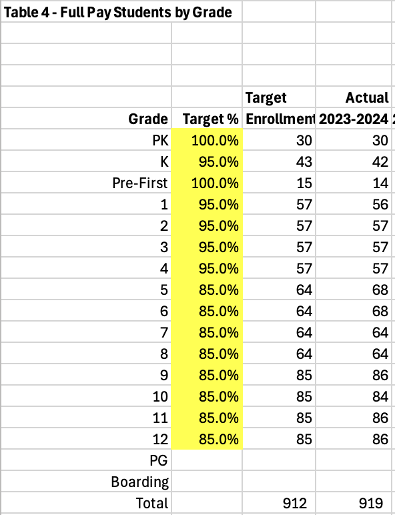
Based on the above parameters, I built a table for budgeting Full-Pay students. That requires breaking out this year’s actual student enrollments by pay type by grade. In Table 4 below, I added a Target % enrollment for FP students by grade. The model calculated the Target Enrollment by grade. This enables the reader to compare it to Actual FP Enrollment.
Leader’s FP enrollment in FY 24 went well. Leader exceeded its targeted FP enrollment by 7 students, primarily in Middle School (5th and 6th grades).
Financial Aid Enrollment
Leader has some endowment funds earmarked for Financial Aid, but most of the funding is through school operations (also known as a tuition discount). School leadership has determined that the greatest need for financial aid is in 7th through 12th grades (also enrollment expansion grades).
Leader has targeted 10% of enrollment in those grades for FA students. According to NAIS, the median percentage of enrolled students using financial aid is 20.5%.
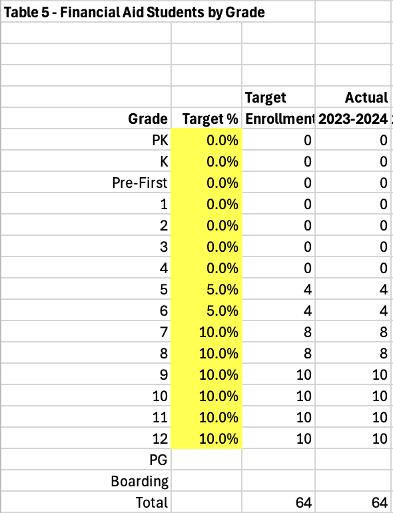
Additional expansion grades are in 5th and 6th grades. Leader has targeted 5% FA students in those grades. Table 5 below shows the target enrollment by grade as well as the actual FA enrollment for FY 24. As you can see, Leader awards financial aid until the budgeted funds are exhausted. Each grade met its target.
Leader School’s Evolving Tuition Remission Program
Leader has had a tuition remission program for many years. In the 1990’s, Leader’s Board of Trustees was concerned that the program was too generous. All eligible employee children were able to receive an 80% tuition discount. Some trustees believe the benefit attracted some full-pay parents to apply for jobs solely to receive the discount.
The outcome of a multi-year study concluded that the program should be needs-based only. A transition plan was implemented and 25 years later, only students with financial need receive tuition remission. Since then, the percentage of students awarded tuition remission has held steady at about 5%. According to NAIS, the national average is 4.8%.
Leader’s senior leadership team has mentioned the possibility of re-instituting a guaranteed percentage like the previous plan. The Board has tabled current discussion of that idea given the school’s experience. It’s likely to resurface as part of an overall employee compensation strategy. The model could be used to project the impact.
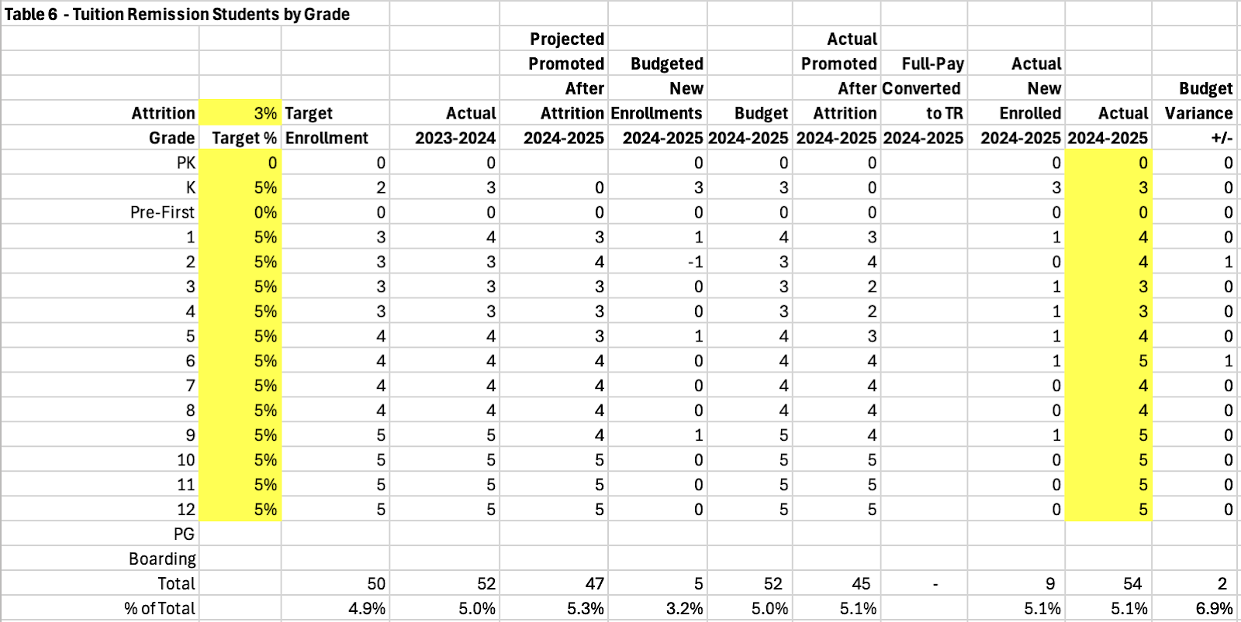
Table 6 below illustrates the targeted tuition remission students compared to the actual.
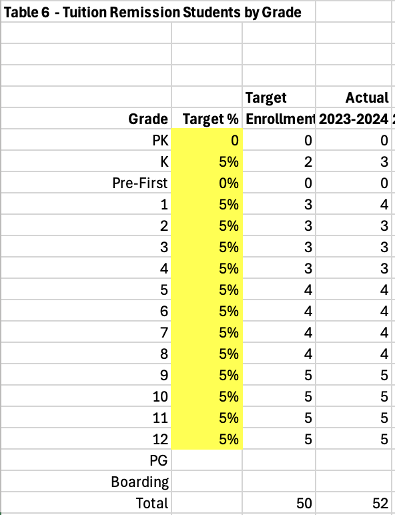
As you can see, the actual number versus the target number is close. It is very tough to predict how many employee children will be eligible. It is tough to predict what grades children of new hires will enter.. Leader’s number has been stable since the transition period for the former plan ended and financial need only is the determinant for TR.
Projecting Enrollment: Balancing Retention and New Admits
There are tables for each of the three student pay types. Table 3 – Total Enrollments by Grade becomes a summary of Table 4 (FP), Table 5 (FA), and Table 6 (TR).
The first step to build a budget for the following year is to “promote” the existing students to the next grade and “graduate” the senior class. It’s unusual for a school to not have student attrition from one year to the next. Students can move out of the area, decide to transfer to another school, or decide to return to public school. Attrition needs to be built into the formula that “promotes” students.
At Leader, attrition varies by pay type. Full-pay students have a higher attrition rate than tuition remission students. Tuition remission students have a higher attrition rate than financial aid students. Each table allows for a unique attrition percentage. The full-pay attrition rate budgeted at Leader is 7% which approximates the NAIS-published national median of 7.05%.
Once a returning student population is determined for each grade, the model calculates budgeted new admits for each grade. Net promoted students are subtracted from the current year (FY 24) actual to calculate budgeted new admits. You could also subtract the net promoted students from the target enrollment or override the calculation and insert a target for each grade.
The budgeted enrollment by grade is calculated by adding the net promoted students to the budgeted new admit students. As previously mentioned, budgeted new admit students could be calculated based on several factors.
With Leader, there is a nuance with the full-pay students promoted from Kindergarten to 1st grade. Usually, approximately 20% of the Kindergarten FP students are recommended for a pre-first year. The model “promotes” 20% of the FP Kindergarten students to Pre-First and “promotes” the rest to 1st grade. The 1st grade population comprises the promoted 80% of Kindergarteners plus the promoted Pre-First students.
You can see how the K to Pre-First transition works out in Table 4 below because it “forces” a larger number of budgeted new admits in 1st grade (to replace the students going to Pre-First) than in 2nd, 3rd, and 4th. Schools without a Pre-First might choose to repeat a student in Kindergarten or advise the student to transfer.
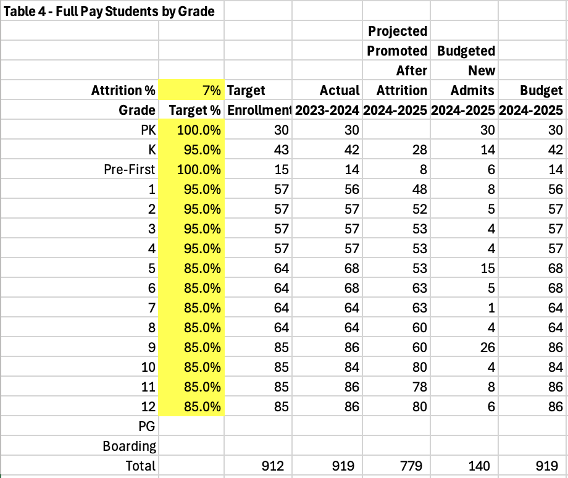
When the model “promotes” the existing students, you get an idea of how many students must be enrolled next year by grade. The entry and expansion grades (Pre-K, K, 1st, 5th, and 9th) show a higher expected target. Many independent schools rarely admit new students as 12th graders. This number is likely to be adjusted by the Director of Admissions.
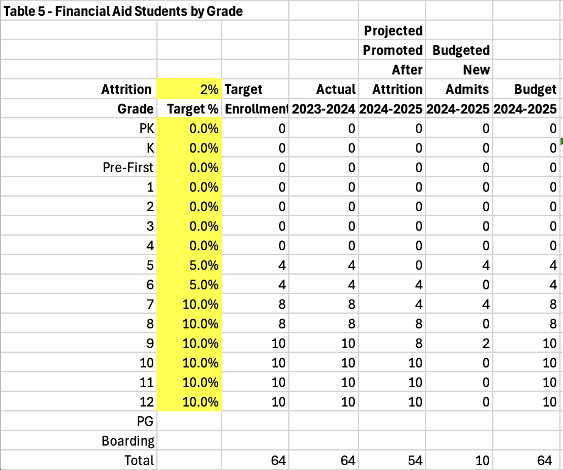
Leader’s Financial Aid budget is built similarly. As previously mentioned, there are no FA students until 5th grade. Table 5 below illustrates a conundrum when dealing with a few students for each grade. With a 2% historical attrition rate, there are no FA students leaving. The number of budgeted new admits equals the FA students graduating.
In this case, the Director of Admissions should adjust the calculated net promoted total for each grade. Ideally, that adjustment is based on any FA students that he/she knows are leaving. The budgeted new admits column would adjust automatically.
Tuition remission students by grade are promoted the same way as FP and FA students in Table 6 below. Given the smaller number of students, the Director of Admissions is better qualified to “adjust” both the net promoted column by grade. He/she may determine the budgeted new admits based on known new hires.
The model calculated a “negative” new admit which must be overwritten. I left it as an example of what happens with formulas and why the smaller the dataset, the more likely manual intervention is required. Remember to keep a master copy of the model to recover formulas in overwritten cells.
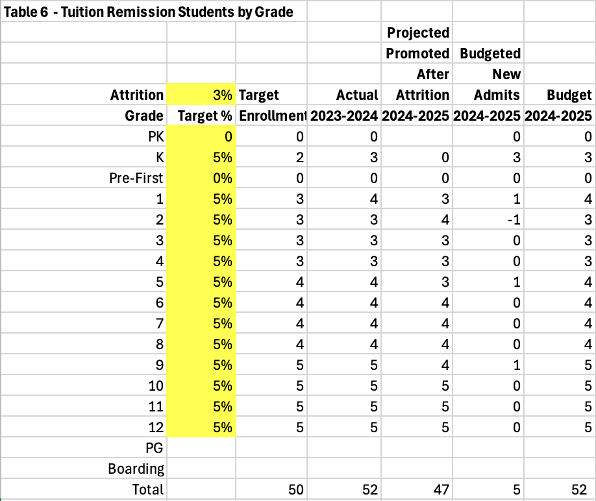
Table 3 below is expanded to summarize the calculations from each of these tables. It provides an excellent overview, beginning with this year’s enrollment by grade that totals 1,035. Next year, we project 880 returning students. To achieve the same enrollment as FY 24, we will have to enroll 155 new admits.
Budgeting Tuition Revenues
The model has calculated Leader School’s budgeted enrollment by grade for FY 25. Gross budgeted tuition is calculated by multiplying the budgeted tuition rates in Table 2 by the Enrollment by Grade in Table 3. The budgeted revenues by grade are included in Table 7 below. Unfunded TR and FA are required to be deducted from gross revenues as a discount and not included as an expense.
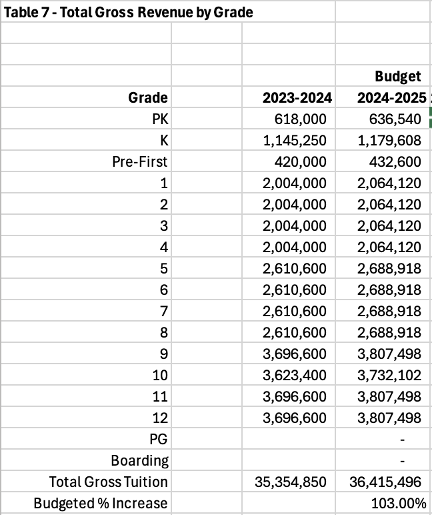
The budgeted % increase cell is a calculation and is a check calculation to see if it matches the budgeted % factor in Table 2, which it does.
With an interactive model, senior leadership teams can change projected enrollment or percentage of tuition increase. They can share the calculated impact of any changes to gross tuition with the board.
Managing Enrollment Growth in Independent Schools
Leader is a fictional independent school. Its total enrollment over 1,000 is larger than average. I believe the model illustrated can be adopted for any independent school and that the assumptions discussed apply to all.
There are nuances in any independent school market by grade and by population (substitute for pay type). Some schools may choose not to educate children through the entire Pre-K to 12 continuum. Others may have boarding students, and some may have a PG program.
Grades where the local market offers expansion opportunities may differ from the market where Leader is based.
Not all schools can increase overall enrollment by grade as Leader has done. Some schools may have physical plant limitations. Other schools may not be able to afford expansion.
In the primer I published in 2021, I discussed how the addition of a kindergarten grade influenced the expansion of the school. The size of the new grade created expansions of each subsequent grade when those students were promoted. Fortunately, the school had the land to expand and the resources to fund the expansion of classrooms throughout the school.
The section that follows begins with a discussion of the Admissions and Enrollment Funnel and adds columns to the existing tables as well as new tables to track the actual enrollment data for FY 25, discuss the outcomes, and compare it to budget and the FY 24 actual.
Forecasting Enrollment Earlier in the Budget Cycle
In the previous section, I stepped through the process of building a gross tuition revenues budget for a private school by analyzing and setting a tuition increase, projecting the number of returning students by grade and pay type, and setting a new enrollment target by grade and pay type.
Ultimately, the new total enrollment targets by grade were multiplied by the tuition for each grade to calculate budgeted gross tuition revenue by grade and total budgeted gross tuition revenue.
Many private schools do not complete their school budget for the next year until the admissions season is well underway. With an enrollment model, I believe it is practical and advisable to project a targeted enrollment for the following year at the beginning of the current school year before prospective students and their families visit the school.
Experienced admissions directors track their inquiries, requests for applications, applications, admits, and enrollments. That data is usually reported to the board when enrollments for the current school year are achieved. Based on my experience, it is seldom used to project the following year’s enrollment.
I created an admission and enrollment funnel by grade and pay type for the model. It is possible for savvy school leaders to reverse engineer the funnel and determine how many applications are needed to meet a specific enrollment target. I created an example of what a table might look like and appended it in the total students admitted by grade section.
Tracking Enrollment by Pay Type: Funnel Analysis
Like the budget model, the overall admissions and enrollment funnel table summarizes the admissions and enrollment data (actual). There are separate tables for full-pay (FP), financial aid (FA), and tuition remission (TR) students. I created a table naming convention that uses the numeral from the budget table and appends the letter A for each of the funnel tables.
Table 4A (below) represents the final FP admissions and enrollment funnel for FY 25. The data in this table was tweaked from a school similar in size to Leader School to provide a realistic scenario.
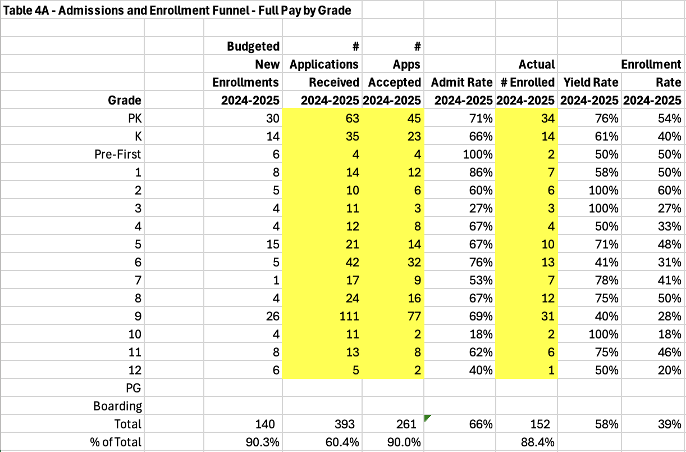
There are a few notable data points in the table above. First, the number of applications received for FP students is a robust number compared to the number of new FP enrollments budgeted. It’s almost four times the targeted budget.
Next, the school accepted approximately two-thirds of the applications received. However, that percentage varies substantially from 18% for 10th grade to 100% for pre-first. My observation is the Director of Admissions is actively managing the number of admits based on seats available in each grade.
Leader School admitted 261 FP applicants (66%) out of the 393 that applied. 152 FP students of the 261 students admitted ultimately enrolled (58%) . The enrollment rate or matriculation rate is 39%.
The admit rate of 66% compares favorably to the NAIS reported national average of 64.1%. The yield rate of 58% is lower than the NAIS reported national average of 76.5%.
What’s striking about the lower yield rate is that it is heavily influenced by the yield for 9th grade students. The admit rate for 9th grade students was 69%, close to the overall admit rate. The yield rate of 40% was substantially less and lowered the overall yield rate because of the large number of admits (77). Based on the school’s higher yield in other grades, I suspect that one or more of Leader’s competitors offered tuition discounts to attract FP students in 9th grade.
The good news about the funnel data is that Leader exceeded their budgeted new FP enrollments by 12. I will discuss that later when I review the summary admissions and enrollment funnel.
Table 5A – Admissions and Enrollment Funnel – Financial Aid Students is appended below.
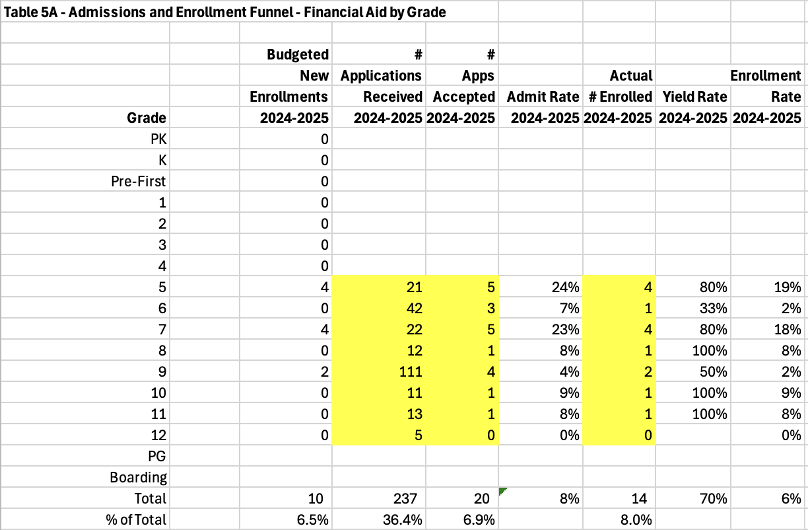
As stated earlier, financial aid student attrition is very low. Other than graduating financial aid students, the model did not budget for any financial aid students leaving school.
Even though Leader School does not provide financial aid for students until 5th grade, 237 applications were received (36.4% of all applications). Nearly half of those applications were received for 9th grade. Interestingly, 9th grade was the next to lowest yield rate for FA students at 50%. Given a similar situation for FP students, my suspicion of tuition discounting by a competitor school increases.
For schools in a market with heavy tuition discounting, they may want to track FA applicants that were not admitted because they did not qualify for financial aid. It’s my understanding that some schools reclassify those applications to FP if they accept the student without providing financial aid.
While 10 new FA enrollments were budgeted, the actual number of new FA enrollments totaled 14. The primary explanation for this was that 3 new FA enrollments replaced 3 unexpected FA students not returning.
Table 6A – Admissions and Enrollment Funnel – Tuition Remission by Grade is appended below.
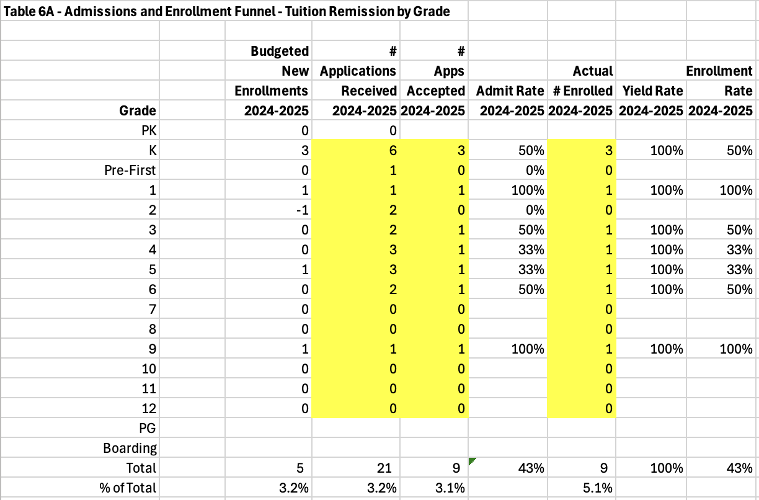
The tuition remission funnel illustrates several interesting insights. First, Leader School has a financial need only policy for TR. Second, the admit rate is only 43%. I suspect that the reason the rate is less than the FP admit rate is because several of the applicants did not receive any aid or the level of aid that they wanted to receive. 100% of those admitted enrolled.
I suspect that the enrollment funnel for tuition remission would look different if a minimum percentage of tuition was provided for all employee children that apply. If I were to modify this table, I would consider the same modification that I suggested for FA students, namely that applications that were turned down for aid but would have been accepted for FP be tracked.
Table 3A – Admissions and Enrollment Funnel – Total by Grade is appended below.
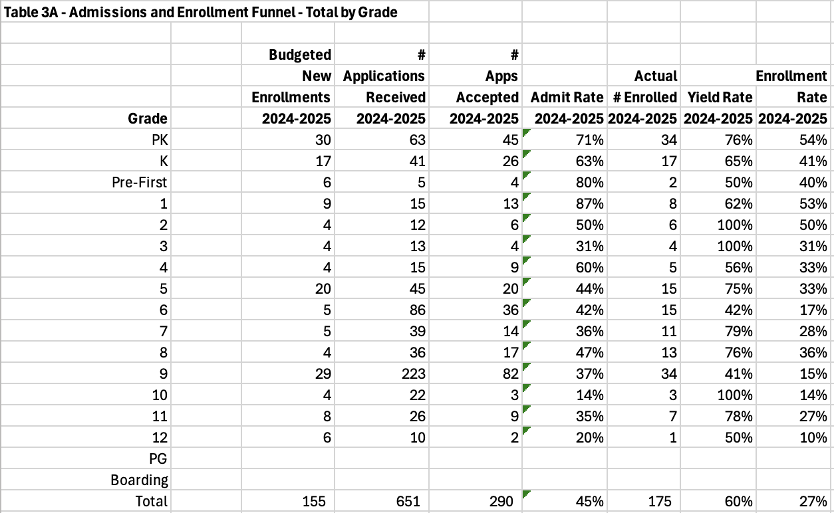
The summary admissions and enrollment funnel provides the evidence why funnels by pay type are necessary for a better understanding of the data. Leader’s overall admit rate was 45%, but that trend was low because FA applications represented 36.4% of all applications with an 8% admit rate. FP admit rates were 66%, an important number for a school dependent on tuition revenue.
The 6% enrollment rate for FA students also skewed the overall enrollment rate downward to 27%. Once again, the FP enrollment rate of 39% is much more important, and as stated before, is lower than the NAIS reported national average. Sixth and ninth grades appear to be grades to increase Leader’s enrollment management focus since the low admit rate didn’t sync with the low yield rate.
Earlier, I discussed the idea of reverse engineering the admissions and enrollment funnel to determine the additional number of applications that would be required to achieve an increased enrollment target. I created Table 3B and appended it below.
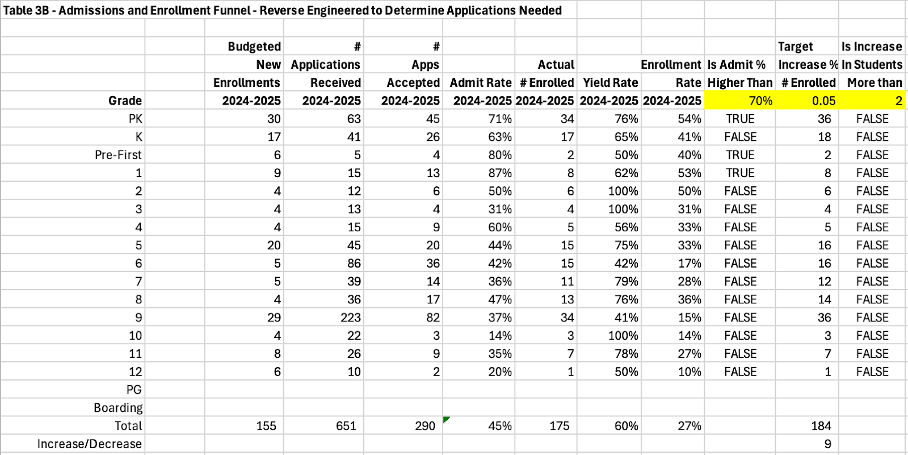
Although this table looks at Total Enrollments, something similar could be built for any of the pay types, including full-pay. As I reviewed the application data for Leader School, I screened for grades where the Admit% was greater than 70%. As you can see from the highlighted cell, you can insert any percentage.
There are only three grades where Leader admitted over 70% of applicants (calculated with a conditional formula). I then created a target increase column that calculates the target number of enrollments based on an increment of 5% (flexibility built in). The 5% increase would increase new enrollments to 184 versus this year’s budget of 155. I checked to see if the targeted increase exceeds 2 students in any grade. None are indicated.
The purpose of the reverse engineering was to see if the increase would require additional applications. There appear to be three grades where increasing the number of applications is a possibility if 70% is the correct threshold. The good news is that a 5% increase in new enrollments is not an outrageous number in any grade and only results in an increase of 9 students overall. That number could be misleading given that part of the explanation for the current year’s increase was a better than projected retention rate.
This is just one example of different ways that you can review the data to see if more applications should be solicited or if the existing application numbers are adequate.
Analyzing Leader’s Enrollment Success for FY 25
The admissions and enrollment funnels provide explanations and indications of Leader’s success in recruiting, admitting, and enrolling new students. To provide more detailed data on the overall enrollment picture for FY 25, the original enrollment tables (Tables 3, 4, 5, and 6) were expanded. I will review the summary table first and add commentary on each of the pay type tables separately.
Table 3 below stretches the number of columns by five. I’ll begin with the next to last column, Actual 2024-2025. This summarizes the pay type tables. The last column reveals that overall enrollment at Leader exceeded budget by 29. That variance was mostly evenly distributed by grade.
Actual New Enrollments 2024-2025 indicates that actual new enrollments of 175 exceeded budgeted new enrollments of 155 by 20. What accounts for the difference of +9 students?
I calculated an Actual Promoted After Attrition total by grade in the first column after Budget 2024-2025. The calculation subtracts actual new enrollments from actual total enrollments by grade. Leader budgeted 880 returning students and 889 returned. This total can be confirmed by a count of the enrollment agreements of returning students.
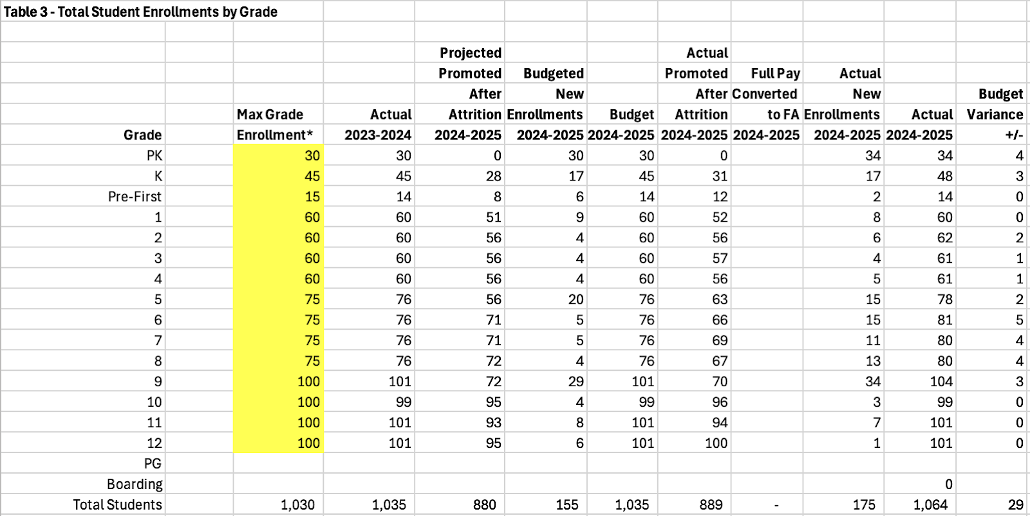
Table 4 – Full Pay Students by Grade is appended below. Leader beat its FP enrollment target by 26 students. Admissions provided 12 of those additional students with an actual new enrollment of 152 students versus a budgeted number of new students of 140.
Budgeting a conservative attrition percentage is critical. Leader’s budgeted percentage of 7% for FP students is less than the national average of 8.4%. Leader’s returning FP students exceeded budgeted FP returning students by 14. Imagine the consequences if it had been the other way around.
The FP variances by grade were evenly distributed. Only one grade, 11th, failed to meet the budget. No grade was positive by more than four 4 students. Part of the reason for low attrition could be Leader’s commitment to lower tuition than its peer group. The data shows there is some flexibility to add additional students beyond the Max Grade total.
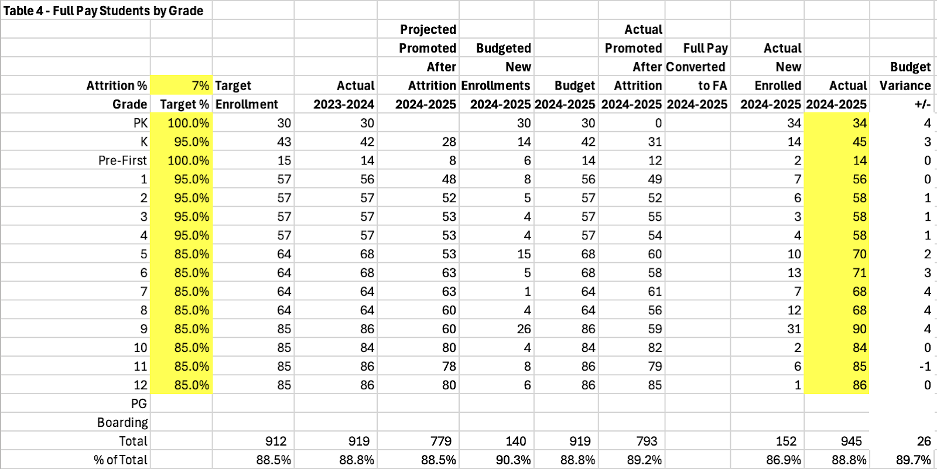
Table 5 – Financial Aid Students by Grade is appended below. As mentioned earlier, Leader does not have a significant endowment balance covering financial aid and most are financed through operations. To manage its financial aid costs, Leader only offers FA beginning in 5th grade.
Leader targeted 10 new FA enrollments and ended up enrolling 14. Three additional FA enrollments replaced unexpected departing FA students who left before graduation (51 actual promoted versus 54 projected promoted). Leader’s Director of Admissions may have been able to admit one more FA student based on the total FA dollars awarded.
Because Leader does not admit students who receive merit aid, it is not tracked in this model. However, any school with a significant amount of merit aid should change the model to track that separately from need-based FA awards.
The NAIS reported median percentage of students receiving FA is 20.5%. Leader’s percentage is 6.1%. Approximately half of that variance can be explained by limiting its FA students to the upper grades. The rest appears to be a careful measure of awards.
I included a column to track FP students who converted from FP the year before to FA this year. Many schools with larger FA enrollments will have several of these conversions each year. I did not build this into the Leader scenario but suggest that this statistic be tracked. I know a few private school board members who were unaware that this scenario could occur.
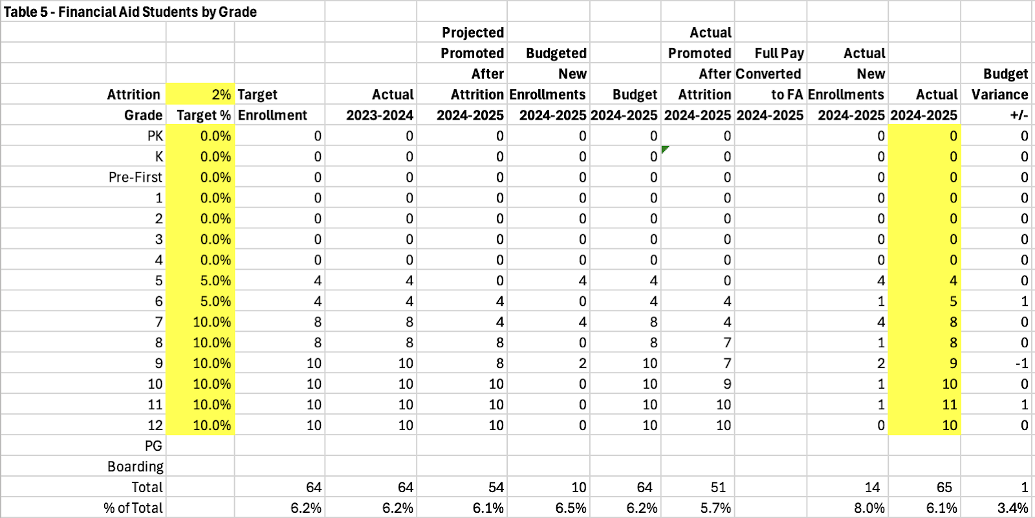
Table 6 – Tuition Remission Students by Grade is appended below. Interestingly, because the TR benefit begins in Kindergarten, the percentage of TR students at 5.1% is only 1% less than the percentage of FA students targeted at 10% for the eligible grades.
There is a budget variance of +2 TR students. New enrolled TR students exceeded budget by 4. That was offset by a negative attrition variance of 2 students.
I note the NAIS reported median TR percentage covered by schools is 50%. I don’t have a table that calculates the dollars covered by Leader for TR. However, its percentage of students receiving TR is 5.1% and the NAIS median % of TR students is 4.8% which Leader exceeds.
Actual Gross Tuition Revenues
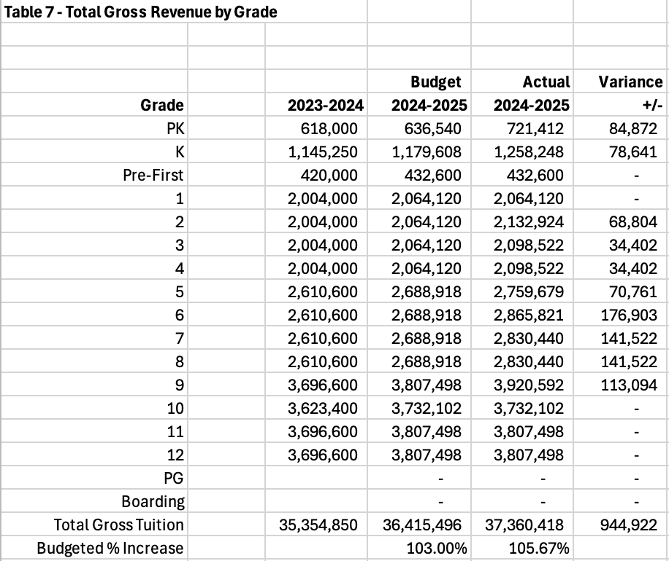
Table 7 was the last table built to calculate the budgeted gross tuition revenues. Now that actual enrollments are finalized, the actual gross tuition revenues can be calculated and compared to the budget. Table 7 is appended below. An actual column and a variance column have been added.
The actual gross tuition revenue exceeds budgeted gross revenues by $944,922. As noted previously, total actual enrollment exceeded the budget by 29. Total FP enrollment accounted for 26 of the 29-student positive variance.
Because the positive student variance is evenly distributed and heavily dependent on FP students, I expect that a disciplined leadership team could bank most of the excess revenues in a contingency or reserve fund.
Final Thoughts
As mentioned in the first section, the impetus for creating this Private School Enrollment Guide was a conversation with a colleague who had read Part II of my 2021 Private School Finance Primer. He knew the details built into my original model and thought I should share it.
I don’t believe the model is unnecessarily complicated or too into the weeds for a private school board member to review. The cost of education index for private schools has outpaced consumer income, like the higher education sector. Understanding tuition pricing and enrollment management is important to keeping private schools from the financial circumstances of many private colleges.
The model is designed to build a budget for next year based on the current year’s enrollment and tuition. It also tracks the actual enrollments by grade and pay type for the budget as the enrollments for “next year” are achieved.
There is no reason why the model cannot be used at the beginning of the new school year to set an enrollment target for a budget that will be approved before the admissions process is concluded. That would require making assumptions about increasing the admit rate or increasing the number of applications. It might also require a more nurturing management of the students admitted to increase the enrollment percentage.
Adding years and making “next year” the basis of a 5-10-year projection is easy. As you can see, there are more components that influence enrollments and gross revenues than many people consider. I can add a 5-10-year projection to the model, but would prefer to do it with data from an actual school and collaborate with people who carefully consider the assumptions.
Tuition discounting is a reality. I have written about private school tuition discounting including a lengthy article in January 2024. In that article, I reported that the most recent statistic regarding private school tuition discounting was published by the National Business Officers Association (NBOA) and the estimate was 18% for FY 2019-2020. As I finalized this article, I became aware of a more recent tuition discounting report issued by NBOA. The discount percentage does not appear to have increased from the previous report.
NAIS does not report a tuition discounting percentage. It reports the percentage of revenues dedicated to tuition remission, which was a median of 3.2% in its last reported year. Determining whether the gap between 18% and a more current higher number is for unfunded need-based aid or merit aid makes a big difference.
I suspect the 18% number is too low. I believe there are schools that choose to not report their tuition discount percentage. I also believe that there are markets where tuition discounting is more prevalent than others, particularly if there is a lot of competition for full-pay students.
No one wants the private school market to mirror the private college market in terms of their now widely used tuition discounting to attract students. I did not build a table to track it. However, Leadership teams and Boards should be aware of the discount percentage at their institution.
Schools that can reduce their percentage of tuition discounting should work to do so before they reach a tipping point like so many private colleges. I am glad to work with a private school to build a table that tracks tuition discounting and incorporates it into an Enrollment Management model like mine.
I believe that school leadership teams and private school board members can make better decisions when they understand the interrelationships between major components of their business models such as enrollment management. I hope this guide boosts their understanding of enrollment management.
Last, I want to reiterate a point that I made earlier. Schools and their boards should conduct a post-mortem on the previous year’s admissions and enrollment process and statistics as early in the new school year as possible. They should establish overall enrollment targets and targets by pay type and grade for the next school year well before the budget is approved. Monthly updates from Admissions are much more relevant when progress in numbers and ratios are compared to these targets.
Armed with these numbers, the admissions department can monitor the number and quality of applications throughout the process and hopefully avoid any negative surprises. A problem in higher ed was that family incomes did not increase as rapidly as tuition and fees at private colleges. We are likely at a similar point with traditional private school families.
Private schools that study the market and understand the admissions and enrollment process by grade and by pay type should have better enrollment outcomes than those schools that don’t. Private school board members should pay attention as well. Financial stability is one of the basics of fiduciary responsibility, a tenet of a trustee’s obligations.


