After updating my December 2025 and January 2026 reports on a few enrollment, operating, and financial statistics for private colleges in Maryland, Virginia, and Florida, I thought I should follow up with an update on Pennsylvania’s private colleges.
My original post about Pennsylvania private colleges was in January 2026, a week or two after my post about Florida’s private colleges. Pennsylvania has the largest number of private colleges and universities of any state that I’ve analyzed thus far. I compiled data about the 77 member colleges of the Association of Independent Colleges and Universities of Pennsylvania (AICUP) from the College Navigator website. I repeated that process for updating my data for this article.
Just as I excluded data from Full Sail University, Keiser University, and the University of Miami from the Florida mean, median, high, and low statistics, I excluded data from five Pennsylvania private universities. These are Carnegie Mellon University, Grove City College, Haverford College, Swarthmore College, and the University of Pennsylvania. Four of these institutions were excluded based on their admissions selectivity and endowment balances. Grove City College was excluded because it does not participate in the federal Title IV program funding financial aid.
Enrollment
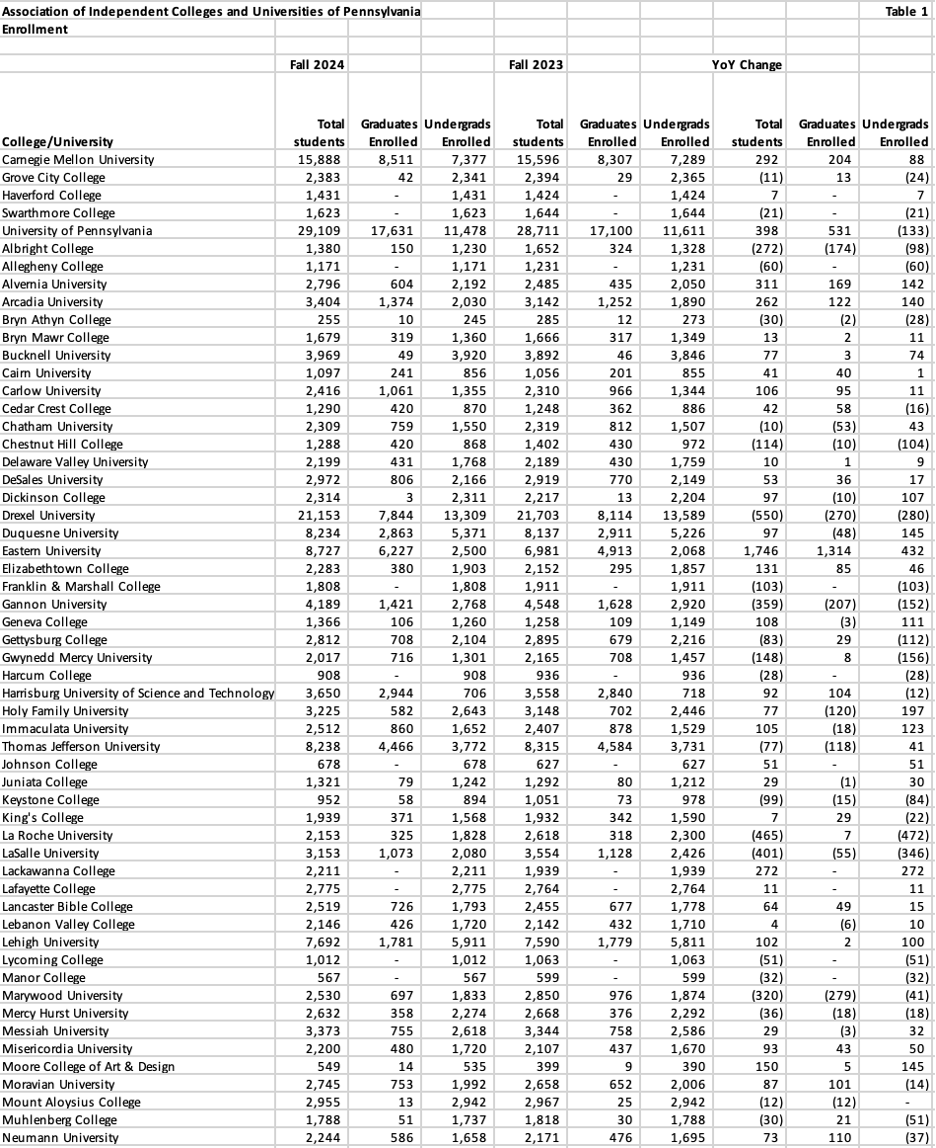
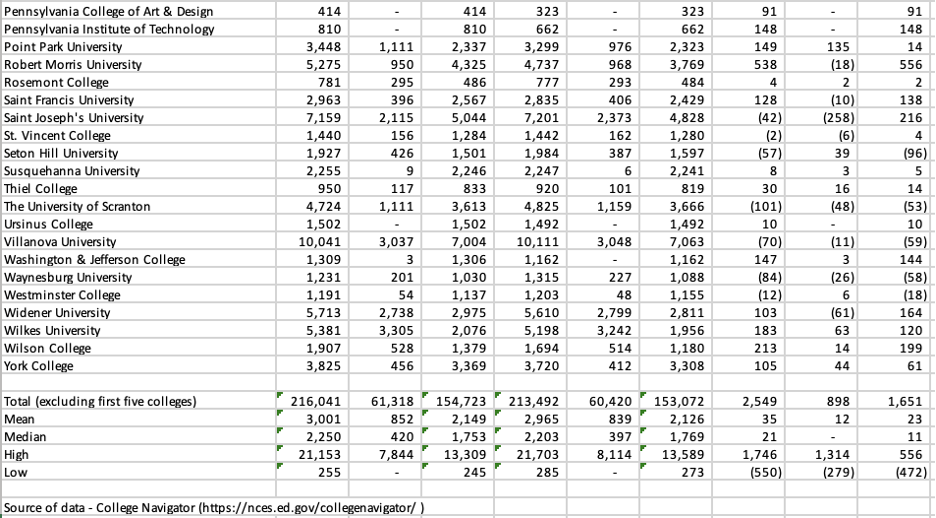
I listed the AICUP member institutions and their enrollment totals for undergraduate and graduate students in Table 1 below. The first set of three columns represents Fall 2024 enrollments, the current data provided by College Navigator. The second set of three columns represents Fall 2023 enrollments, the data available as of 1/26, when I published my previous article.
The 72 colleges and universities (excluding the five mentioned above) saw their aggregate enrollments increase by 2,549 year-over-year, with most of that increase attributable to an aggregate gain of 1,651 undergraduates on a total undergraduate enrollment of 154,723 (an approximate change of 1%). The aggregate number of grad students enrolled increased by 898. The mean change in total students for the group was an average increase of 35 students versus a median increase of 21 students.
Individual colleges varied widely, with the highest total enrollment gain at Eastern University (+1,746 students) followed by Robert Morris University (+538 students), Alvernia University (+311 students), Lackawanna College (+272 students), and Arcadia University (+262 students).
Drexel University experienced the greatest decline in enrollment (-550 students), followed by LaRoche University (-465 students), LaSalle University (-401 students), Gannon University (-359 students), Marywood University (-320 students), and Albright College (-272 students).
There are 18 private colleges in Pennsylvania with fewer than 10 graduate student enrollments. These 18 do not include Haverford and Swarthmore, which are in the five excluded institutions. These 18 institutions represent 25% of the 72-member group. This is a higher percentage than the other states reviewed so far.
Admissions Selectivity
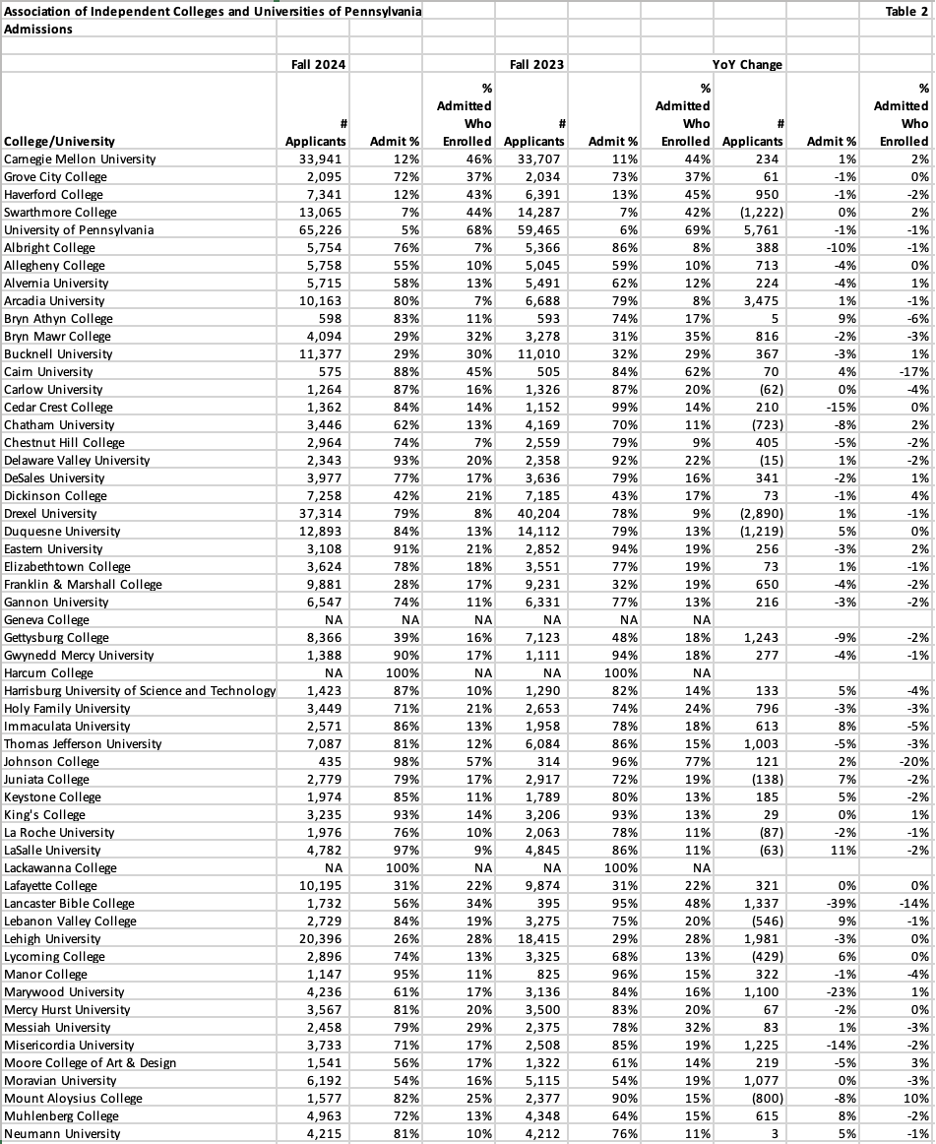
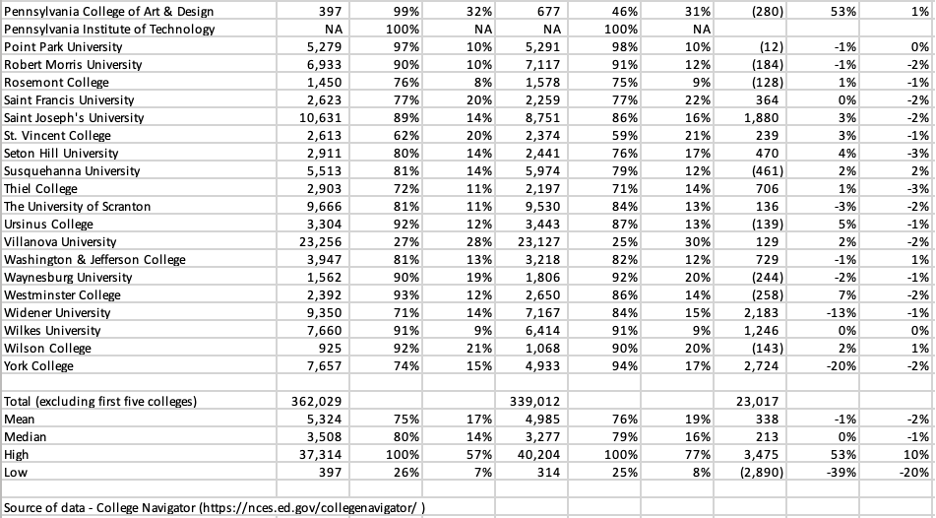
Table 2 below compares the change in application volume, the percentage of students admitted, and the percentage of admitted students who enrolled on a year-over-year basis (note that the most recent data is for Fall 2024, with data from two years ago).
The 6.8% increase in applications for the group of 72 did not affect their selectivity, with the mean acceptance rate of 75% declining by only 1 percentage point. The percentage of those admitted who enrolled decreased from 19% to 17% year over year. A major reason for this increase in applications with no reduction in acceptances can be explained by the forces identified by Geoff Baird and Teege Mettille in their book, The Signal Solution. Thanks to the Common App and direct admissions programs, applications are substantially up, and yield is down for most institutions since the Covid pandemic.
Greenstein wrote that “As acceptance rates rise, financial resilience collapses” and that the relationship is not linear but exponential. He added, “Beyond 50% acceptance, the decline becomes a free fall. By the time acceptance exceeds 75%, nearly 9 out of 10 institutions are considered high risk.” Only 19 of the 72 schools have an admit rate below 75%, and the group median is 79%.
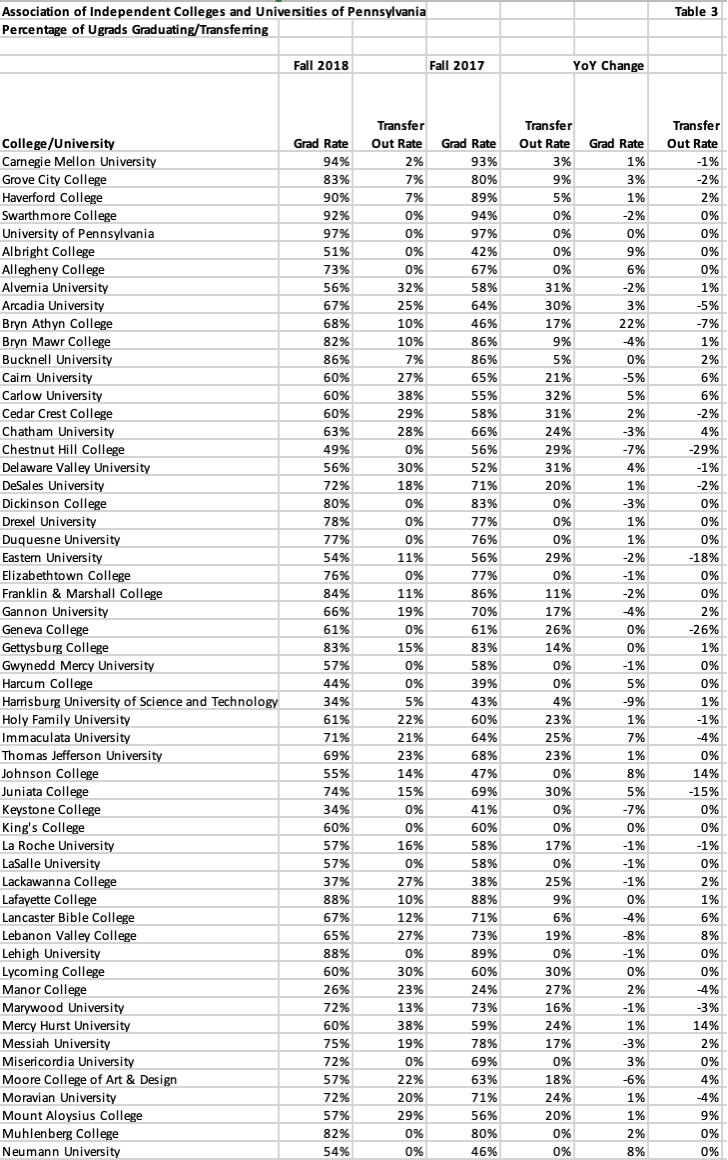
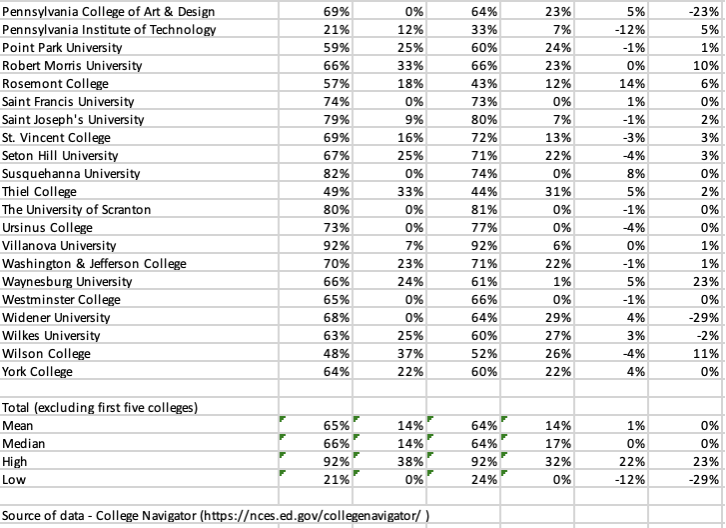
With low selectivity, the first thing that comes to mind is the percentage of students enrolling who graduate. Table 3 below illustrates the percentage of first-time, full-time undergraduates who graduated in six years, as well as the percentage of first-year students from that starting cohort who transferred out.
The group of 72 has a few colleges with what appear to be major swings, but the year-over-year change is not significant for the group. In the cases of a couple of colleges, the percentage is likely high because of enrollments below 1,000 students. It is important to note that the percentage of first-time, full-time students included in this calculation also varies widely by institution.
Because the most recent starting date was Fall 2018, any targeted improvements to increase the percentage of students graduating or reduce the percentage of students transferring out from that Fall 2017 cohort have not yet been disclosed. It is more than likely that the senior leadership teams at each of these institutions are aware of these trends and have processes in place to improve them. One institution, Bryn Athyn College, improved its graduation rate by 22%, but on a base of 255 total students. Widener University reduced its transfer rate by 29%, but all that reduction is because they did not report a transfer rate. The next-best improvement in a transfer rate that didn’t go to zero was Juniata College (total enrollment of 1,321), with a 15% improvement, going from 30% to 15%.
Graduate Student Enrollment and Tuition Revenues
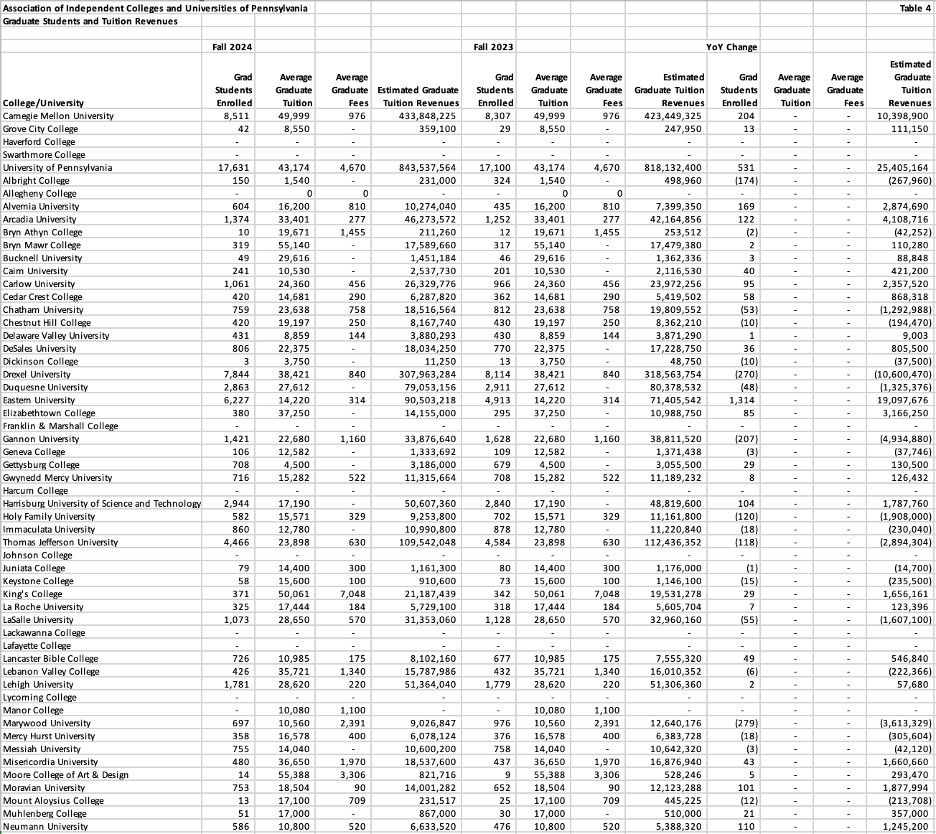
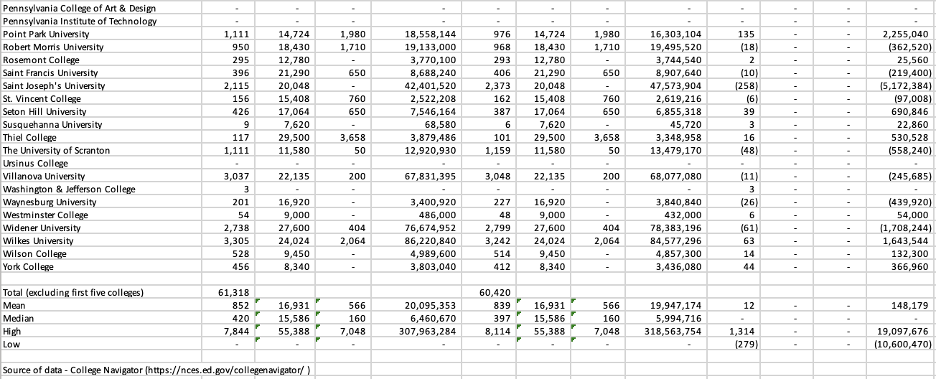
One important point to note is that most AICUP institutions have graduate student enrollments that generate incremental tuition revenue for the institution. Table 4 illustrates the year-over-year impact of increases or decreases in graduate tuition revenues for each institution. Note that the year-over-year comparative impact for average tuition per student and average graduate fees per student are zero because the Department of Education has not updated College Navigator’s tuition since November 30, 2025. The net change for the table, as currently displayed, only accounts for changes in enrollment based on the most recently published tuition.
Increases in grad student enrollment positively impacted Eastern University (+$19,097,676) based on its 1,314 increase in grad students. As a possible explanation for how a school could experience such a high one-year boost in grad students, 93% of Eastern’s graduate students attend 100% online. The next-highest graduate revenue increase occurred at Arcadia University, with a $4,108,716 increase. Approximately 40% of Arcadia’s graduate students attend 100% online.
Decreases in grad student enrollment negatively impacted Drexel University (-10,600,470), St.Joseph’sUniversity(-5,172,384), and Gannon University (-$4,934,880). Drexel and St. Joseph’s are in Philadelphia (perhaps a locale issue), and Gannon’s main campus is in Erie.
Tuition, Cost of Attendance, and Net Price
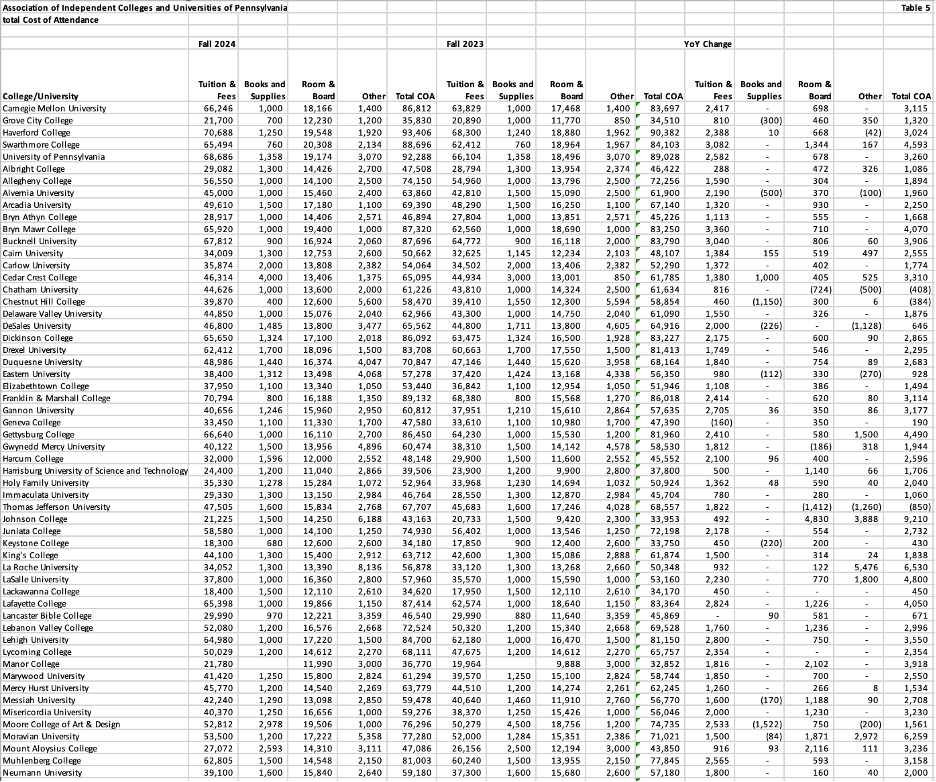
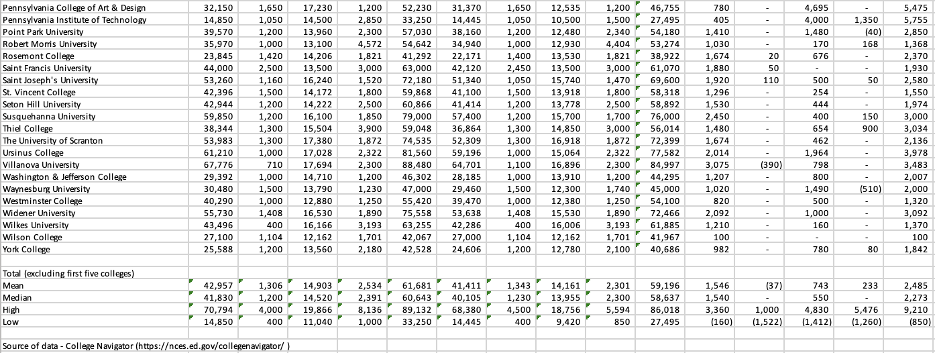
In Table 5, the major components of the published cost of attendance are listed for each institution for Fall 2024 and Fall 2023, the most recent published years in College Navigator. The year-over-year change is also calculated.
As usual, tuition is the largest component in the total cost of attendance. All institutions other than Chatham, Chestnut Hill, and Thomas Jefferson posted aggregate increases in Total Cost of Attendance, with tuition generally accounting for the largest single-dollar increase. Geneva College and Lancaster Bible College were the only institutions that held tuition flat. No institutions decreased tuition or total cost of attendance.
There are “groupings” of Total COA with the following institutions:
- Haverford College and the University of Pennsylvania—90,000-95,000
- Carnegie Mellon, Swarthmore, Bryn Mawr, Bucknell, Dickinson, Drexel, Franklin & Marshall, Gettysburg, Lafayette, Lehigh, Muhlenberg, Ursinus, and Villanova – 80,000-89,900
- Allegheny, Duquesne, Juniata, Lebanon Valley, Moore, Moravian, St. Joseph’s, Susquehanna, Scranton, and Widener—70,000-79,900
- Alvernia, Arcadia, Cedar Crest, Chatham, Delaware Valley, DeSales, Gannon, Gwynedd Mercy, Thomas Jefferson, King’s, Lycoming, Marywood, Mercyhurst, Saint Francis, Seton Hill, and Wilkes—60,000-69,900
- Cairn, Carlow, Chestnut Hill, Eastern, Elizabethtown, Holy Family, LaRoche, LaSalle, Messiah, Misericordia, Neumann, Pennsylvania College, Point Park, Robert Morris, St. Vincent, Thiel, and Westminster—50,500-59,500
- Albright, Bryn Athyn, Geneva, Harcum, Immaculata, Johnson, Lancaster Bible, Mt. Aloysius, Rosemont, Washington & Jefferson, Waynesburg, Wilson, and York—40,000-49,900
- Grove City, Harrisburg, Keystone, Lackawanna, Manor, and Pennsylvania Institute—33,250-39,900
Without a detailed analysis of admissions and marketing materials, as well as a demographic analysis of enrolling students, it is difficult to explain the differences in Total COA other than that they are likely based on “positioning” each institution to its targeted demographic group. Later, we’ll look at whether the grouping of “list price” institutions should be the same based on net prices (after tuition discounts).
There are the same number of groupings (seven) among the Pennsylvania and Florida private colleges as there were with the Virginia (six) and Maryland (five) private colleges. The low end of the groupings is approximately $7,000 less than the low end of the Maryland groupings, is approximately the same as the low end of the Virginia private colleges, and is approximately $5,000 more than the low end of the North Carolina private colleges.
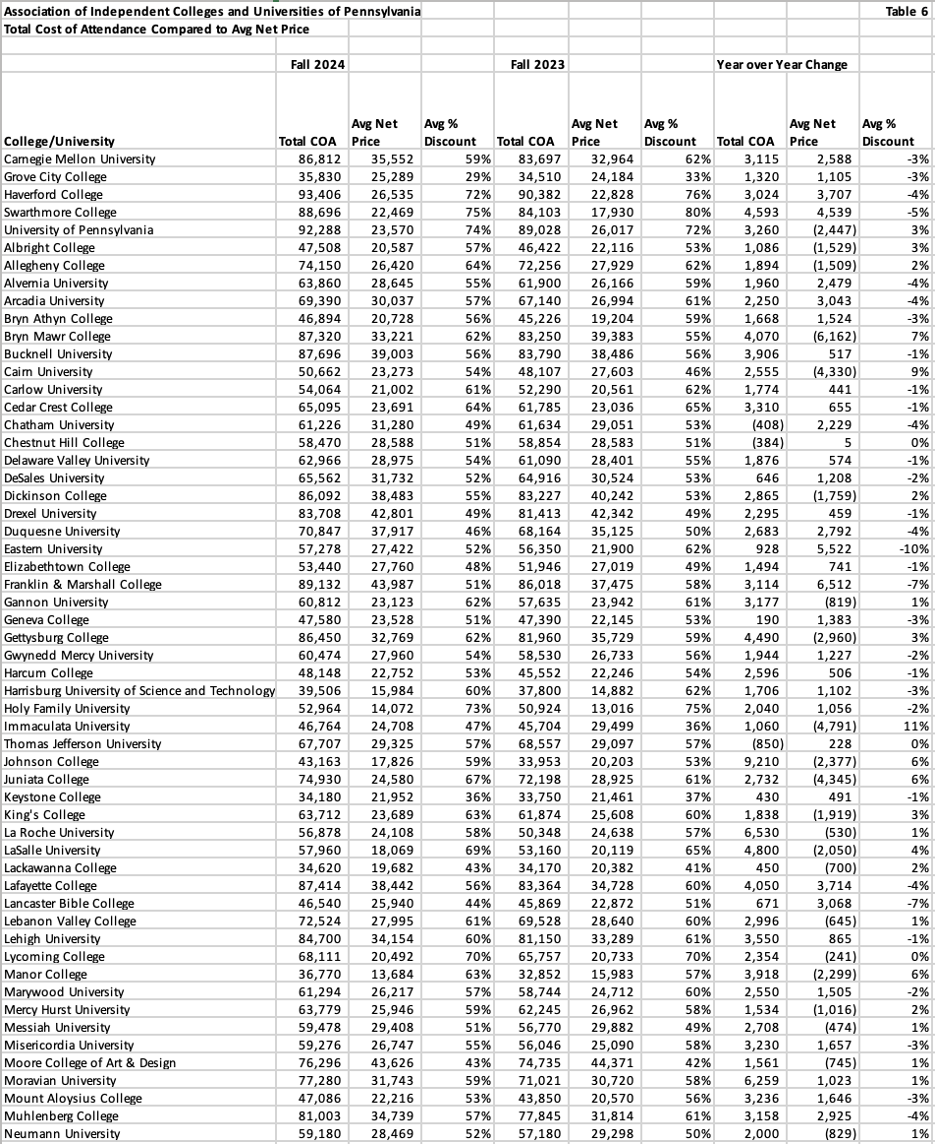
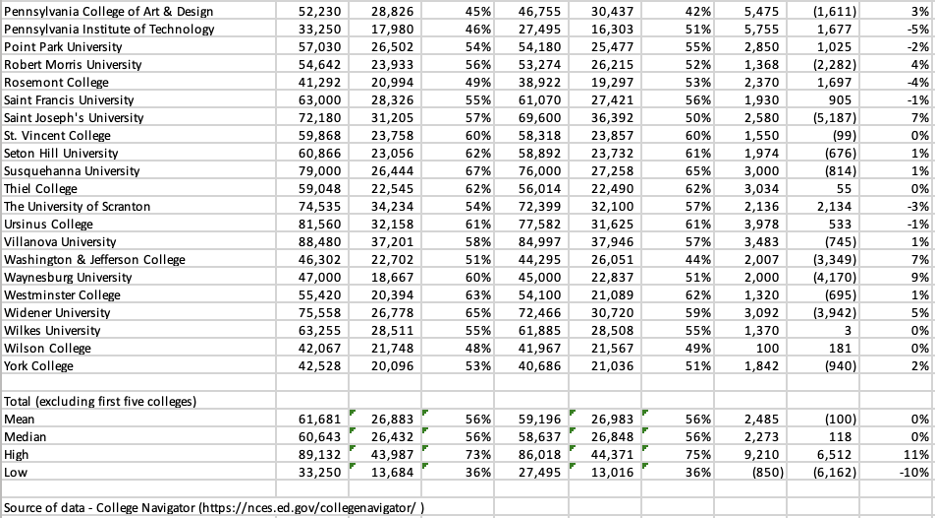
The published cost of attendance rarely matches the net price. Table 6 compares the total cost of attendance to the overall average net price and the average discount percentage for the last two years, along with the year-over-year change. Note that the average discount percentage is calculated as a percentage of the Total COA, not just tuition.
The median average net price for the group is $26,432 (this includes room and board and fees). The median average percentage discount for the group is 56%. The mean Total COA for the group increased by $2,485, while the mean average net price for the group decreased by $100. This implies that while the average “list prices” included in Total COA increased, the average discount increased more than the average list price. A negative change in average net price indicates that an institution is receiving less cash per student. There were 33 institutions with negative changes in average net price. Intuitively, that means those institutions received less cash from tuition, fees, and room-and-board revenues unless enrollments increased.
The average net price ranged from a low of $13,684 (Manor College) to a high of $43,987 (Franklin & Marshall University). Most of the net prices were in the $20,000 range, with four others besides Manor College in the under-$20,000 group. Overall, the average net price for Pennsylvania private colleges is approximately $300 lower than that of Maryland private colleges; obviously, they’re adjacent states with closely priced schools. Unless enrollments increase quickly, I don’t see how tuition-dependent private colleges with net prices below $20,000 will survive in the long run.
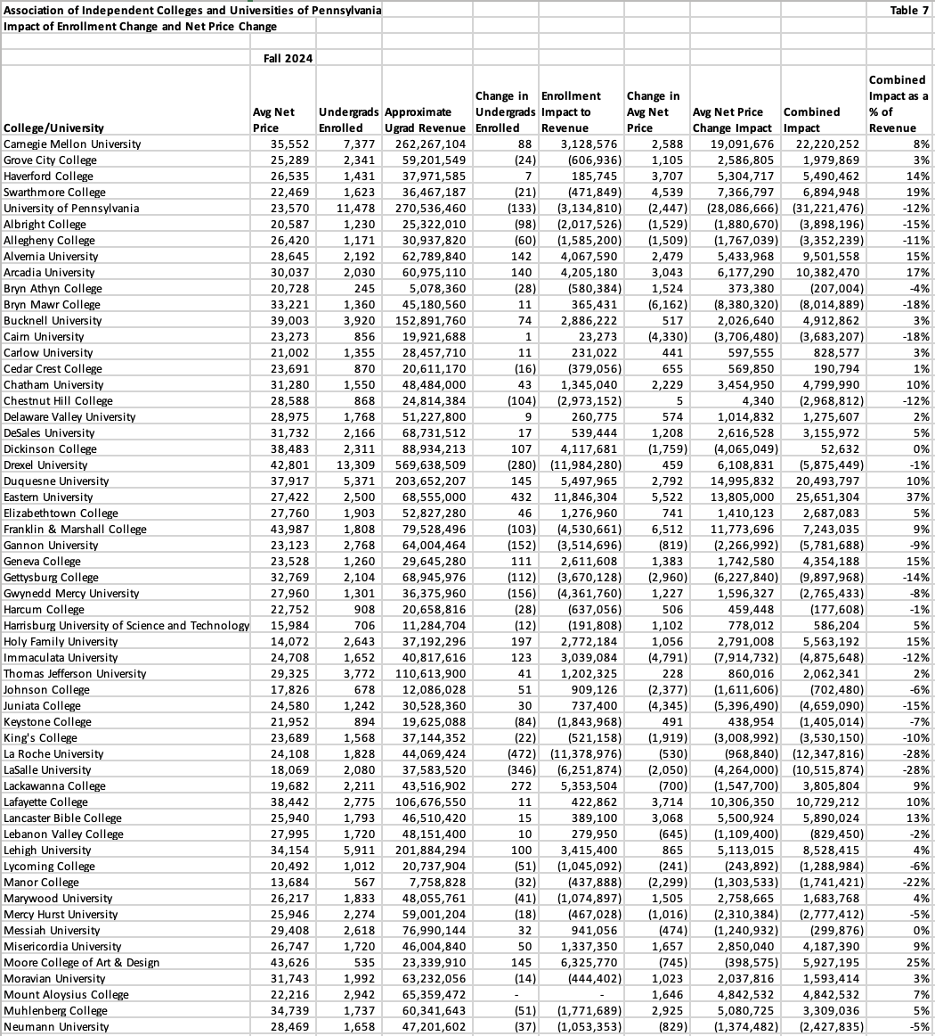
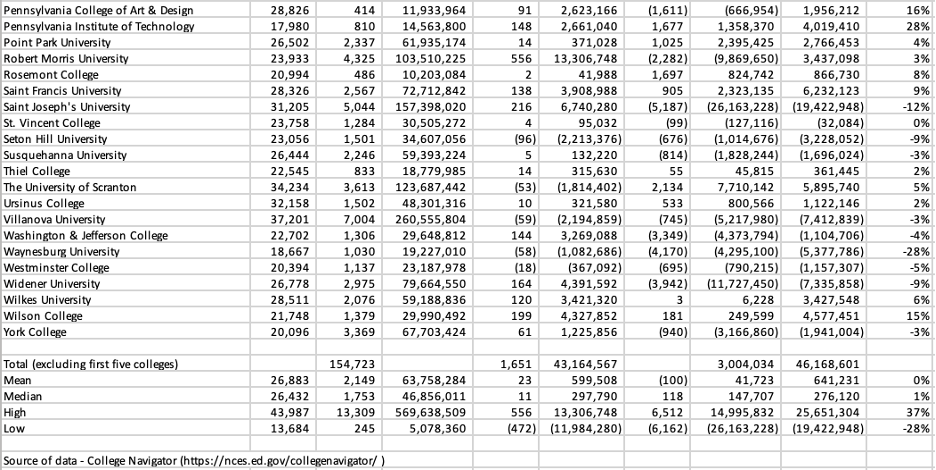
When undergraduate enrollments are increasing, a negative change in average net price may be okay if the total net revenues increase. Table 7 below calculates the impact of enrollment changes and changes in average net price for each of the institutions in this group. Excluding the five institutions previously mentioned, the overall increase in undergrads enrolled of 1,651 improved the group of 72’s revenue by $43,164,567. The average increase in median average net price of $118 positively impacted the group by $3,004,034. The overall impact of these changes added $46,168,601 to net revenue. With the average net price holding relatively steady, the positive impact on revenues was primarily due to an increase in students.
Reviewing individual schools, the results vary widely. Eastern University increased its aggregate revenues by $25.7 million, driven by an almost equal impact from average net prices and increased enrollments.
Drexel University, with a decline of 280 undergrads that reduced tuition revenue by approximately $12 million, managed to increase net price by $459 and offset some of the enrollment impact, resulting in an aggregate revenue decline of $5.9 million.
LaRoche University experienced the largest enrollment decline (-472 students) among the 72 institutions, resulting in a revenue decline of approximately $11.4 million. Unfortunately, LaRoche was unable to increase or hold its net price flat, and a $530 decline added $1 million to the overall revenue impact.
The largest increase in undergraduate revenues among the 72 colleges and universities is at Eastern University, as mentioned earlier. The second-highest increase belongs to Duquesne University, with an overall increase of $20.5 million in revenues, split between a positive $5.5 million from enrollment increases and $15 million from an increase in average net price.
Undergraduate enrollment at most of these private colleges and universities is campus-based, so adjusting expenses to offset declines in net revenues is not easy. Given that the enrollment and tuition data are two years old, only the institutions know how well they have managed amid an ongoing demographic cliff affecting enrollment and a very competitive environment affecting the average tuition discount rate.
After reviewing these tables, I had an insight. Perhaps it was due to observing patterns while manually entering numbers from College Navigator into an Excel spreadsheet, or maybe it was not. Regardless, I decided to create an additional table that calculated the year-over-year change in Net Price by Income Quintile as reported in College Navigator.
In Table 8 below, you can see the outcome of that analysis. The institutions with an increase in average net price year over year are highlighted in green (a color that generally denotes a positive financial outcome). I wanted to see whether there were any specific income quintiles that benefited (but cost the company money) from this net price increase, so I highlighted the negative cells in orange (thinking it’s easier to see than red).
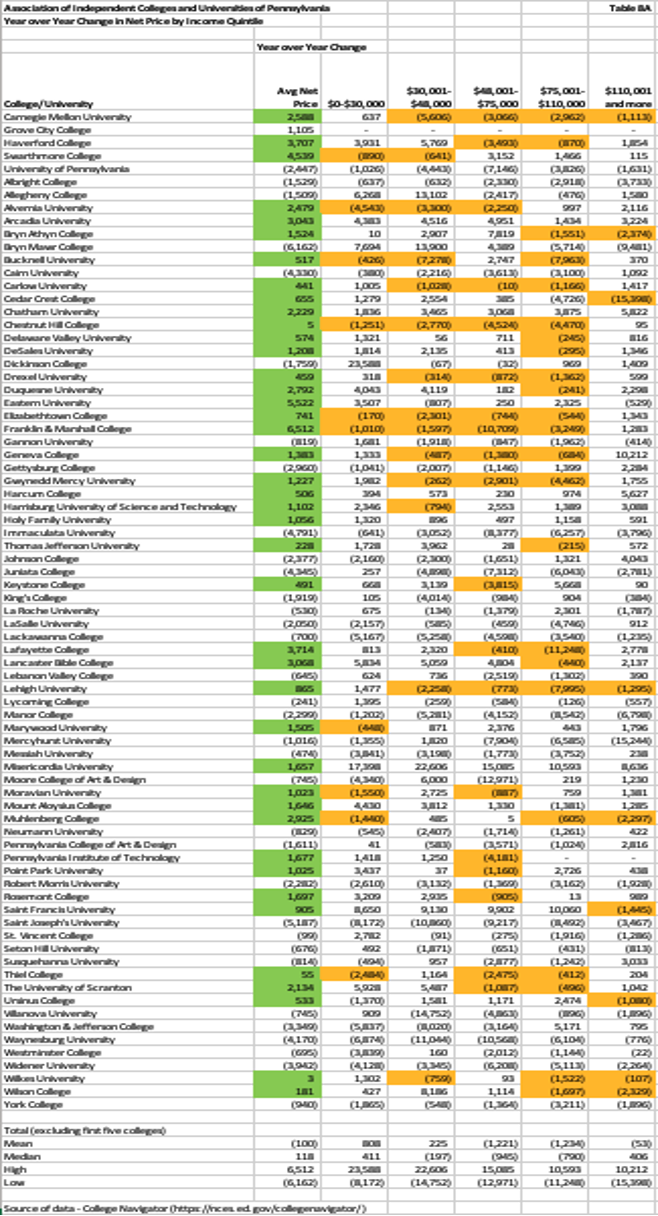
Since the table is so wide, the print is small. I opted to create a smaller table (Table 8A) highlighting only the year-over-year changes.
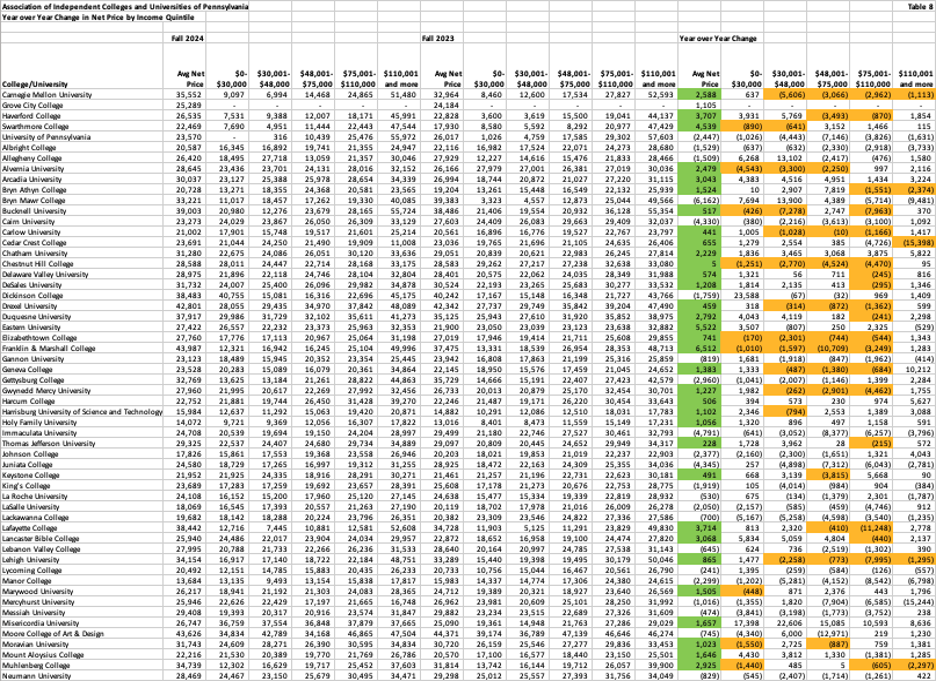
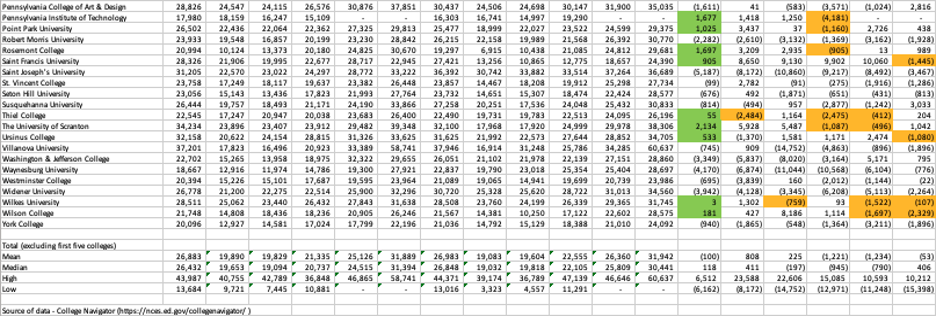
Table 8A below indicates that 39 of the 72 institutions incurred an increase in average net price year-over-year (as did four of the five excluded institutions). I have not worked in the financial aid department of a college or university, but I suspected that perhaps an increase in net price would be distributed in some recognizable pattern. That appears not to be the case upon a cursory review.
In an economy where lower-income families are struggling to cover basic living expenses, I expected to see an increase in the average net price benefiting the lowest-income quintiles. That appears to be the case with Alvernia, Bucknell, Carlow, Chestnut Hill, Drexel, Elizabethtown, Franklin & Marshall, Geneva, and Thiel.
Institutions where the increase in average net price benefited the highest-income quintile families (the two highest brackets) include Bryn Athyn, Cedar Crest, Saint Francis, Ursinus, Wilkes, and Wilson.
Looking at the statistical summaries for the group of 72, the median average net price increase was $118. The median for the 0-30,000 income quintile increased by $411 (meaning that more than half of the group increased the average net price for the lowest income quintile). The median for the 30,001-48,000 income quintile decreased by $197. The medians for the next two quintiles decreased by $945 and 790, respectively. The median for the highest-income quintile($110,001 and up) increased by $406. Interestingly, the median average net price increased by approximately the same amount for the lowest-income quintile as for the highest-income quintile. Note that the income quintile groupings are nationally dictated groupings by the Department and generally do not represent equal groupings in numbers at most institutions. As you might imagine, the most expensive institutions may have their highest numbers of enrolled students in the highest income quintile.
I would be concerned as a president or board member when the average net price for my institution decreased or slightly increased, and a substantial percentage of that decrease was tied to decreasing the average net price for the highest-income quintile. That finding was observed at Albright, Bryn Mawr, Cedar Crest, Immaculata, Juniata, LaRoche, Mercyhurst, Muhlenberg, Saint Francis, St. Vincent, and Wilson.
A Few More Thoughts
Most colleges must be resourceful these days to survive, let alone thrive. You don’t need an MBA to realize that small, declining enrollments combined with higher tuition discount rates, leading to lower average net prices, are a disastrous combination.
I was surprised that Pennsylvania’s private colleges didn’t experience the same decline that Maryland’s did (although the enrollment difference was only 1,900 students). The combination of enrollment and net price impact meant that the median revenue impact for Pennsylvania’s 72 institutions was a positive $276,000, while Maryland’s median revenue impact was a negative $580,000 on a much smaller base (approximately 20% of Pennsylvania’s total). Watching how that trends the next time the data is updated by the Department of Education will be insightful.
It’s important to remember that the average net price differs from the average net price by income quintile. Usually, but not always, the highest-income quintile has an average net price higher than the overall average net price. Depending on how much merit aid an institution awards to attract higher-income students, the discount for the highest bracket may exceed the overall average. It’s also possible that, with the recent changes to the ParentPLUS loan program, some of these institutions with lower endowments may experience declines in enrollment among lower-income students because they cannot cover the funding gap with the new program caps.
One point Daniel Greenstein made in his original analysis was that by the time acceptance rates reach 75%, nine out of ten institutions are at high financial risk. The admissions data for these institutions is two years old. Only 19 of 72 institutions had acceptance rates below 75%. The impact of the demographic cliff is evident in Pennsylvania. However, given the widespread use of tuition discounting to attract students, most of these non-selective schools have to work hard to maintain aggregate net revenues, let alone increase them at a high enough rate to cover rising expenses. This year’s outcome of increasing enrollment while holding net price relatively steady was impressive given the circumstances.
Most of the colleges in this group have enrolled graduate students to increase revenues. Almost all have added business programs to their traditional liberal arts programs to attract new students. Tuition resets, in which the college deliberately cuts its tuition across the board (and the size of its merit aid awards), are increasing, according to a recent Wall Street Journal article. Some private colleges are offering in-state students an “in-state” rate to be a more price-competitive option. I saw no evidence of a recent tuition reset among these institutions, but there is a wide range among institutions in the Total Cost of Attendance bands.
Small college presidents facing enrollment and tuition-discounting issues have a daunting challenge. If they raise their price, they risk decreasing their yield. If they cut prices, they erode their margin. Highly selective institutions like the University of Pennsylvania and Carnegie Mellon don’t have those risks. Colleges and universities with online programs that can scale and offer a low cost of attendance like Eastern University (93% of grad students attend 100% online) may be the big winners in the long run.
In the aggregate, Pennsylvania’s private colleges did not experience an enrollment decline. College Navigator reports the percentage of in-state versus out-of-state students for each institution, but that was a statistic that I did not review.
Fewer than half (33 of 72) of the institutions had to increase their tuition discount percentage (see Table 6). Does that indicate that annual tuition discounting increases are over? I think it’s too soon to tell. It’s important to remember that the original justification for tuition discounts was to increase enrollments. Table 7 provides some additional insights. Of the 33 institutions that decreased their average net price, only 5 experienced increases in undergraduate enrollment, with revenues offsetting the net price decreases. These were Dickinson, Lackawanna, Moore College of Art & Design, Pennsylvania College of Art & Design, and Robert Morris.
I think it is important to remember that the most current data reported on College Navigator is the Fall of 2024. Each of these institutions has changed its tuition, fees, room and board, and estimated total cost of attendance. Those more current numbers are published on their websites. I didn’t bother to check them because only a handful of institutions continue to raise tuition at rates that don’t align with increases in most family incomes in the U.S.
I’ll continue to update the states that I’ve analyzed on a periodic basis, as well as look for other data that may illuminate some of the findings from the College Navigator data.