I am a fan of dual enrollment programs. For the uninitiated, these programs allow high school students to take courses that earn them high school and college credit. The courses may be taken at a local college or high school. The programs are formalized with a signed agreement between high schools and colleges.
Dual credit programs save the student time (they’re taking college-level courses in high school for which they receive credit) and money (they don’t have to take those courses in college). In the case of the state that supports public high schools and colleges, these programs save the state money by reducing extra courses in college.
Dual enrollment is not new. I first wrote about it in 2019 when I discussed an Ithaka SR issues brief about states increasing access to higher education and degree attainment. The National Student Clearinghouse’s first look at Fall 2022 enrollment report mentioned that dual enrollment was responsible for community college enrollment bouncing back.
I wrote another piece in October 2023 that attempted to explain the process more granularly as well as outline successful states and those states not so successful. That article mentioned a publication from Columbia University’s Community College Research Center (CCRC) titled the Dual Enrollment Playbook.
New National, State, and College-Level Data
John Fink published an article on the CCRC’s blog last month that reported new data about dual enrollment collected by the Department of Education’s IPEDS program. For the first time ever, college-level counts of the number of high school dual enrollment students were reported and disaggregated by race/ethnicity and gender.
According to Fink, nearly 2.5 million high school students took at least one dual enrollment course in the 2022-23 academic year. This exceeds the CCRC’s estimate of 1.5 million students for Fall 2021. While the enrollment news is great, Fink cautions readers this is the first time that colleges have reported their dual enrollment data. Data geeks are cautiously optimistic.
As previously mentioned, community colleges enroll the largest numbers of high school dual enrollment students. Their lead is followed by public four-year and private non-profit four-year colleges. Community colleges enrolled 1.78 million dual enrollment students. This total represented 21% of community college enrollments in the 2022-23 year.
Dual enrollment at community colleges varies by state. At some community colleges, more than 50 percent of the enrollments were from students taking courses at their high school. In other states, it’s the reverse with more high school students taking courses at their community college.
A map of the U.S. created by CCRC illustrates the differences by state:
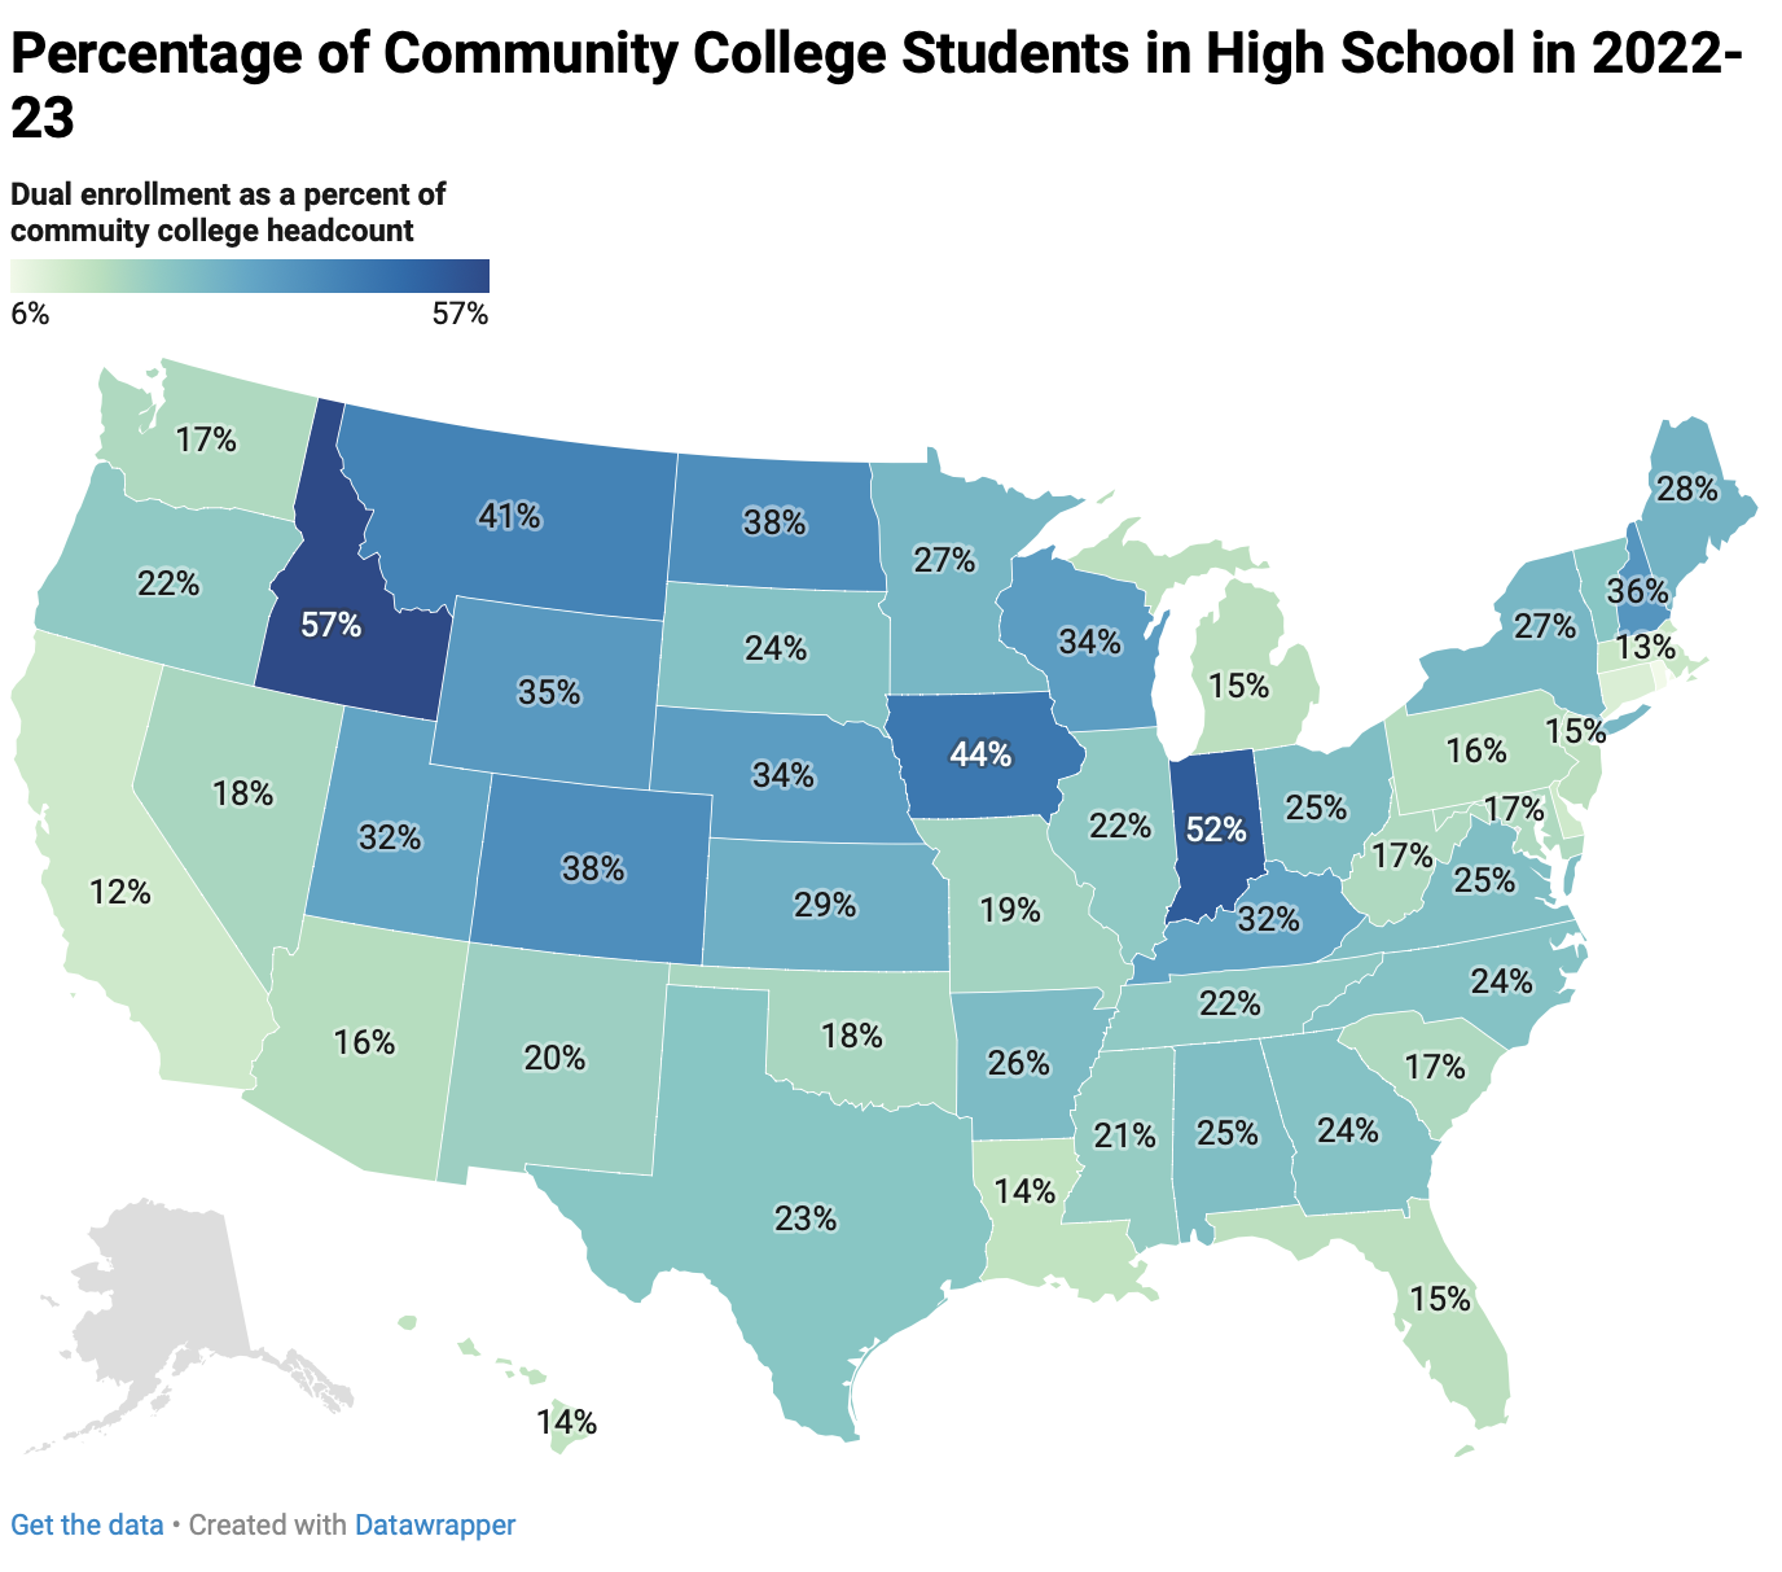
Idaho, Indiana, and Iowa (what’s with the states whose name begins with the letter “I”?) lead the nation in dual enrollment students. With two of those states over 50% and Iowa at 44%, the percentage of their high school students enrolled in community colleges is approximately 250% more than the national average.
Minority Student Underrepresentation
Black and Hispanic students are underrepresented nationally compared to their respective percentages of college enrollment. White students are overrepresented, accounting for 52 percent of high school dual enrollment versus 44 percent of overall public K-12 enrollment.
Black students accounted for eight percent of high school dual enrollment versus their 15 percent of overall public K-12 enrollment. Massachusetts was the only state where Blacks were not underrepresented. There are only 74 community colleges in the U.S. where Blacks had equal or greater representation.
Hispanic students accounted for 20 percent of high school dual enrollment versus their 29 percent of public K-12 enrollment. There are 18 states where Hispanic students had equal or greater representation in dual enrollment. Additionally, Hispanics had equal or greater representation in more than a third of community colleges nationwide.
A Dual Enrollment Data Tool
The CCRC is a research center. In keeping with its name, it built a dashboard that allows anyone to easily access the IPEDS dataset.
The dashboard allows you to select your college or state and identify the number of dual enrollment students. It also allows you to see the percentage of dual enrollment students compared to the overall undergraduate student body. Lastly, you can compare the racial/ethnic and gender representation.
Mr. Fink embedded the tool in the blog’s text. Fortunately, he also included a link to the dashboard. Some of his highlights are not surprising. For example, California, Texas, New York, Indiana, and Florida report the highest totals for dual enrollment by size. Altogether, these five states enrolled nearly 900,000 dual enrollment students, more than a third of the national total.
The largest number of Black students are enrolled in Texas, Florida, and Georgia. The largest number of Hispanic students were enrolled in California, Texas, and Florida.
The tool allows you to compare the size and demographics of dual enrollment students across colleges in your state. Below is a screenshot of the data for Maryland. Maryland is one of the weakest states in terms of the percentage of students enrolled (7%).
The top four colleges in Maryland by enrollment are community colleges. Surprisingly, Johns Hopkins University is number five.
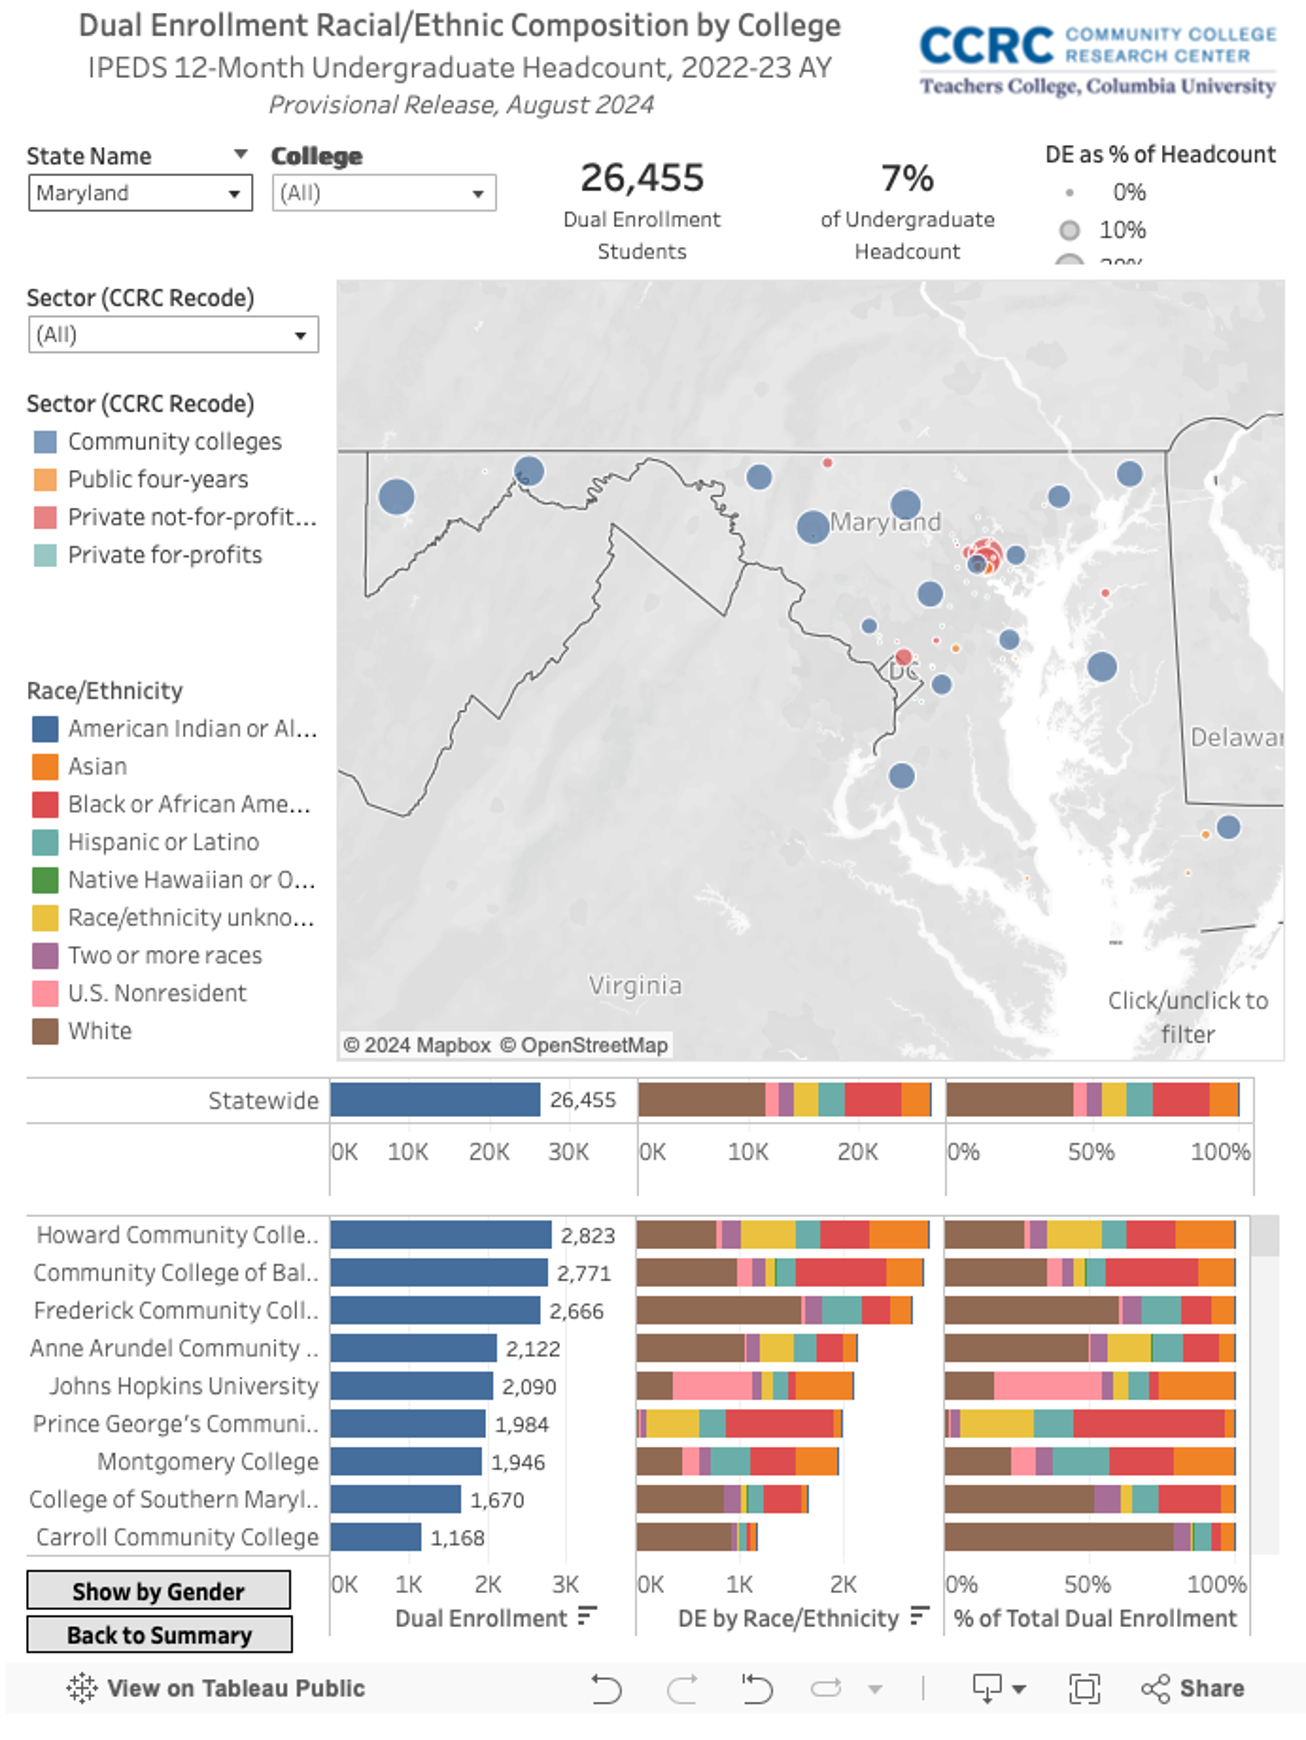
The leadership in enrollment by four of Maryland’s largest community colleges does not surprise me. What surprises me is Hopkins’ standing in fifth place. I suspect it may be linked to Hopkins’ summer programs for gifted and talented high school students.
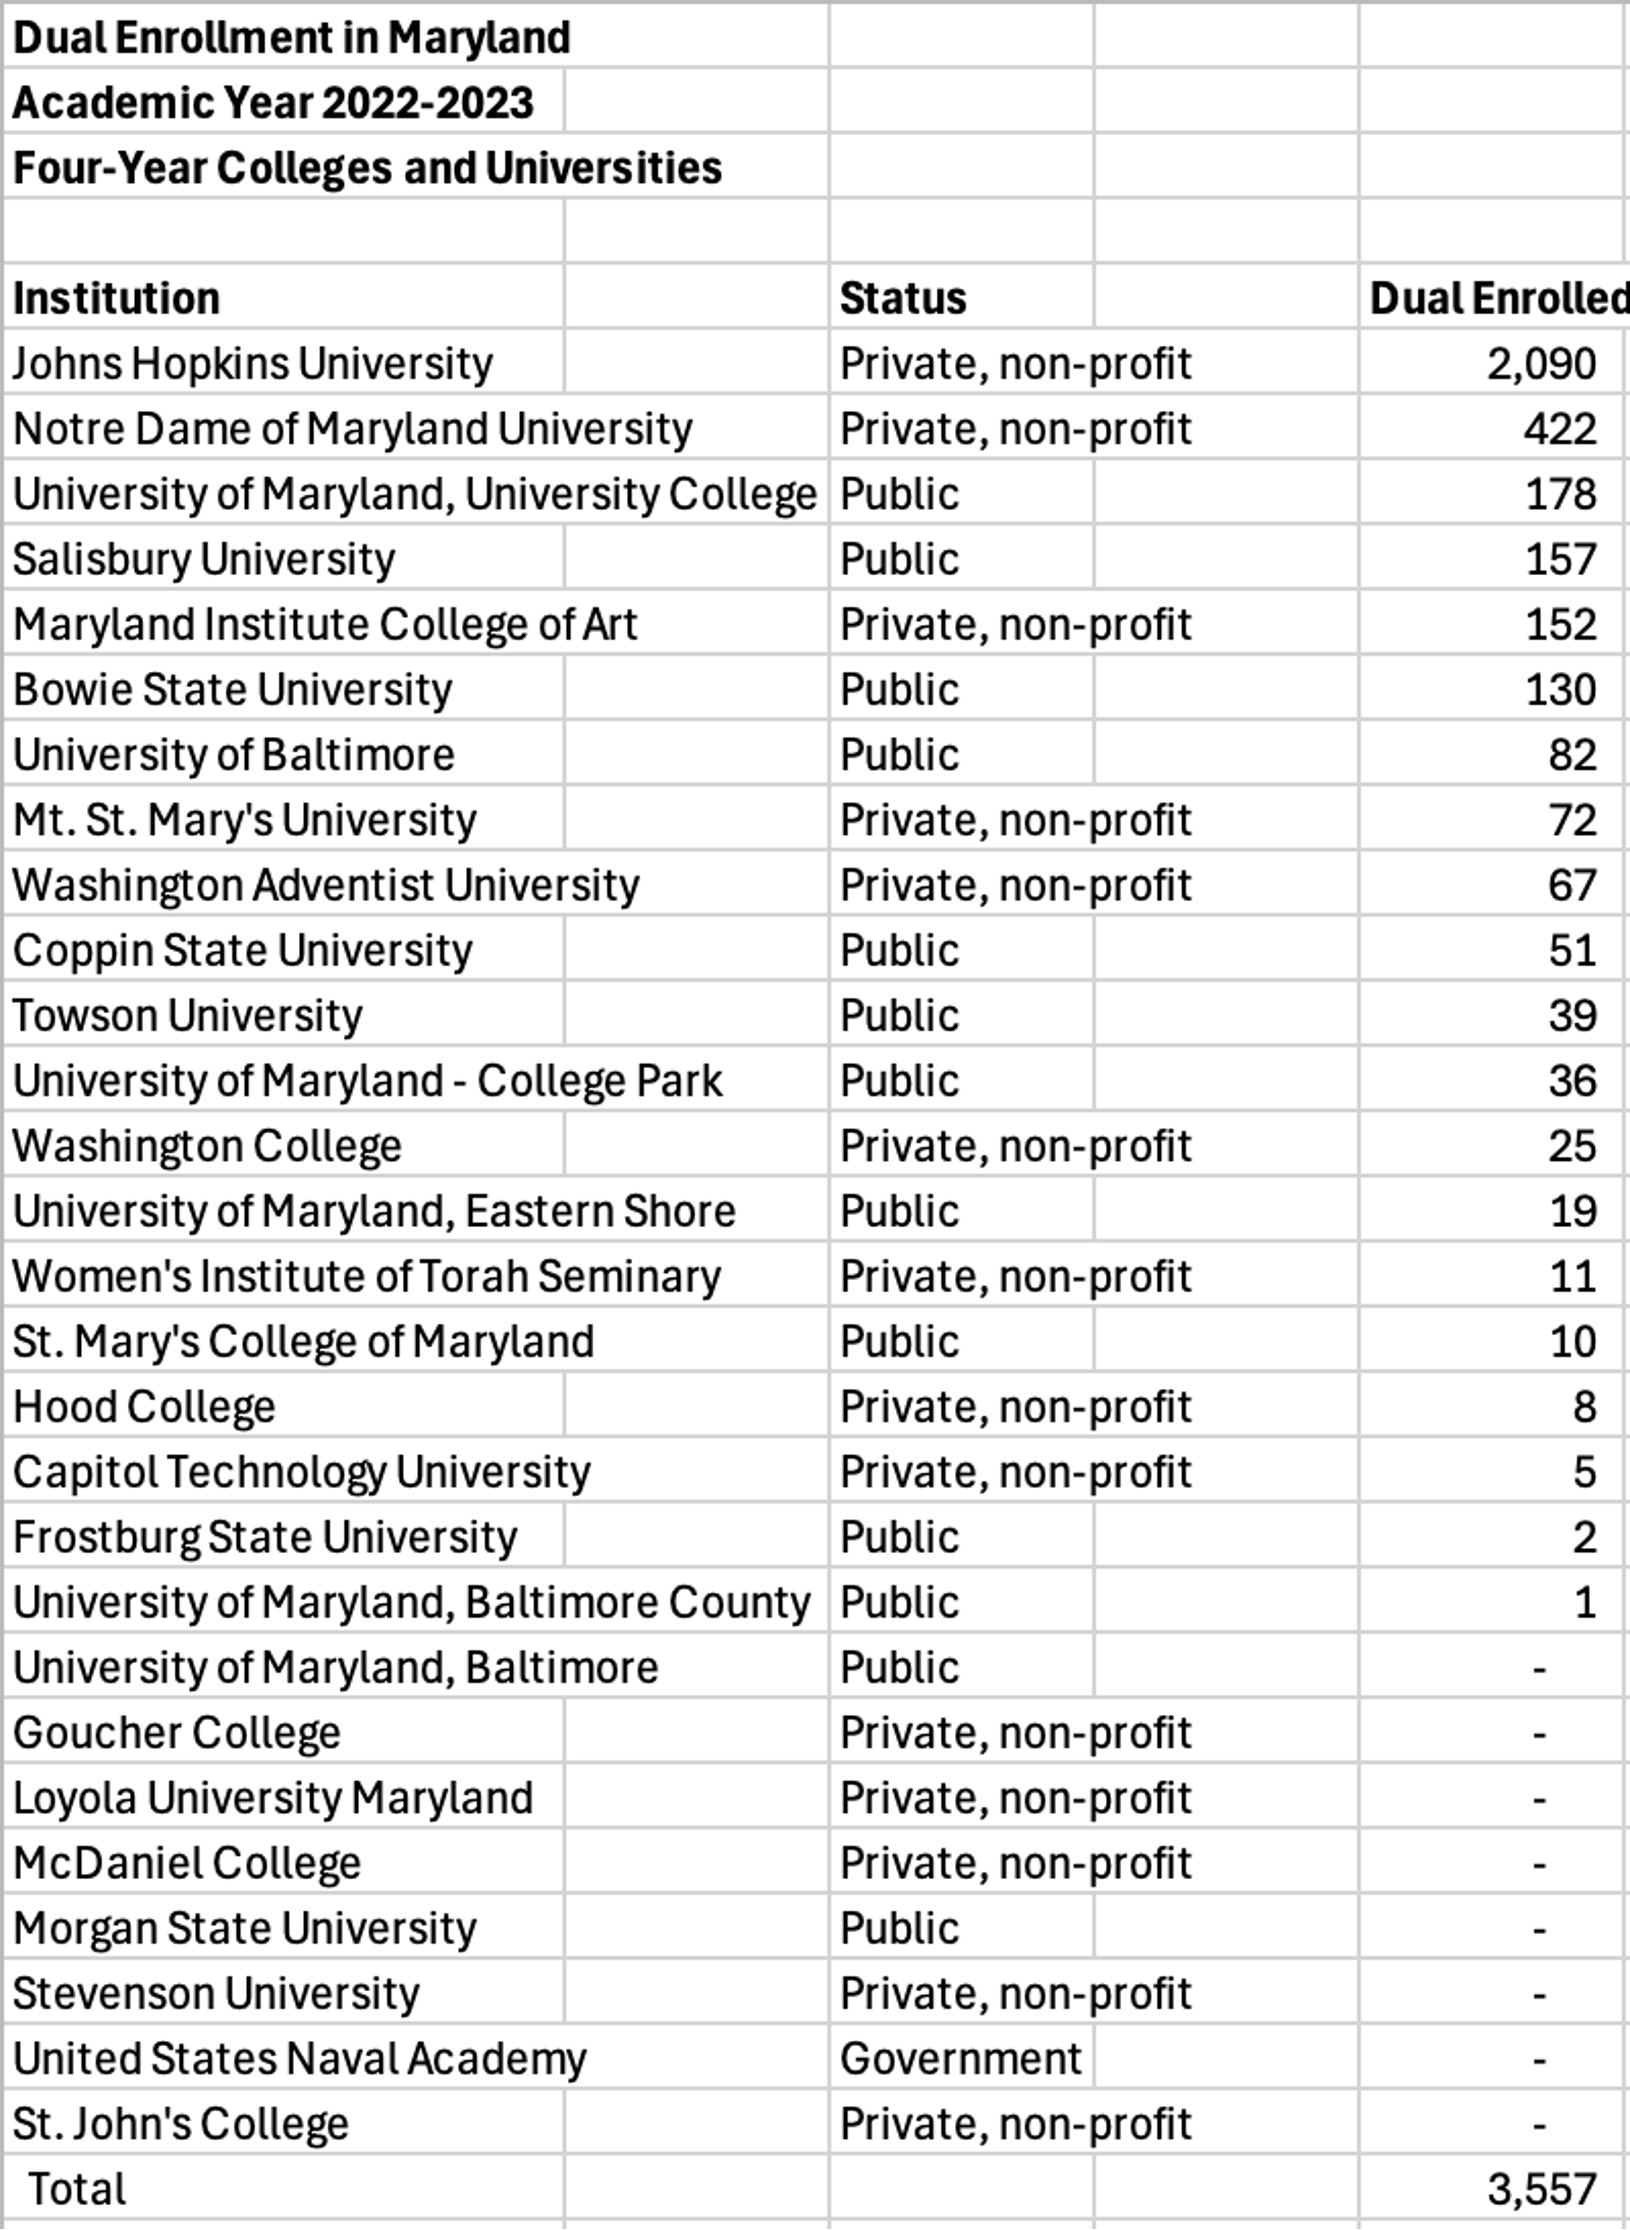
I looked at the dual enrollment totals for all four-year colleges and universities in Maryland. It was somewhat surprising. Only 3,557 of 26,455 dual enrollment students enrolled at four-year colleges and universities. Johns Hopkins accounts for more than half of that total, followed by Notre Dame of Maryland University with 422.
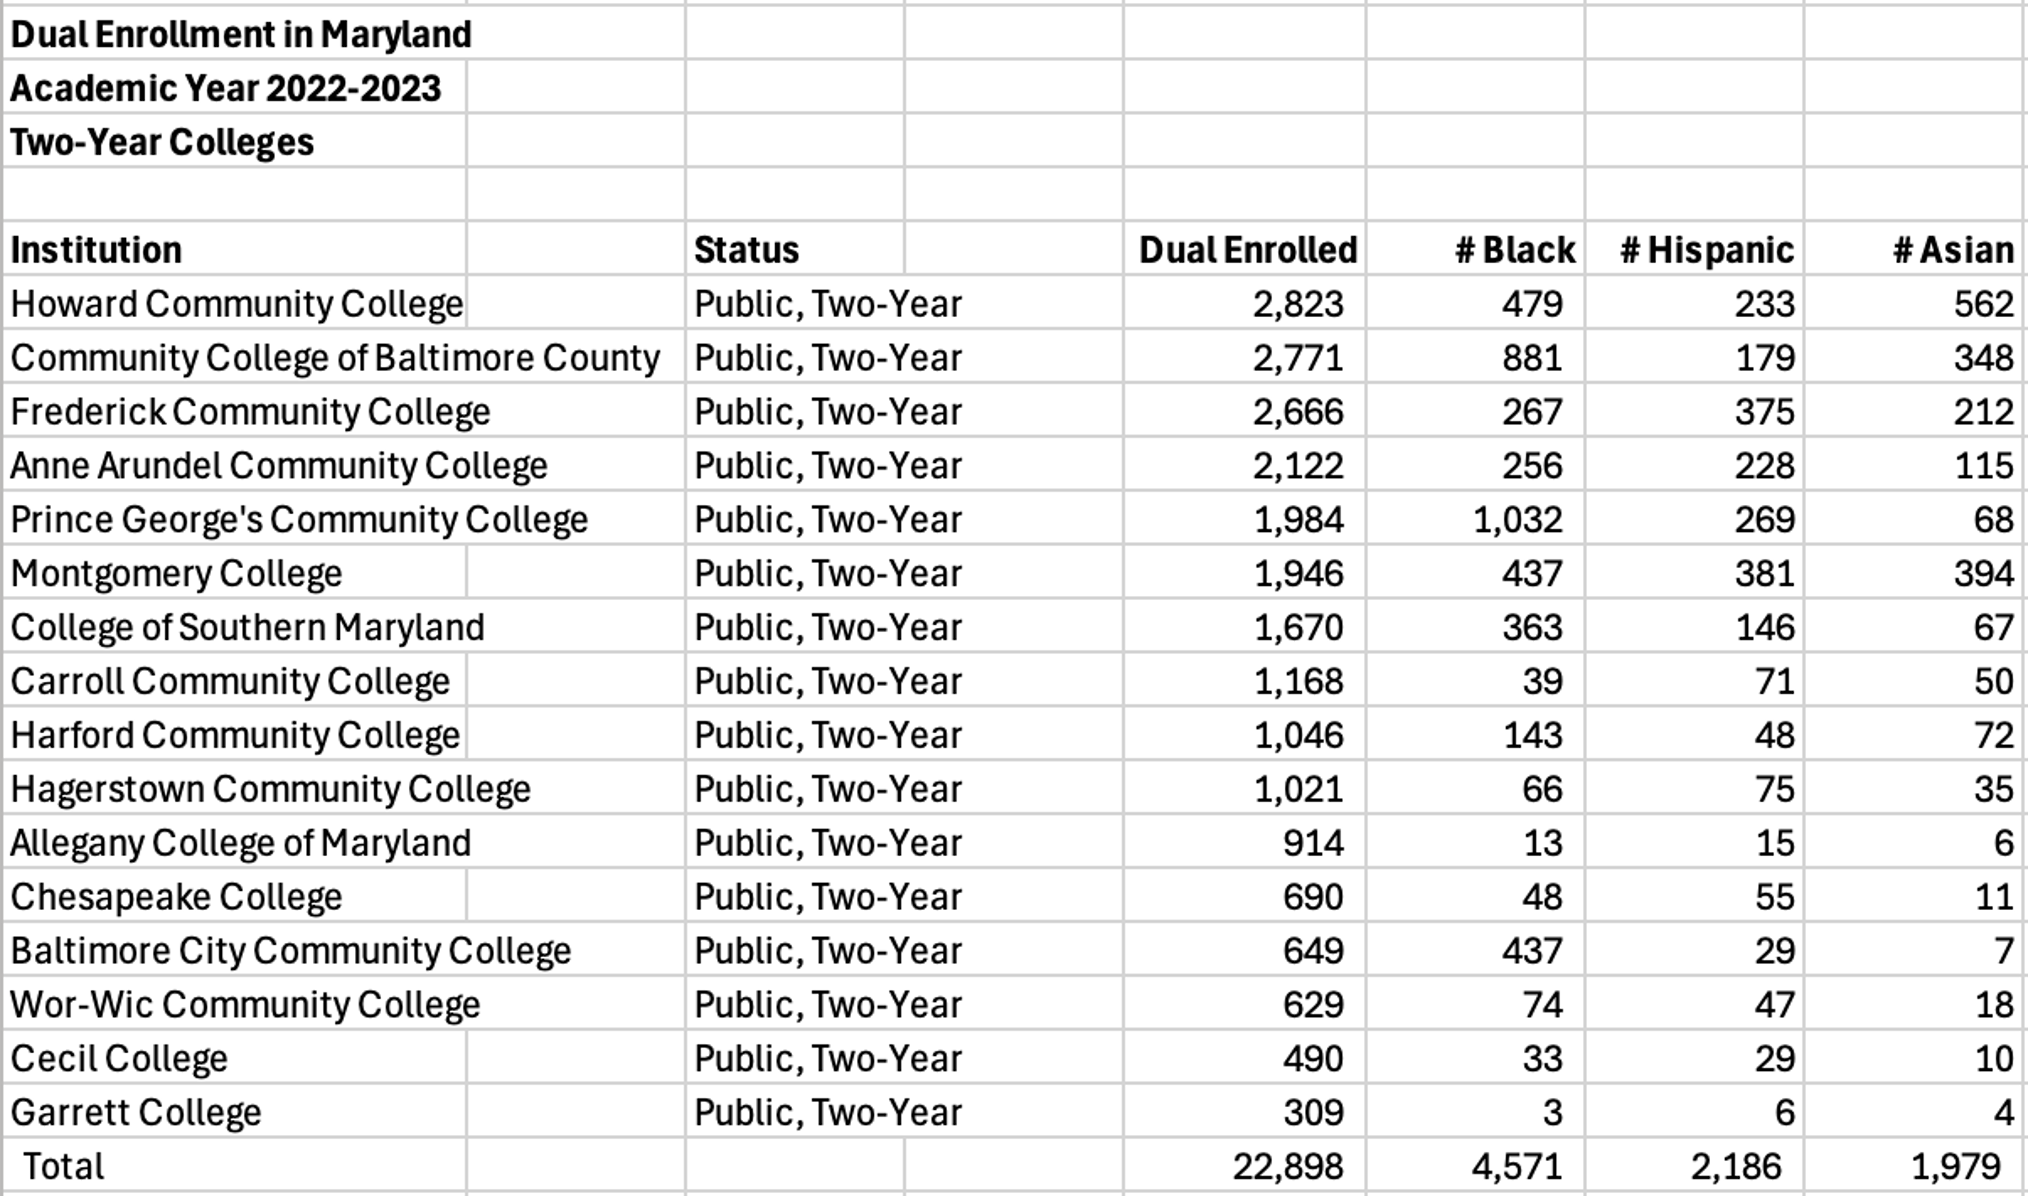
Since community colleges enroll a substantial percentage of Maryland’s dual enrollment students, I decided to put together a chart listing them from largest number of students to lowest. I also added columns for minority student enrollments. These appear to follow the minority percentages in those communities.
While Howard Community College enrolls the largest number of students, Prince George’s Community College enrolls the largest number of Black students (1,032) followed by Community College of Baltimore County (881). Montgomery College (381) and Frederick Community College (375) are virtually tied for Hispanic/Latino enrollments.
CCRC Policy Fact Sheet
Mr. Fink provided a link to a previously published CCRC Policy Fact Sheet about dual enrollment. The fact sheet provides a general understanding of how dual enrollment works and includes a set of interesting statistics, which are appended below.
- Nationally, 82% of high school students attend a school that offers DE courses.
- About one third of high school students have taken at least one DE course by graduation.
- About 70 percent of DE students enroll through community colleges.
- From 2011 to 2021, the number of students taking DE nearly doubled.
- High school students account for one in five community college enrollments.
- The most prominent model for DE delivery is certified high school instructors teaching courses at the high school.
- About 80 percent of DE students take college courses at their high school.
The fact sheet also provides a summary of information related to funding models across states, systems, and partnerships. CCRC notes that lowering tuition can lower barriers to access.
- DE is funded through a mix of state, local, K-12, and student/family sources.
- In many states and localities, community colleges also subsidize DE courses through discounted or waived tuition and fees.
- DE can be financially sustainable for colleges if they take advantage of economies of scale by increasing the number of students who participate. If those colleges implement DE strategically, they can increase the rate at which DE students continue at their college after high school.
- DE by the course tends to be less costly to school districts, colleges, and students than Early College High School (ECHS) models.
- States, systems, and partnerships have aimed to reduce students’ tuition costs for enrolling in any type of DE programming to reduce barriers to access.
The fact sheet notes that gaps in access to dual enrollment coursework can be traced to exclusionary policies and practices. Specifically…
- White students participate in DE coursework at twice the rate of their Black and Hispanic classmates.
- English learners and students with disabilities are severely underrepresented in DE coursework.
- Access to DE is highly variable within states and even among high schools in the same school district.
- One in five districts report nearly equal or higher rates of participation in DE among Black and Hispanic students.
- Colleges and schools tend to rely on standardized placement tests for eligibility.
Final Thoughts
Dual enrollment programs continue to grow nationwide. In some cases, dual enrollment has surpassed participation in Advanced Placement courses as well as International Baccalaureate programs, each of which can result in students receiving college credit.
Evidence exists that dual enrollment improves academic outcomes for students. Those students who earn dual enrollment credit complete high school, enroll in college, and complete college degrees at rates higher than students who do not participate in dual enrollment.
I don’t understand why more four-year colleges and universities don’t participate directly in dual enrollment programs. I spoke with several public university provosts who indicated that they accept the dual enrollment credit awarded by their state’s community colleges and for that reason, do not sign agreements directly with high schools.
I can’t speak for all states, but Maryland is one that provides some financial incentives for even private colleges to enroll dual enrollment students. At the same time, most of Maryland’s private colleges do not enroll many dual enrollment students.
It seems that private colleges struggling to meet enrollment targets should strongly consider signing dual enrollment agreements with local high schools or feeder schools (like independent schools).
Some private colleges may not understand why they should grant credit that potential new students could use to shorten the time to graduation. I could not find current information on the average number of credits completed but believe that approximately half of dual enrollment students only complete one course. How much of a risk is that?
I don’t believe reducing the time to graduation (and consequently, tuition revenue) should be a legitimate concern of any four-year college or university, public or private. Several of my daughter’s college classmates who earned substantial dual enrollment credits while in high school were able to complete a master’s degree in the four year period that my daughter earned her bachelor’s degree. Since 80 percent of courses are typically taught at the high school by an approved instructor, an MOU between the four-year college and high school should assuage quality concerns.
Dual enrollment is one of a few good ideas for lowering the time to completion and the cost of a college degree. I hope it continues to gain momentum and that more high schools and colleges provide opportunities for their students to earn college credit in high school. As colleges continue to report dual enrollments to IPEDS, I expect to see the totals to rise.


