For a while, various reporters and writers have mentioned the pending demographic cliff, the year in which the number of U.S. high school seniors peak. The data, based on birth rates, indicates that graduating seniors will peak in the Spring of 2025, and colleges will experience fewer applicants for the next dozen or so years until a rebound occurs. I usually turn to the WICHE Projection to understand these trends.
Since 1979, the Western Interstate Commission for Higher Education (WICHE) has projected the number of high school graduates, issuing a report every four years. Its first projections were for the states in the WICHE region. Their most recent report, Knocking at the College Door, was published last week and covers all states.
In the intro to this year’s report, researchers Patrick Lane, Colleen Falkenstern, and Peace Bransberger write that higher education is at an inflection point. Adding to the uncertainty of the drop in the number of high school graduates is the impact of Covid-19 that led to fluctuations in high school enrollments as well as learning losses.
The 2025 peak in high school graduates (the highest numbers ever according to the researchers) will be followed by a period of declining enrollment through 2041, the last year of the current projections.
The report notes that “concerns about college affordability, questions about the value of postsecondary education, and a favorable labor market with relatively high starting wages and low unemployment put additional pressures on already declining postsecondary enrollment.”
Methodology for Projecting High School Graduates
WICHE’s researchers write that their methodology is based on births, enrollment numbers for grades 1st through 12th, and the number of graduates in each state. These numbers are used to calculate progression rates and project future enrollments and graduates. Assumptions related to immigration, mortality, retention, and progression trends are assumed to continue.
Enrollments during the 2020-2021 school year were impacted by COVID-19. Specifically, the progression rate dipped across most public school enrollments. The researchers tracked the progression rates in the two subsequent years and note that rates have rebounded to pre-pandemic levels. This suggests a one-time enrollment impact.
High School Graduates: Actual and Projected
Figure 1 below provides the total number of high school graduates from 2009 through 2041 (a 32-year period). It also breaks out graduates between public schools and private schools. Total graduates decline from 3.9 million in 2025 to 3.4 million in 2041. Publics decline from 3.5 million to 3.1 million. Privates decline from 329k to 305k.
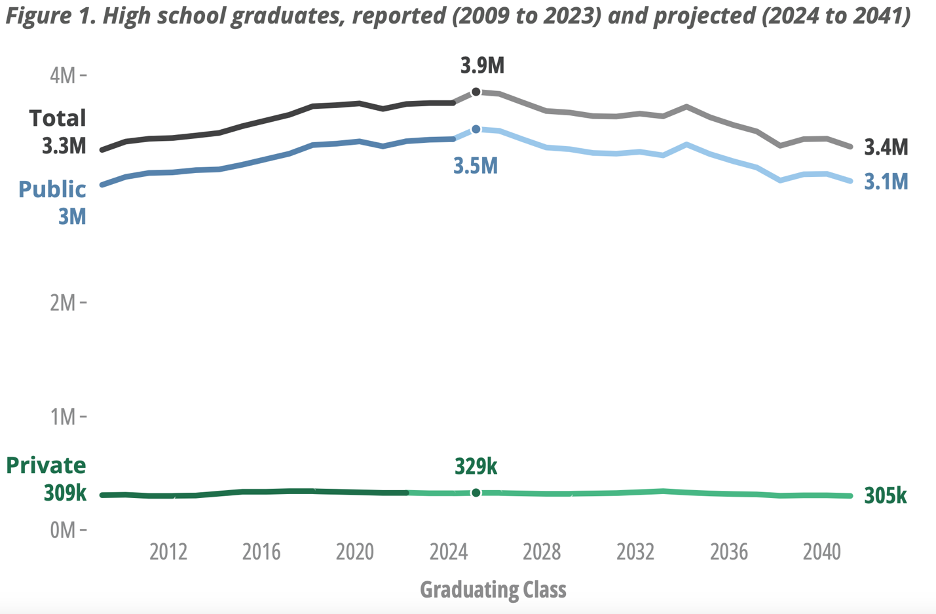
The decline varies by state. The researchers note that compared to 2023, only 12 states and Washington, D.C. are projected to see an increase in graduates from 2023 to 2041. While the national decline is projected to be 10%, seven states will experience a decline of 20% or more.
Five high population states (California, Illinois, Michigan, New York, and Pennsylvania) will comprise approximately 75% of the expected decline in total graduates.
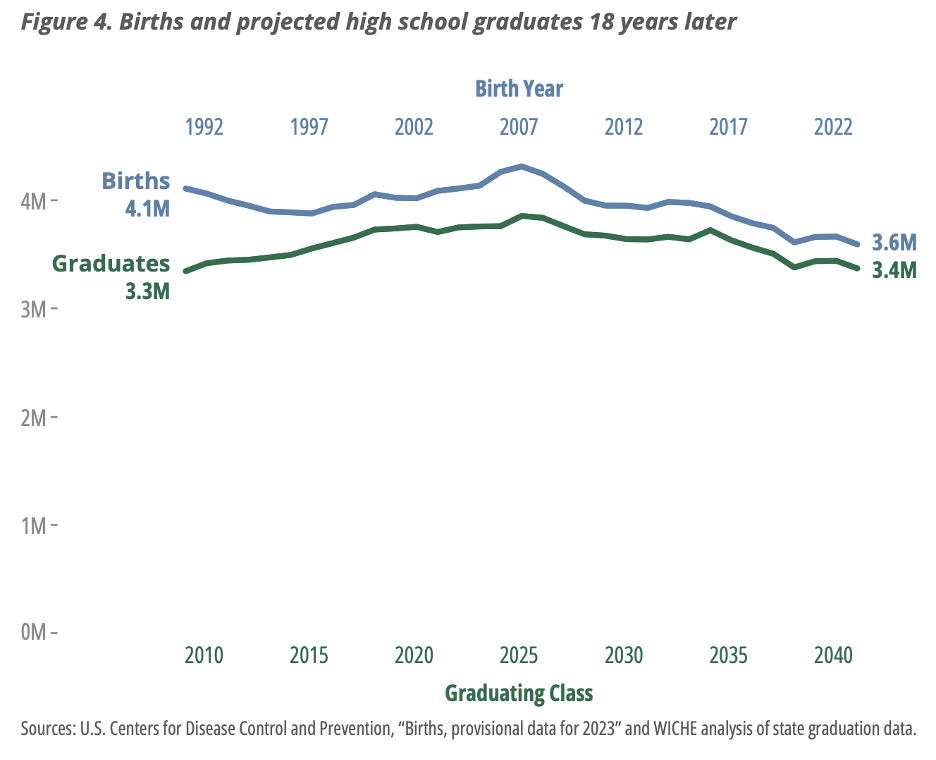
Births influence the number of graduates directly. In Figure 4 below, the data shows that the number of graduates 18 years later is closely correlated to the number of births 18 year earlier.
The rate that students progress through the education system impacts the number of graduates. The researchers note that improving the high school graduation rates can stem the decline in the number of graduates. However, to match the number of 2025 graduates in 2041, 95% of the ninth graders in 2037 would have to graduate. Currently, graduation rates for ninth graders have averaged 88% for the past five years.
It’s also important to note that the term demographic “cliff” is somewhat of a misnomer. The graduation rates don’t drop as steeply as a cliff but decline over a long period of time. In some ways, the gradual decline is more difficult to adjust to rather than adjusting to a one-time only drop in the numbers of students graduating.
The researchers also write that the decline in the number of high school graduates is a separate issue from the decline in college enrollments. College enrollments have continued to decline since their peak in 2010. Declining high school enrollments will put pressure on postsecondary enrollments but may not be the primary explanation.
To offset the decline in birth rates, the college matriculation rate for high school graduates will have to increase from 61% in 2023 to 68% in 2041. The researchers note that a similar change was experienced from 1990 to 2005 when the percentage of high school graduates attending college increased from 60% to 68%.
Public High School Graduation Projections
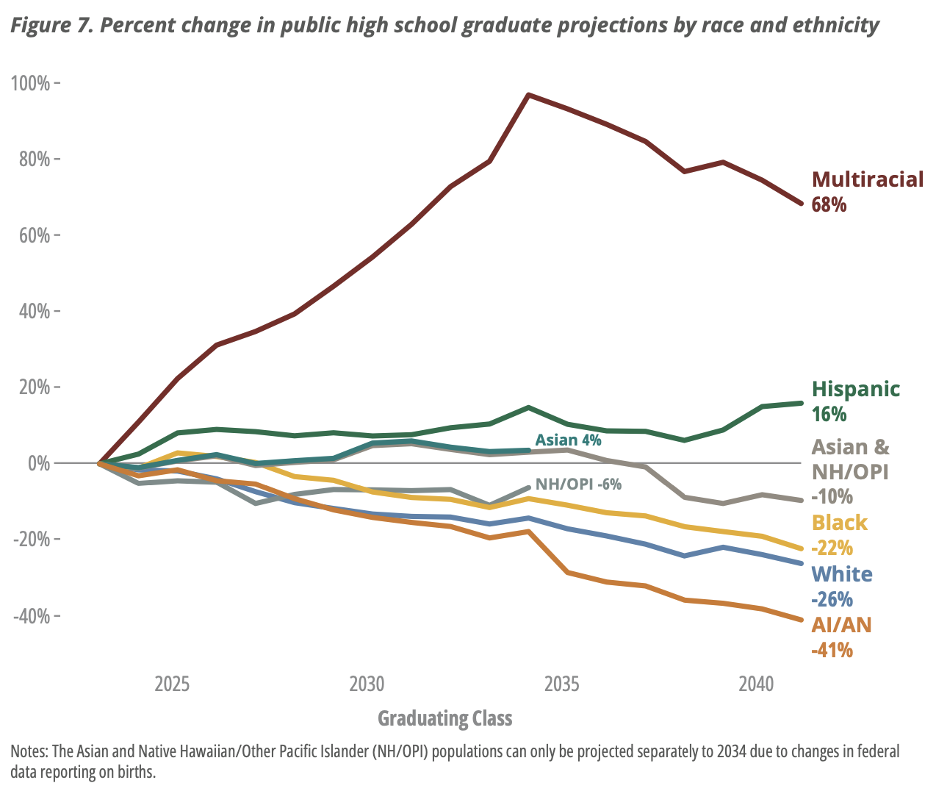
The researchers report that the number of future graduates who identify as Hispanic or multiracial will increase. This section only refers to public school graduates because reliable data on race and ethnicity from private schools is unavailable.
WICHE’s researchers write that they used the federally defined categories for race and ethnicity categorization. Trendlines for Asian and Native Hawaiian categories cannot be separately projected past 2034-2035 due to definitional changes.
Figure 6 below illustrates the changes in numbers of graduates by race and ethnicity over the same 15-year period.
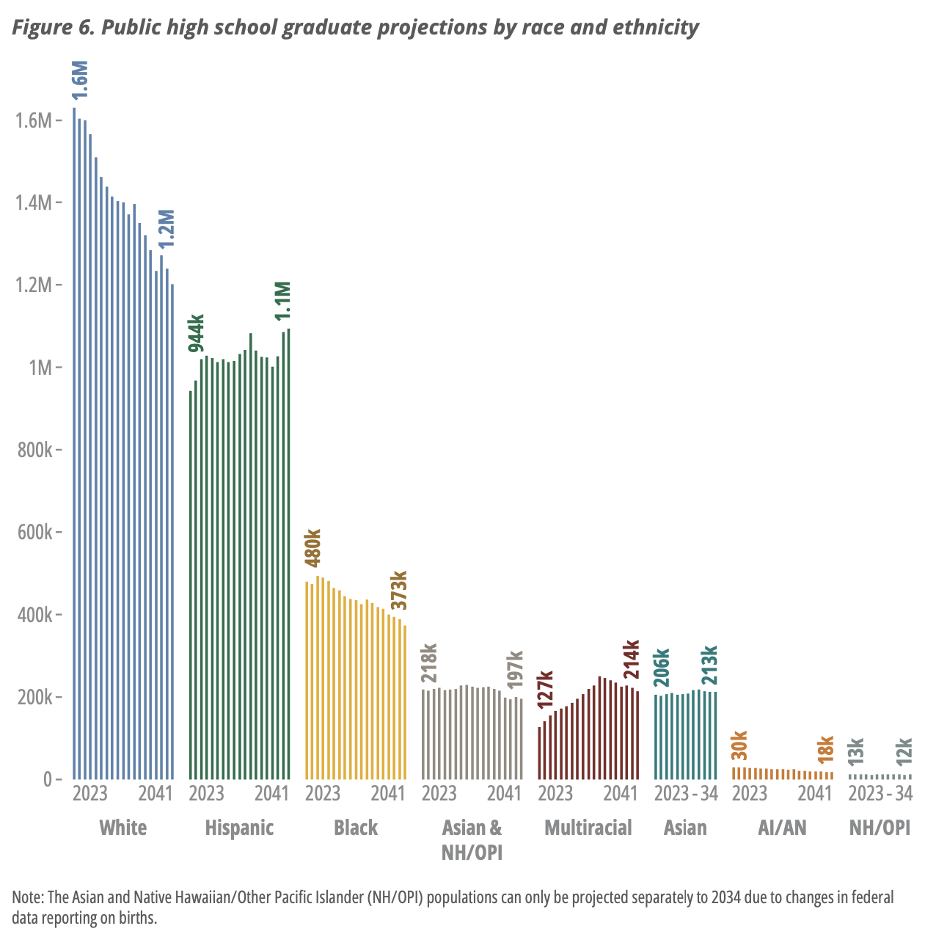
Figure 7 below illustrates the percentage growth/(decline) by race and ethnicity over the same 15-year period. White students are projected to decrease to 1.2 million in 2041, representing a decline of 26%. White students will decline to 39% of the public graduating class versus 47% of the public graduating class today.
Hispanic public students will increase to 1.1 million graduates in 2041 from 944,000 in 2023. This will represent an increase to 36% of the public graduating class versus 27% today.
Multiracial public students will nearly double from 127,000 in 2023 to 214,000 in 2041. At that time, multiracial students will represent approximately 7% of public graduates.
Black public graduates will decrease to 373,000 graduates in 2041 from 480,000, representing a decline of 22%.
High School Graduate Projections by State
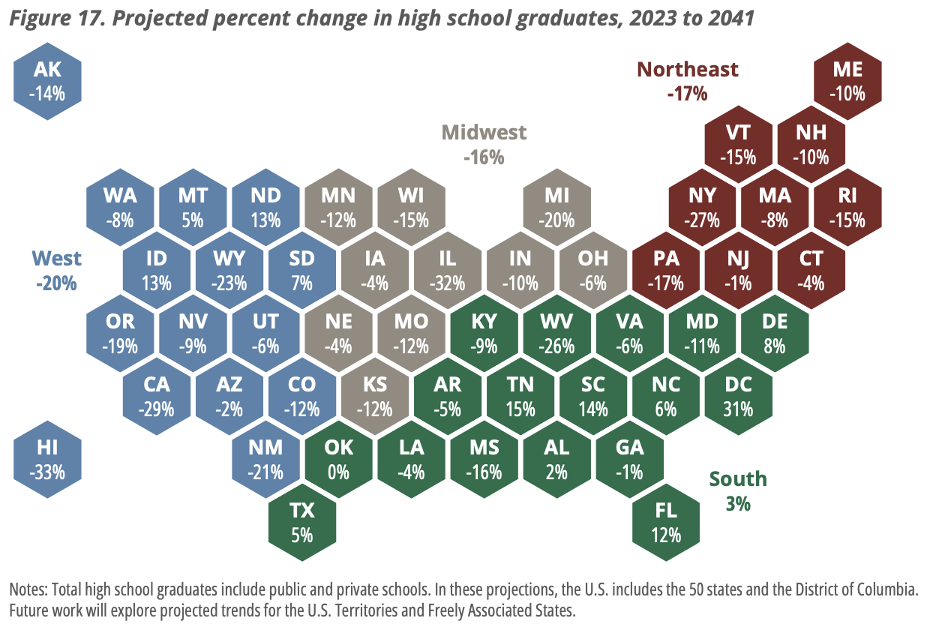
As mentioned earlier, 38 states are projected to see a decline in the number of graduates by 2041. Figure 17 below provides a state-by-state depiction as well as a regional summary. The South is the only region projected to grow. Tennessee, South Carolina, and Florida are its biggest winners. The states with the largest declines in the South are West Virginia (26%), Mississippi (16%), and Maryland (11%).
The Northeast has the highest projected decline at 17%. There are no states in this region predicted to grow in number of graduates. New York (27%), Pennsylvania (17%), Vermont (15%) and Rhode Island (15%) have the largest projected declines.
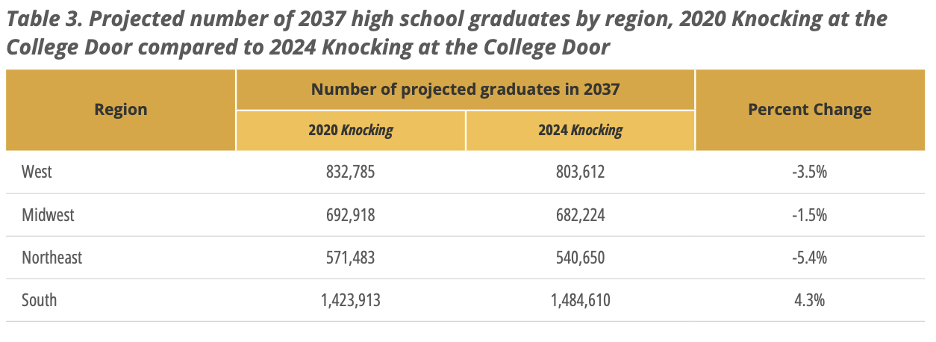
To demonstrate the changes in its projections since the last report in 2020, the researchers built Table 3 illustrated below. The Northeast experienced a 5.4% higher than projected decline in 2037 and the South experienced a 4.3% higher than projected increase in 2037. The researchers explain the higher increase in the South as due to higher net migration.
Private schools in the South are projected to grow through 2032 with a 6% increase over the 124,000 private graduates in 2023.
COVID-19’s Impact on the High School Graduate Pipeline
The researchers write that the best way to determine the impact of Covid-19 on enrollments is to compare the last report (2020) with this report. In the short-term, the number of graduates is very similar. However, there are fewer students enrolled in early grades than previously projected. This will lead to fewer future graduates.
Figure 27 below illustrates the difference between projections of total students in 2020 and in 2024. The 2037 decline only differs by approximately 100,000.
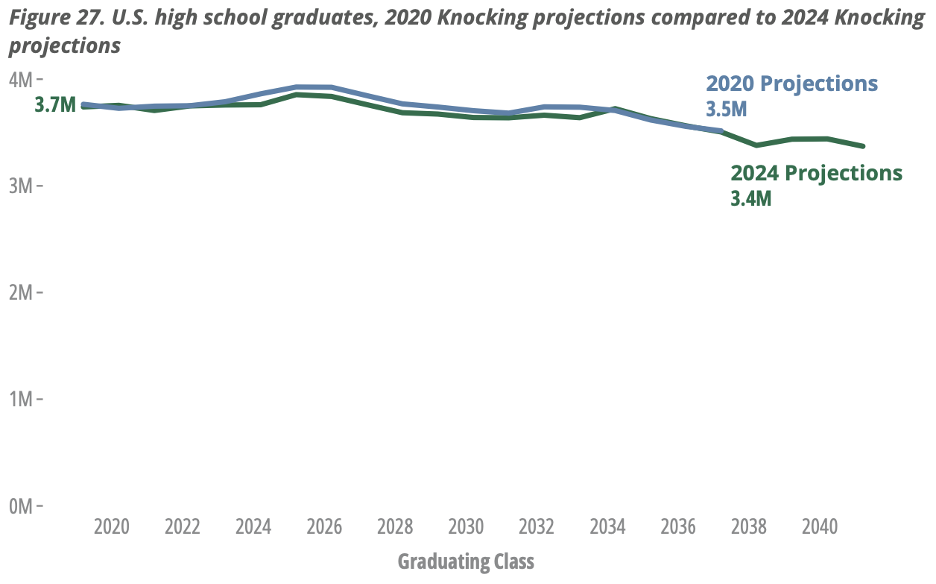
It’s important to note that the researchers believe that the decline in public school enrollments between the 2020 report and the 2024 report is not because students and their families chose private school options instead. The downward shift in enrollments and graduates crosses both sectors. If there was a shift from public to private, it was offset by a shift from private to someplace else.
The researchers write that there are issues with the collection of private school and homeschooled students at the state and federal levels. For example, the federal government has only published private school enrollments for the 2020-21 year, a two-year lag from their public school enrollment data. Despite that delay in reporting, WICHE’s researchers believe the federal government data is more reliable.
WICHE writes that it will continue to analyze the home schooling trends where data is available. The apparent shift to homeschooling does not account for the total drops in enrollment but is important to watch for continuing trends.
Strategies to Meet Future Education and Workforce Challenges
The researchers lead off this section with a statement that the trends described in the 2024 report have been known since the 2012 report. Because of the declining number of births from 2008-2011, the 2025 year represents the peak for high school graduates in the U.S.
“Should higher education policymakers and leaders be concerned about these numbers” is the first question posed by the researchers. They point out that their projections could be subject to shifts in enrollment patterns. They also note that the enrollment of working adults in higher ed institutions might allay some fears. They note that almost two-thirds of all incoming college students are under 25, so recent high school graduates comprise most of the incoming college students.
Higher education policymakers and leaders should be concerned that the pandemic created a longer-term decline in these numbers from the previous (2020) projections. While that is not a short-term concern, it should be considered.
In addition to reengaging adult learners, higher ed leaders should find ways to be more effective at recruiting students currently graduating from high school. Shortages in healthcare, education, and technology sectors will demand more graduates. Institutions will need to meet this demand with new types of credentials and improved efficiency in producing graduates in these fields.
Policymakers and education leaders need to address pandemic-related learning loss and increased chronic absenteeism otherwise the projected number of future graduates will decline more.
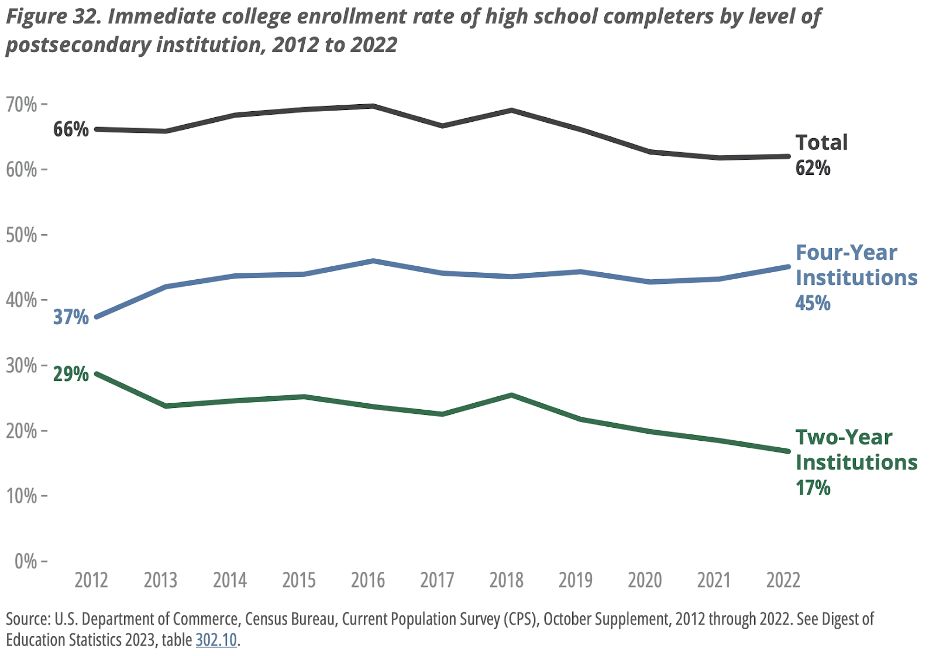
Higher ed leaders should not forget that 2025 is the peak year. The decline will begin to occur next year. However, the college attendance rates for recent high school graduates declined to 62% in 2022 (see Figure 32). To maintain or increase enrollments, colleges will have to address ways to meet the needs of high school graduates who are not choosing college.
All the decline stemmed from the decline in the two-year sector which fell from 29% in 2012 to 17% in 2022.
The researchers cite affordability as a primary concern of students considering college. For adults who never enrolled in college or who stopped out, 85% cited cost as the key reason. While tuition and fees at public institutions have been stable (as have net prices at private institutions), tuition and fees are only 39% of costs at public four year institutions and 20% of costs at public two-year institutions. Large scale programs to improve affordability require substantial investments.
Other programs that could be initiated to improve the percentage (and number) of high school graduates attending college include:
- Enhancing high school advising
- Simplifying the college-going process
- Providing wraparound postsecondary student supports
- Addressing achievement gaps of underrepresented students
- Attracting and retaining adult learners
The researchers conclude by noting that while the rate of decline is slow, the time to act is now. They also write that some states have already experienced declines in high school graduates.
Final Thoughts
If it takes a visual display such as Figure 17 to convince a policymaker that now is the time to act on behalf of their state, that’s great. Sometimes, I wonder if our policymakers are more concerned about expenditures than improving outcomes.
I like the researchers’ ideas about ways to increase the percentage of high school graduates attending college, but there are several other points they made that may be understated. One of those was that the decline in public school graduates was not covered by an increase in private school graduates.
Every state policymaker with a concern about declining high school graduates should consider revamping or improving their collection of data outside of their public schools. The researchers noted that they used the federal government private school data even though it lags the public-school data. State data evidently was collected inconsistently or not at all.
Home schooling was one of the rapidly growing alternatives mentioned by the researchers. It was also not captured anywhere in the report. Charter schools are no longer an insignificant group of education institutions. There is no mention whether charter schools are counted with private schools in most states that fund them or if they’re counted at all. Also, how are virtual charter school students counted versus those who attend traditional charter schools?
There are more states providing Education Savings Accounts (ESA’s). Given that those accounts can cover home schooling costs, charter school costs, private school costs up to a maximum annual amount, I am curious how states track the beneficiaries of those accounts, particularly if they don’t attend public schools.
Despite the efforts of some politicians to turn back time on online education and other non-tradition options, there are multiple education options available to high school and college students.
I applaud WICHE’s steadfast reporting of high school graduates for more than four decades. Assuming they continue working with states to achieve breakthroughs in reporting, I recommend they issue periodic updates instead of waiting for the next four-year cycle to come around. Everyone benefits from more accurate data tracking.