The recent proliferation of articles regarding Congress’s cap on federal student loans, following the passage of the One Big Beautiful Bill, has focused primarily on the impact on graduate students who may not be able to borrow 100 percent of the cost of attendance for their graduate degrees, particularly professional degrees.
I have never been a fan of the Graduate PLUS student loan program. I believe the program has enabled many colleges and universities to raise graduate tuition at rates higher than a market constrained by loan caps, ultimately pushing graduate students into higher loan balances. I have written extensively about the topic, and in October 2024, I posted an article that linked to several other articles about the cost of graduate tuition and borrowing to pay for a graduate degree.
With all the talk about graduate students’ loan programs, it’s important to remember that graduate students represent only about 15 percent of all college students (but 40 percent of all student loan debt). I think it’s time to discuss the federal undergraduate student loan programs.
During the four years of the Biden Administration, President Biden’s political appointees tried to cancel student loan balances for nearly all borrowers and were rebuffed by the Supreme Court. Student loan repayments had been suspended by the Trump Administration due to Covid in 2020, and the Biden Administration continued that suspension during his four-year term. Undergraduate student loans have not escaped my reviews over the years, including a March 2023 article where I recommended changing the loan programs.
A New York Times article published in the summer of 2023 about the Ivy Plus colleges and universities favoring the rich triggered an article that exposed the fact that the Ivy Plus colleges and universities covered 100 percent of the financial needs of lower-income families due to their extremely large endowments and relatively high percentage of full-pay families, not to mention their high selectivity of applicants.
I followed up the article about the Ivy Plus institutions’ affordability with subsequent articles outlining key metrics for:
- Elite private colleges and universities
- Major public universities
- HBCUs
- Top-ranked community colleges
Average Net Price
One of the metrics that I pulled institutional data for each of the five articles mentioned above was the average net price. The Higher Education Act of 1965 (HEA) requires the U.S. Department of Education to post information about the average net price (among other pertinent data) of each institution that participates in Title IV programs (federal financial aid) on its College Navigator website. College Navigator was the source of institutional data for all five of my articles.
The HEA defines average net price as “the average yearly price charged to first-time, full-time undergraduate students receiving student aid at an institution of higher education after deducting such aid.” It is calculated by “subtracting the average amount of federal, state/local government, or institutional grant or scholarship aid from the total cost of attendance.” Total cost of attendance is “the sum of published tuition and required fees (lower of in-district or in-state for public institutions), books and supplies, and the weighted average for room and board and other expenses.”
College Navigator reports the overall average net price for first-time, full-time undergraduates as well as the average net price for family income quintiles that range from:
- $0-$30,000
- $30,001-$48,000
- $48,001-$75,000
- $75,001-$110,000
- $110,001+
Relative Comparisons of Average Net Price
With the family income breaks for the lowest two income quintiles at $0-$30,000 and $30,001-$48,000, I find it hard to believe any families of four in these income brackets can afford to send their child to most colleges unless they receive grants to cover the cost of attendance.
A 2023 report from the Institute for Higher Education Policy (IHEP) found that 90 percent of students who received a federal Pell grant (need-based aid targeted toward the lowest-income families) still had unmet need, compared with 56 percent of students who did not receive Pell grants.
IHEP reported that students from the lowest-income families needed 148% of household income to pay for full-time enrollment at a four-year college, and that Pell recipients had an average unmet need of about $9,800. Meanwhile, IHEP researchers found that students who never received a Pell grant were able to cover the cost of attendance with grants and family money (parents and grandparents), leaving $5,000 in leftover funds.
The National College Attainment Network’s (NCAN) public-sector affordability work found that only 35 percent of public bachelor’s-granting institutions in its 2022–23 sample were affordable under its model. Only 48 percent of community colleges were affordable during the same period. The average affordability gap for bachelor’s-granting institutions was $1,555, and the average affordability gap for community colleges was $486.
An institution can meet NCAN’s affordability criteria if (see diagram below):

Emergency expenses are defined as a flat $300 per year, a small number if you can afford to own a car and need to finance a repair. Federal Work Study (FWS) is calculated as the total FWS expenditures on campus divided by the total number of students receiving FWS payments, which is the institutional average FWS per student. Expected Family Contribution (EFC) is calculated by subtracting the institution’s average Pell grant from the maximum Pell grant. Summer wages are calculated by using the state’s minimum wage rate multiplied by 40 hours/week times 12 weeks.
While these affordability gaps may seem low, it is important to remember that federal loans are included in the funds available formula, as are work study wages and summer wages.
Low Income Net Price Analysis
I used ChatGPT Pro to search the College Scorecard database of colleges and universities participating in the federal student aid (Title IV) programs and select colleges that would vary in their monetary gap between the total cost of attendance and the average (mean) net price for the two lowest income quintiles. Twenty-four colleges and universities were selected. I compared the Net Price data to the data in College Navigator for all twenty-four schools and noted that it matched.
The institutions were sorted in declining order from the highest mean of the average net price for the two lowest income quintiles. For each quintile, the average net price was divided by the upper end of the income range. A column titled Concern Flag was created using the following criteria:
- If the mean of the lowest two quintiles’ average net price was >= $30,000 = Extreme
- If the mean of the lowest two quintiles’ average net price was >=$20,000 = High
- If the mean of the lowest two quintiles’ average net price was >=$10,000 = Moderate
- If the mean of the lowest two quintiles’ average net price was <$10,000 = Lower
As illustrated in the table below, only three colleges were awarded a Lower concern flag. Unfortunately, seven colleges fell into the Extreme category, with the mean of the average net price ranging from $30,838 to $51,476. Even if I used the NCAN affordability criteria, adding together a federal loan ($5,500 cap), work-study wages, and summer wages would not cover these net prices.
When a college’s $0–$30k net price is $20,000, $30,000, or more, the conclusion can only be that the aid package is not remotely “full need” in any practical sense. Needless to say, the outcome of the calculation of net price as a percentage of the upper end of the income quintile was even more depressing for the institutions that fell into the Extreme and High concern categories (see table below).
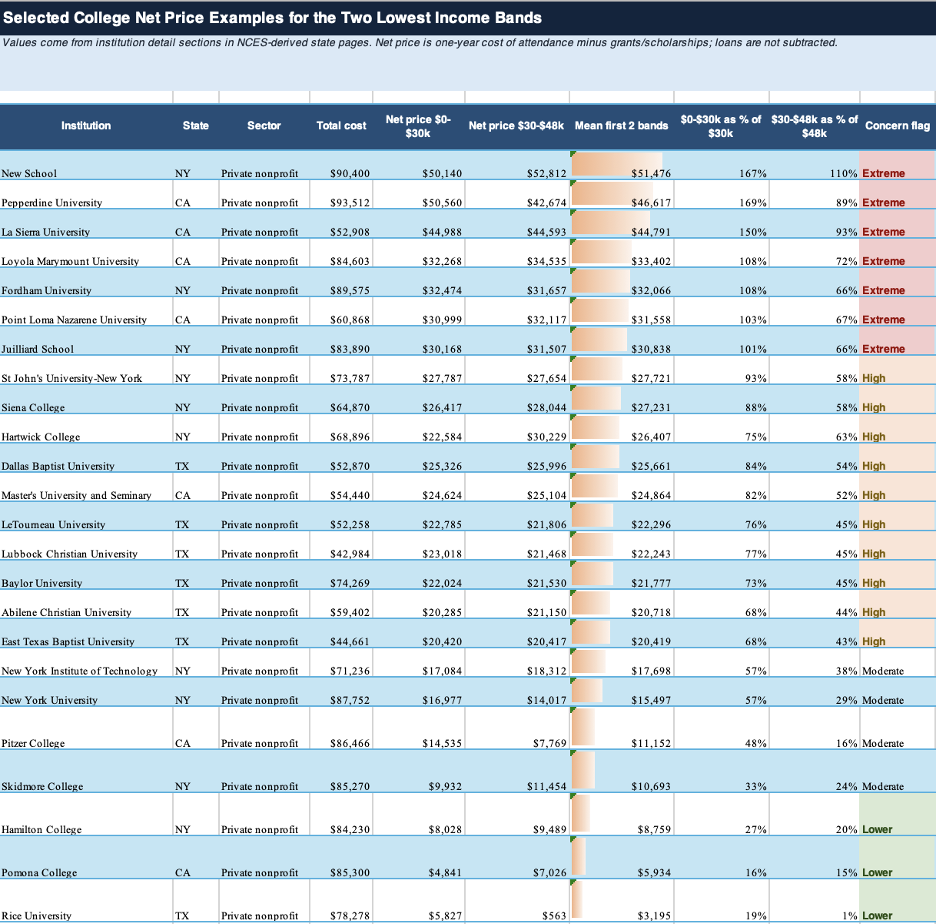
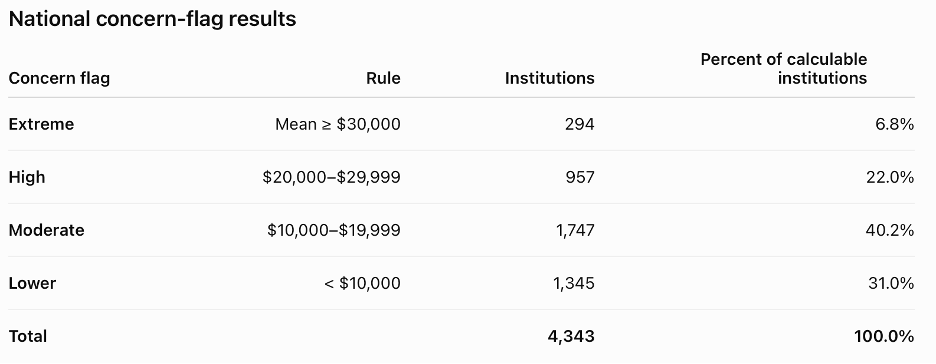
Taking a cue from my recent article about Agentic AI, I prompted ChatGPT Pro to calculate the numbers and percentages of colleges in the entire College Scoreboard CSV file that fell into the Extreme, High, Moderate, and Lower categories. ChatGPT Pro used data from 6,243 currently operating institutions to calculate all the columns in the table above. Only 4,343 institutions provided data from the two lowest income quintiles. The AI derived the table appended below. Note that the combined Extreme plus High group equals 1,251 institutions and represents 28.8% of the calculable group.
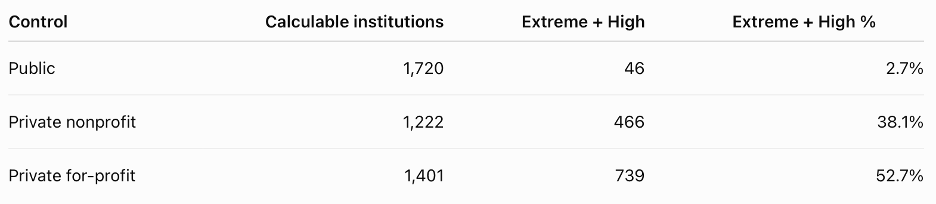
Not surprisingly, public institutions have a far lower percentage of institutions that fall into the Extreme plus High concern group at 2.7 percent (although I should note that the cost of attendance for public institutions only used in-state tuition and some institutions have an out-of-state student population approaching 50 percent). The table appended below illustrates the relative standing of three control sectors, with private for-profit institutions having 52.7 percent of their institutions falling in the Extreme plus High group.
Without a separate prompt from me, the AI also sorted the institutions by primary degree. Not surprisingly (because of the 1,401 private for-profit institutions), the percentage of 1,841 institutions issuing primarily certificates that fell into the Extreme plus High category was 36.1 percent (see table appended below).

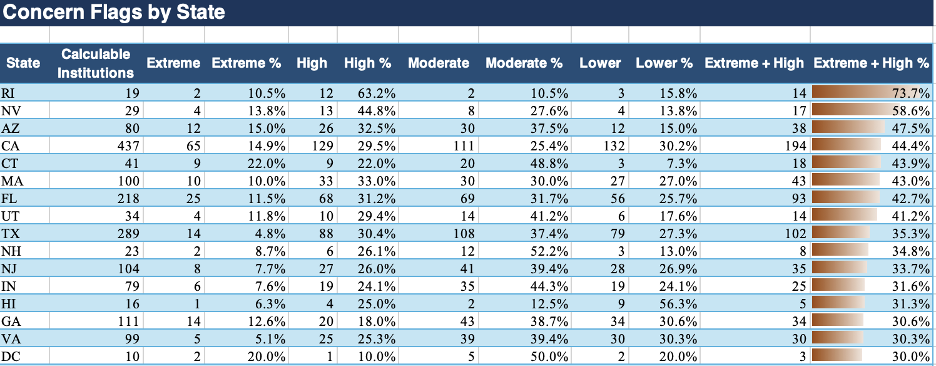
The AI also sorted Extreme plus High institutions by state. I’ve appended a table listing the states from highest to lowest with an Extreme plus High concern percentage of 30 percent or more.
Final Thoughts
The Department of Education has collected and retained vast quantities of student and college data. For data comparability, it likes to keep its sorting categories consistent from year to year. Before I reached any conclusions, I wanted to find a reliable source of data for organizing U.S. family income data. The Bureau of Labor Statistics published a 2024 table that provides quintile data ranges different from those of the Department of Education. Their quintiles are:
- $0-$29,931
- $29,932-$57,451
- $57,452-$94,510
- $94,511-$155,924
- $155,925+
The means incomes for each of these quintiles are:
- $16,658
- $42,925
- $74,474
- $121,548
- $264,510
It’s obvious that the lowest quintile is the only one that closely matches the lower-income quintile used by the Department of Education. After that, the upper limits expand quickly. Quite frankly, if 20 percent of U.S. families fall into the $155,925+ quintile, that could explain how colleges have been able to increase tuition at rates higher than the consumer price index over the years. Nonetheless, I believe those days are over for all but the most selective colleges and universities. At the same time, the Department of Education should update its quintiles, including possibly restating them for a few prior years.
Thanks to state government subsidies, public institutions are the most affordable and least likely (2.7 percent) to have an institution where the gap between total cost and net price for the two lowest income quintiles exceeds $20,000 per year.
If I add admissions selectivity to the College Scorecard dataset, I might be able to refine another theory I have, namely that non-selective institutions allocate financial aid selectively. Looking at the table with the 24 selected institutions, only three were flagged as Lower concerns (less than a $10,000 gap). Those three institutions (Hamilton College, Pomona College, and Rice University) have admissions rates of 14 percent, 7 percent, and 8 percent, respectively.
Congress decided in 1958 to focus on loans as the primary means of financing college for students. Pell grants were established later to cover most of the costs for low-income students. That’s no longer the case, even if a student from a lower-income family attends a public institution and lives at home. Pell grants have been underfunded over the years, particularly in years where Congress attempted to balance the budget. Parent PLUS and Graduate PLUS loan programs were created later.
It would be interesting if Congress were to implement a regulation requiring institutions to offer a financial aid package to all admitted students that meets NCAN’s affordability criteria. I would wager that before we would see a wholesale cut in tuition by many institutions, we would see greater selectivity in admissions, particularly at open-enrollment institutions. Meeting or balancing the NCAN formula requires a low cost of attendance when you have a large percentage of lower-income students. Requiring a formulaic match would introduce more transparency into a process that is fuzzy to many. Beyond that, other considerations are increased admissions selectivity, tuition resets, college failures, or increased lobbying for Congress to substantially increase the maximum Pell grant. Here’s hoping that the numbers of people advocating for higher education affordability outnumber those advocating for expanding loan caps.