It is not difficult to find an article about the looming financial crisis for small private colleges. Whether it’s the impact of the demographic cliff on enrollments, competition-induced tuition discounting, deferred capital maintenance, or a high fixed-cost structure, predictions of colleges in crisis abound.
In December, I wrote about Daniel Greenstein’s analysis of 1,000-plus private colleges and the impact of scale and selectivity on their financial survival. I examined College Navigator data from 13 private colleges and universities that comprise the membership of the Maryland Independent College and University Association (MICUA).
Based on all reports, college enrollments are not increasing for the small private college sector. I decided to revisit the College Navigator data for MICUA members and see what has changed. One caveat is that the Department of Education surveys Title IV-participating institutions several times a year and updates selected portions of the data at different times. There may be some data that matches last December’s data even though another academic year has gone by. There may also be data input or displayed incorrectly. I will attempt to point those out as I review my tables.
Enrollment
I listed the MICUA member institutions and their enrollment totals for undergraduate and graduate students in Table 1 below. The first set of three columns represents Fall 2024 enrollments, the current data provided by College Navigator. The second set of three columns represents Fall 2023 enrollments, the data that was available as of 11/30/25 when I published my previous article.
The means, medians, highs, and lows for the group of 13 excludes Johns Hopkins University for good reason. Hopkins’ graduate student population alone nearly eclipses the combined enrollments of the other 12 colleges and universities.
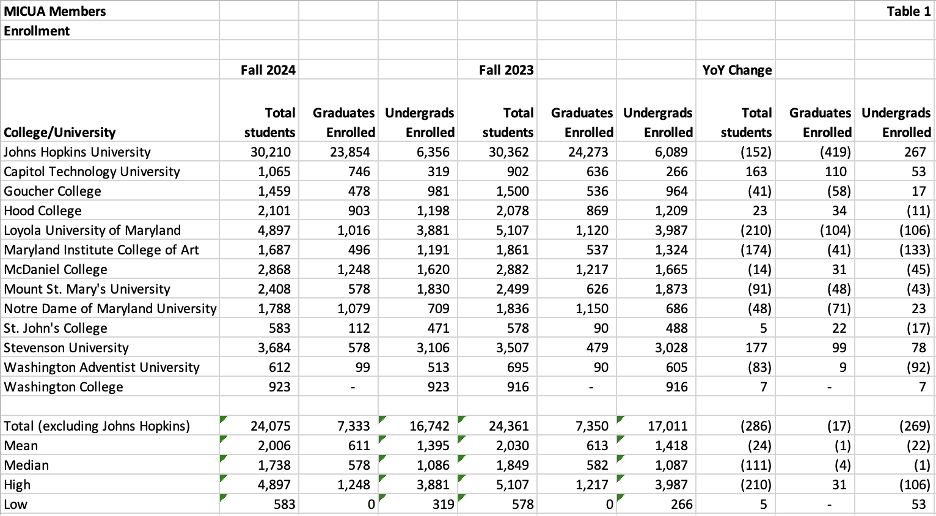
The remaining 12 colleges and universities saw their aggregate enrollments decline by 286 year-over-year, with a decline of 269 undergraduates. The number of grad students enrolled was relatively flat for the group.
Loyola University of Maryland is the largest of the remaining colleges and universities, with a total enrollment of 4,897 in Fall 2024. That number reflects a total decline of 210 students, which is the largest decline of the group of 12 and is spread almost evenly between graduate (104) and undergraduate (106). Maryland Institute College of Art had the second-largest decline with 174 students, split between graduate students (-41) and undergraduate students (-133).
There were only two institutions that grew total enrollments significantly year over year. Capitol Technology University grew total enrollments by 163, split between graduate (+110) and undergraduate (+53). Stevenson University grew total enrollments by 177, split between graduate (+99) and undergraduate (+78). Notably, online graduate students represent 99 percent of Capitol Technology University’s grad enrollments and 89 percent of Stevenson’s grad enrollments.
Admissions Selectivity
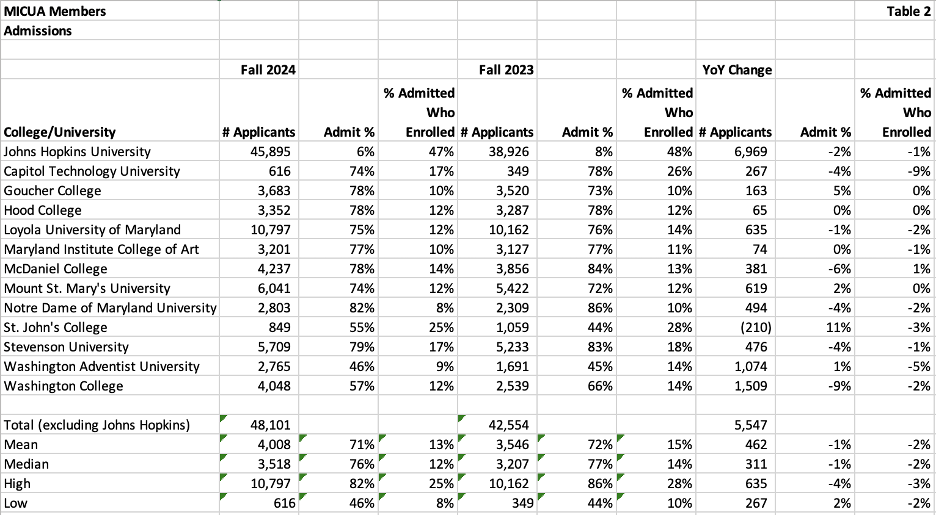
Table 2 below compares the change in application volume, percentage of students admitted, and percentage of admitted students who enrolled on a year-over-year basis (note that the most recent data is for Fall 2024, data from two years ago). The increase in applicants at Johns Hopkins (+6,969) exceeded the aggregate increase in applications for the other 12 schools (+5,547).
The 13 percent increase in applications for the group excluding Hopkins did not impact their selectivity, with the mean acceptance rate of 71 percent only declining by 1 percent. The percentage of those admitted who enrolled declined from 15 percent to 13 percent year over year. A major reason for this increase in applications with no reduction in acceptances can be explained by the forces identified by Geoff Baird and Teege Mettille in their book, The Signal Solution. Thanks to the Common App and direct admissions programs, applications are substantially up and yield is down for most institutions.
Greenstein wrote that “As acceptance rates rise, financial resilience collapses” and that the relationship is not linear but exponential. He added, “Beyond 50% acceptance, the decline becomes a free fall. By the time acceptance exceeds 75%, nearly 9 out of 10 institutions are considered high risk.” Approximately two-thirds of the group of 12 schools have a 75% or greater admit rate and the median for the group is 76%.
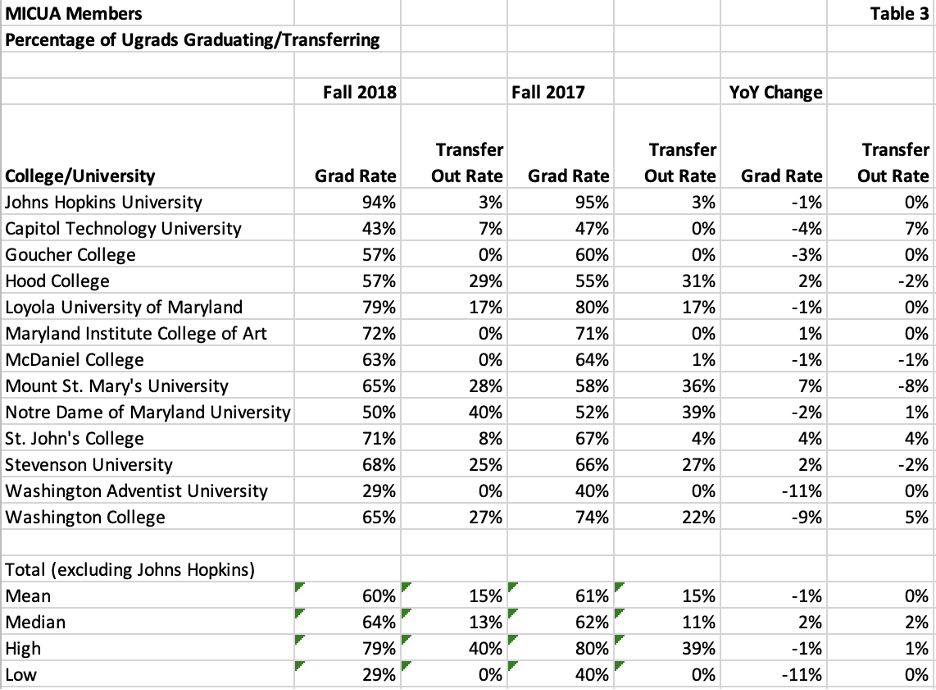
With low selectivity, the first thing that comes to mind is the percentage of students enrolling who graduate. Table 3 below illustrates the percentage of undergraduates who graduated in six years, as well as the percentage of first-year students from that starting cohort who transferred out. The non-JHU group varies significantly, but the year-over-year change is not significant for the group. In the cases of a couple of “major” swings, the percentage is likely high because of enrollments below 1,000 students.
Because the most recent starting date was Fall 2018, any targeted improvements to increase the percentage of students graduating or reduce the percentage of students transferring out have not yet been disclosed. It is more than likely that the senior leadership teams at each of these institutions are aware of these trends and may have processes in place to improve them.
Graduate Student Enrollment and Tuition Revenues
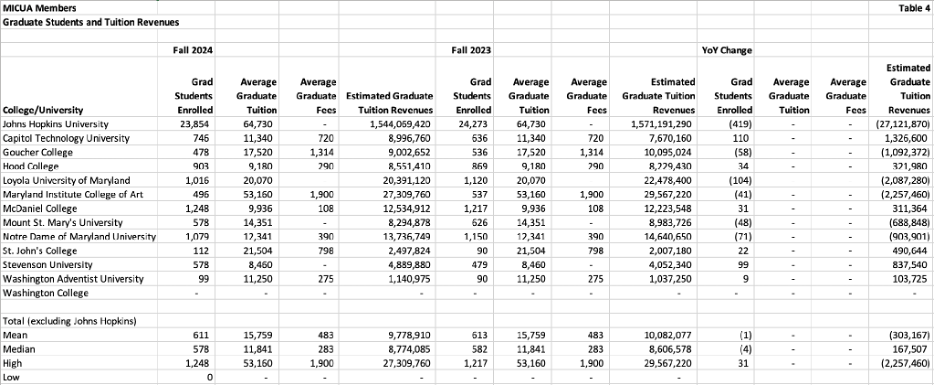
One important item to note is that most of the MICUA institutions have a graduate student enrollment, generating incremental tuition revenues for the institution. Table 4 illustrates the year-over-year impact of graduate tuition revenues for each institution. Note that the year-over-year comparative impact for average tuition per student and average graduate fees per student are zero because the Department of Education has not updated College Navigator’s tuition since November 30, 2025.
Decreases in grad student enrollment negatively impacted several schools. Washington College is the only MICUA school with no graduate programs or students enrolled.
Tuition, Cost of Attendance, and Net Price
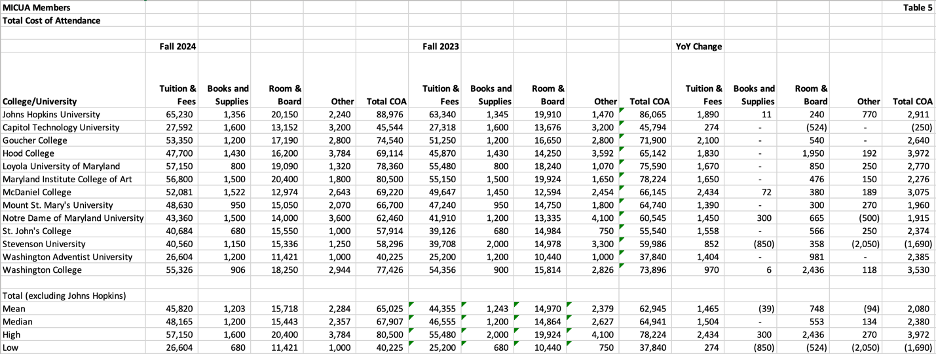
In Table 5, the major components of the published cost of attendance are listed for each institution for Fall 2024 and Fall 2023, the most recent published years in College Navigator. The year-over-year change is also calculated.
As usual, tuition is the largest component in the total cost of attendance. All institutions other than Capitol Technology University and Stevenson University posted aggregate increases in Total Cost of Attendance, with tuition generally comprising the largest single dollar amount increase.
There are “groupings” of Total COA with the following institutions:
- Johns Hopkins University – $90,000
- Goucher College, Loyola University, Maryland Institute College of Art, Washington College – 75,000-79,000
- Hood College, McDaniel College, Mount St. Mary’s University, NDUM – 63,000-69,000
- St. John’s College and Stevenson University – 57,000-58,000
- Capitol Technology University and Washington Adventist University – 40,000-45,000
Without a detailed analysis of admissions and marketing materials, as well as a demographic analysis of enrolling students, it is difficult to explain the differences in Total COA other than that they are likely based on “positioning” each institution to its targeted demographic group.
The published cost of attendance rarely matches the net price. Table 6 compares the total cost of attendance to the overall average net price and the average discount percentage for the last two years, along with the year-over-year change. Note that the average discount percentage is calculated as a percentage of Total COA and not just tuition. The median average net price for the group is $25,705 (this includes room and board and fees).
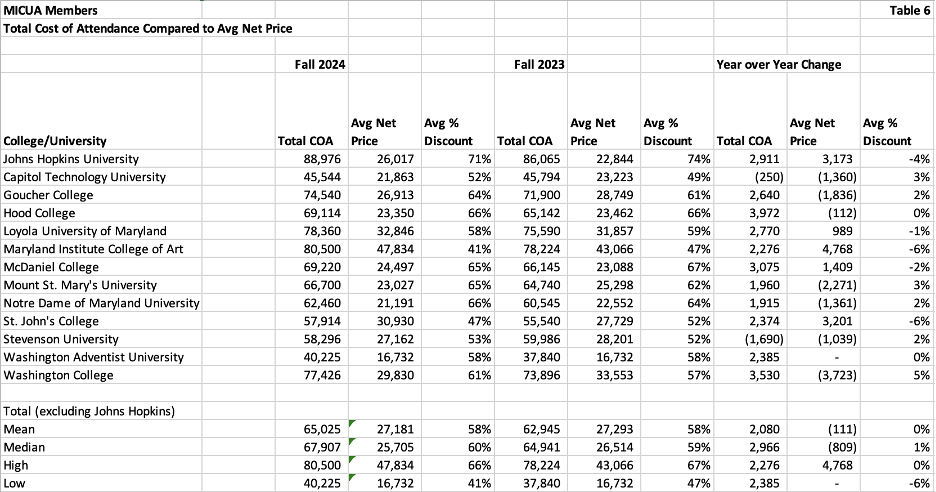
Remember the groupings of institutions based on total cost of attendance? The gaps are much smaller now. The mean average percentage discount for the group is 58 percent with a median of 60 percent. Those percentages were approximately the same as the previous year, but the individual changes in average net price are across the board. A negative change in average net price indicates that an institution is receiving less cash per student. Seven of the twelve institutions (excluding JHU) had negative changes in average net price.
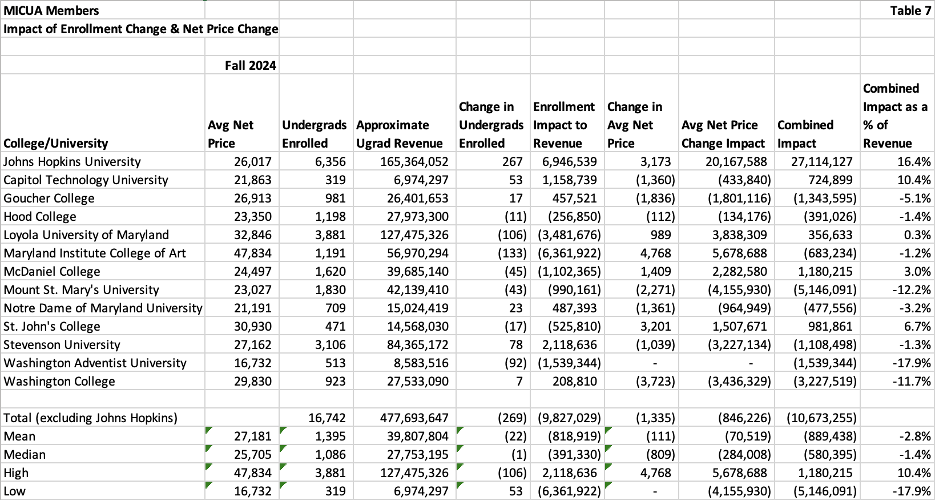
When undergraduate enrollments are increasing, a negative change in average net price may be okay. Table 7 below calculates the impact of enrollment changes and changes in average net price for each of the institutions in this group. Excluding Johns Hopkins, the overall decline in undergrads enrolled impacted the group’s revenue by $9,827,029. The decrease in average net price due to an increase in the average discount rate impacted the group by $10,673,355.
Reviewing individual schools, the results vary widely. Hopkins, the most selective institution with the largest undergraduate enrollment, increased revenue by 16.4 percent, driven by higher undergraduate enrollment and average net price.
Mount St. Mary’s University, with a decline of 43 undergrads, was negatively impacted overall by 12.2 percent due to a $2,271 decrease in average net price. Washington College maintained its enrollment (+7), but a decline in average net price impacted its revenues by 11.7 percent. McDaniel College experienced a decline of 45 undergrads, but with an increase of $1,409 in average net price, its revenues increased 3 percent.
Maryland Institute College of Art experienced a decline of 133 students, impacting its revenue by approximately $6.3 million. However, it managed to increase its average net price by $4,768, resulting in a positive and nearly offsetting impact of $5.7 million.
Undergraduate enrollment at these private colleges and universities is campus-based, so adjusting expenses to offset declines in net revenues is not easy. Given that the enrollment and tuition data are two years old, only the institutions know how well they have managed through an ongoing demographic cliff impacting enrollment, as well as a very competitive environment impacting the average tuition discount rate.
A Few More Thoughts
Most colleges must be resourceful these days to survive, let alone thrive. You don’t have to have an MBA to realize that small, declining enrollments combined with higher tuition discount rates leading to lower average net prices are a disastrous combination.
The aggregate decline in undergraduate enrollment had a bigger impact on the MICUA members (excluding JHU) than the decline in average net price. While the median impact was a decline of 1.4% in revenues, three institutions experienced double-digit declines in revenue. One of those three institutions held its average net price flat but could not maintain its enrollment. The other two institutions held enrollment flat, but at a cost of decreases in average net price that caused the double-digit decline in revenues. It’s important to remember that the average net price differs from the average net price by income quintile. Usually, but not always, the highest income quintile has an average net price that is higher than the overall average net price. Depending on how much merit aid an institution is awarding to attract higher income students, the discount for the highest bracket may be more than the overall average.
One point Daniel Greenstein made in his original analysis was that by the time acceptance rates reach 75 percent, nine out of ten institutions are at high financial risk. The admissions data for these institutions is two years old. Approximately two-thirds of MICUA institutions had acceptance rates around 75 percent. Given the impact of the demographic cliff on eligible students and the widespread use of tuition discounting to attract students, most of these schools will have to fight to maintain aggregate net revenues, let alone increase them at a high enough rate to cover rising expenses.
Most of the colleges in this group have enrolled graduate students to increase revenues. Almost all have added business programs to their traditional liberal arts programs to attract new students. Tuition resets, in which the college deliberately cuts its tuition across the board (and the size of its merit aid awards), are increasing, according to a recent Wall Street Journal article. Some private colleges are offering in-state students an “in-state” rate to be a more price-competitive option.
Small college presidents facing enrollment and tuition-discounting issues have a daunting challenge. If they raise their price, they risk decreasing their yield. If they cut prices, they erode their margin. Highly selective institutions like Johns Hopkins don’t have those risks.
With the demographic cliff projected to continue for more than a decade, predictions of increased college closures are likely to be realized. Navigating the minefields won’t be easy.