
I received a LinkedIn email notification from a good friend and former colleague last week. He asked me if I had seen a LinkedIn post from one of our former colleagues that referenced an article on the New America website.
The article was titled The Subprime PLUS Loan Crisis: How Dozens of Universities Steer Low Income Families to Debt They Can’t Afford. I was familiar with the situation from several articles that I had written about the net price of college. He suggested that reading and following up on the article might be a good post for my blog. I agreed.
New America’s Article
Written by Stephen Burd and published on February 10, 2026, the article provides insights into financial aid policies at 41 private and public universities. Mr. Burd opens his article by describing how public flagship and research universities in the South are thriving by increasing undergraduate student enrollment every year.
Unlike others who believe that warm weather and major college football tailgates are luring students from the Northeast to enroll, Mr. Burd writes that many of the Southern universities “are spending tens of millions of dollars each year to reel in affluent students from around the country.” Those dollars come in the form of merit aid scholarships to attract affluent students.
Mr. Burd states that there is another side to the story. While wealthy students are being granted merit aid, the colleges recruiting them are pressuring lower-income families to take on debt they cannot repay. Furthermore, these universities are using enrollment management consultants to optimize their financial aid awards, enabling them to enroll diverse student groups without spending more than necessary.
Burd adds that selective colleges offer the largest tuition discounts to the most desirable students, those who can help the schools rise in the U.S. News & World Report rankings. If they happen to be wealthy, even better, since their tuition, room and board payments can boost the bottom line of the university.
Lower-income students will receive aid, but it will not be enough to meet their financial needs. The only choice they have is to borrow federal Parent PLUS loans to cover the funding gaps. As he points out, Parent PLUS loans cannot be discharged in bankruptcy (since the federal government funds them) and are subject to wage garnishment and garnishment of Social Security benefits. Failure to repay them leads to a horrible financial situation for older Americans.
Mr. Burd writes that some selective colleges use these financial aid-leveraging strategies only for a subset of their students. He adds that other selective colleges are committed to meeting the full financial needs of their students and usually direct a portion of the revenue that they receive from wealthy students to fund need-based aid.
Referencing an October 2021 Wall Street Journal article, Mr. Burd adds that several selective universities were exposed for their practices of directing parents of low-income students to use Parent PLUS loans to fund the gap between the total cost of attendance and the grant aid (federal, state, and institutional) provided.
The Wall Street Journal article cited the release of data from the U.S. Department of Education that included Parent PLUS repayment rates for all schools, including 55 nonprofit universities with endowments exceeding $1 billion. While 50% of parents at the wealthy schools had begun repaying those loans, the average repayment rate was 39%. The article continued with a finding that “nationwide, the schools with the worst Parent PLUS repayment rates tended to be those with few resources to help out poor families, such as historically Black colleges and universities (HBCUs).”
I wrote about the Wall Street Journal (WSJ) article referenced by Mr. Burd, as well as a subsequent WSJ article published in December 2021. I commented that it was clear institutions were benefiting from these PLUS programs at the expense of students and their families. I added that the College Scorecard and other sources should publish the amount of Parent PLUS loan debts incurred by parents of students at each institution. I also suggested that students consider a lower-priced option when choosing a college.
Mr. Burd noted that last year, he wrote a paper titled A Case of Predatory Inclusion at Baylor University. The paper examined the 2021 Wall Street Journal article and how Baylor changed its aid policies since it was published. He argued that financial aid leveraging strategies promoted by firms like EAB and Ruffalo Noel Levitz push their clients to engage in a process of predatory inclusion. He defines predatory inclusion as a process “when a marginalized group is given access to a service, good, or opportunity, but the conditions of access jeopardize the benefits.”
For his current paper, Mr. Burd wanted to identify universities “that appear to be the most aggressive in leveraging their financial aid and pushing low-income families to borrow PLUS loans they cannot afford. Because he recognized that there are affluent schools with lower endowments “that leverage the bulk of their aid,” Mr. Burd only included private colleges with endowment balances of at least $500 million.
Burd also looked at 20 years of institutional financial aid data from public universities to identify schools with the most aggressive financial aid-leveraging policies. He also examined my favorite financial aid indicator: the average net price by income quintile data reported to IPEDS, published in College Navigator.
Ultimately, Burd identified 41 universities that spent $2.4 billion in financial aid on wealthy students who did not need it. More than 32,000 families of Pell grant recipients were stuck with Parent PLUS loans they signed to send their children to these 41 universities.
Furthermore, he wrote that these 41 universities only met 74% of the financial need of their first-year students and charged families with annual incomes of $30,000 or less an average net price of $18,000.
Mr. Burd recommends several changes to the Parent PLUS program. He would add an “ability to pay measure” that would prevent parents from borrowing beyond their means. He also recommends that colleges have “skin in the game,” so that they are held accountable if many former parents are unable to repay their loans.
My Previous Findings
In 2023, I published a series of articles that grouped colleges and universities and looked at their financial aid funding practices. My groupings included Ivy Plus Colleges and Universities, Elite Private Colleges (one of the groups that Mr. Burd analyzed – my grouping includes more elite colleges than universities), Major Public Universities (the other group Mr. Burd analyzed), HBCUs, and Community Colleges.
The financial aid practice that Mr. Burd attributes to 41 private and public universities with endowment balances greater than $500 million is endemic. I will republish a table using average net pricing data for each of those groups. Most of my data has not been updated since I published these articles in the summer of 2023. I believe the Ivy Plus data is more up-to-date. Because of different access dates, none of this data may match Mr. Burd’s, but it should be relatively close.
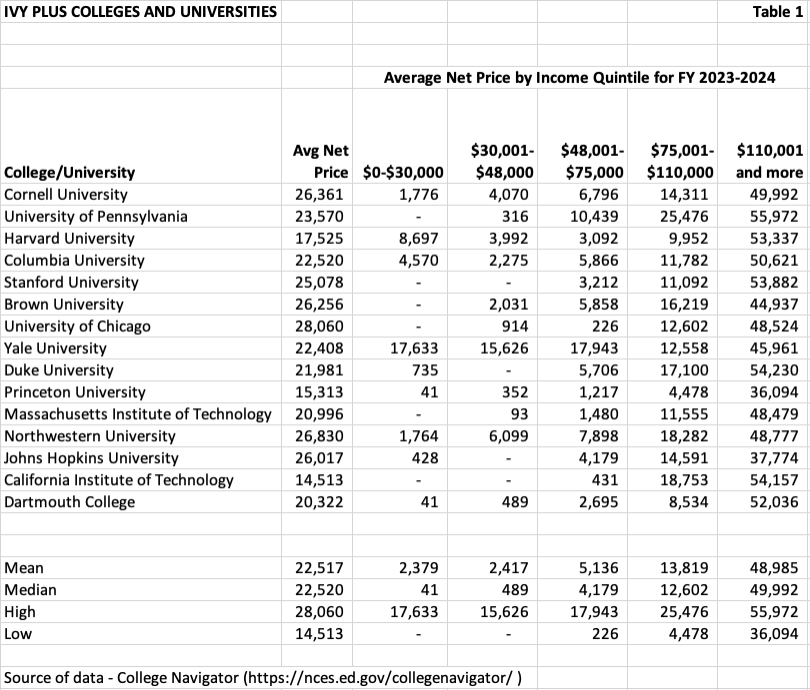
Ivy Plus Colleges and Universities
The Ivy Plus Colleges and Universities are arguably the most selective, charge high tuition, and have huge endowments. Table 1 below shows that their financial aid policies do not require lower-income families to use Parent PLUS loans. In fact, all of them have policies that do not require student loans for families with incomes below a specific amount, say $100,000 to $200,000.
The median average net price of the Ivy Plus universities for the two lowest income quintiles is essentially zero. It increases to $4,179 for the $48,001- $75,000 quintile and to $12,602 for the $75,001- $110,000 quintile. Even the highest quintile ($110,001+) has a median of $49,992, an amount substantially less than the group’s average total cost of attendance.
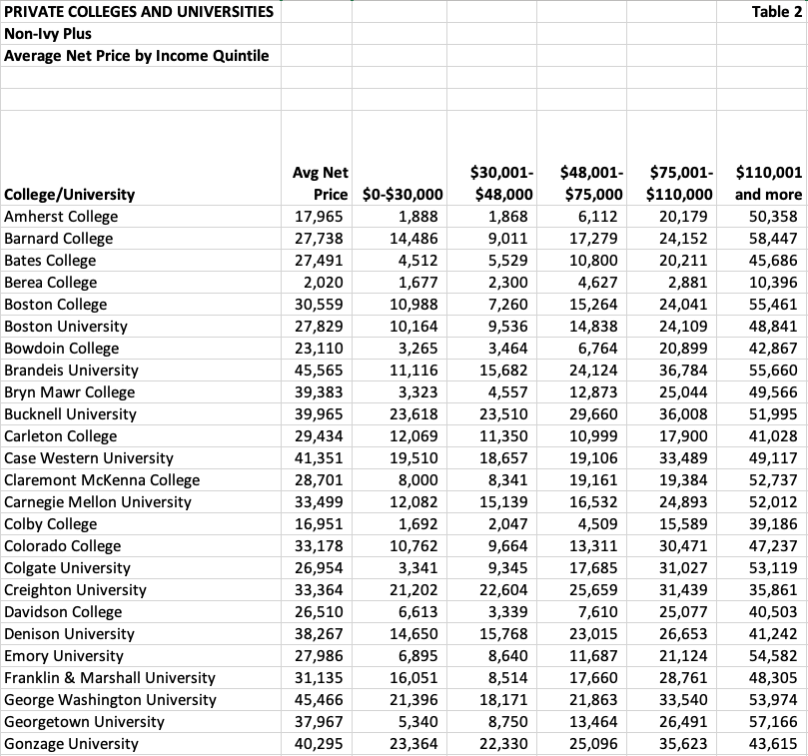
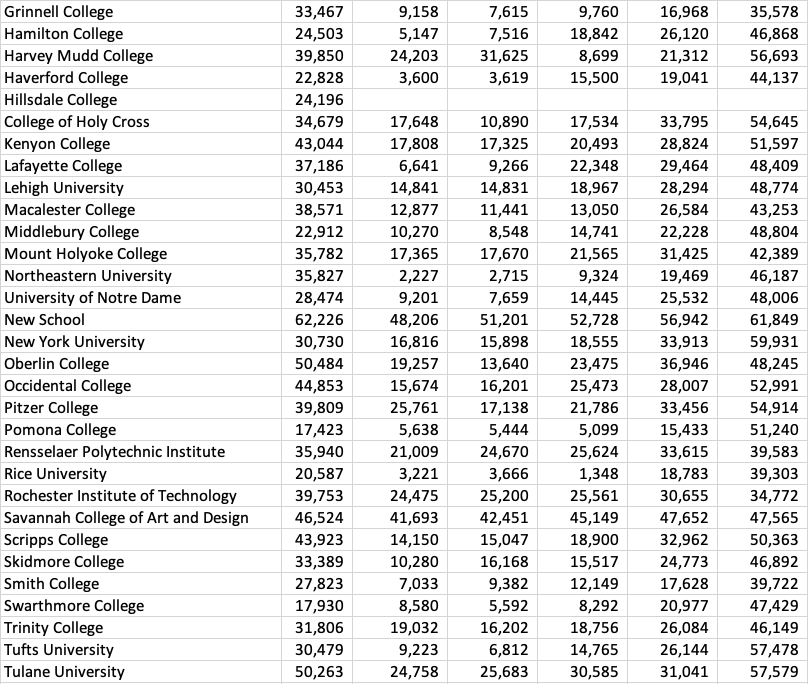
Elite Private Colleges and Universities
Table 2 includes a mix of colleges and universities ranked on various Top 50 lists. The average net price median of $31,471 is approximately 50 percent higher than the average net price median of $22,520 for the Ivy Plus colleges and universities.
The more significant differences are in the average net price for the lowest-income quintiles. While the median for the Ivy Plus group for students with family incomes $30,000 or less was $41, the median for this group is $11,008. Many of these institutions educate traditional students who are likely dependents, meaning that their annual federal loan cap is $5,500. Assuming the families of the students in this group do not have any cash to fund an elite education, a Parent PLUS loan would be required to cover the remaining cost not financed by a federally subsidized loan.
Each of the next three income quintiles is much higher than the Ivy Plus group. Depending on your perspective regarding the affordability of college, the median numbers for this group indicate financial aid policies that do not meet 100 percent of the financial needs of students.
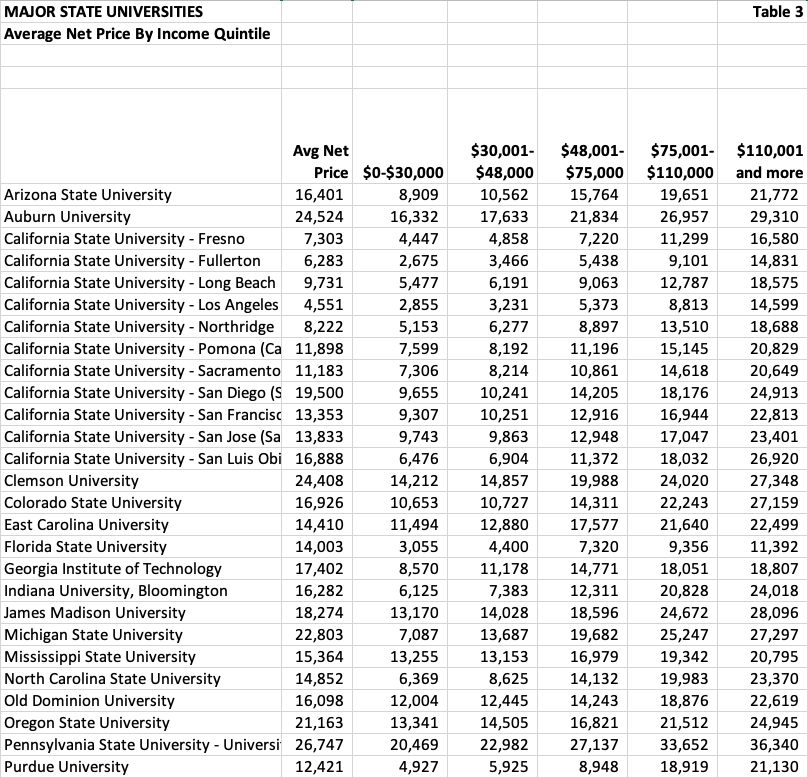
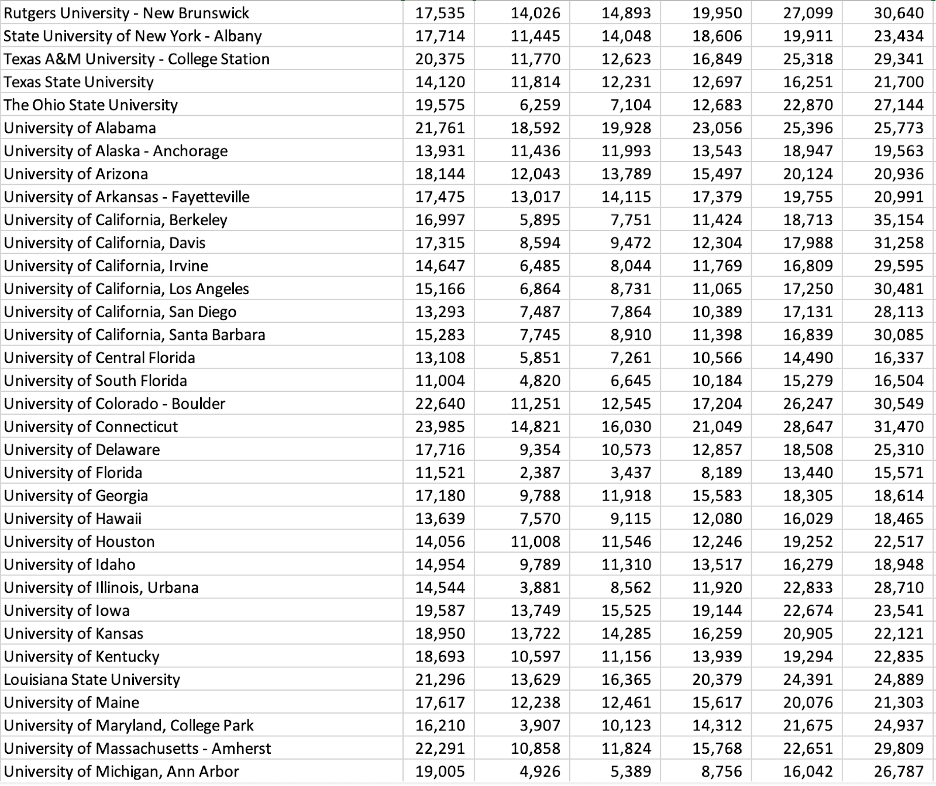
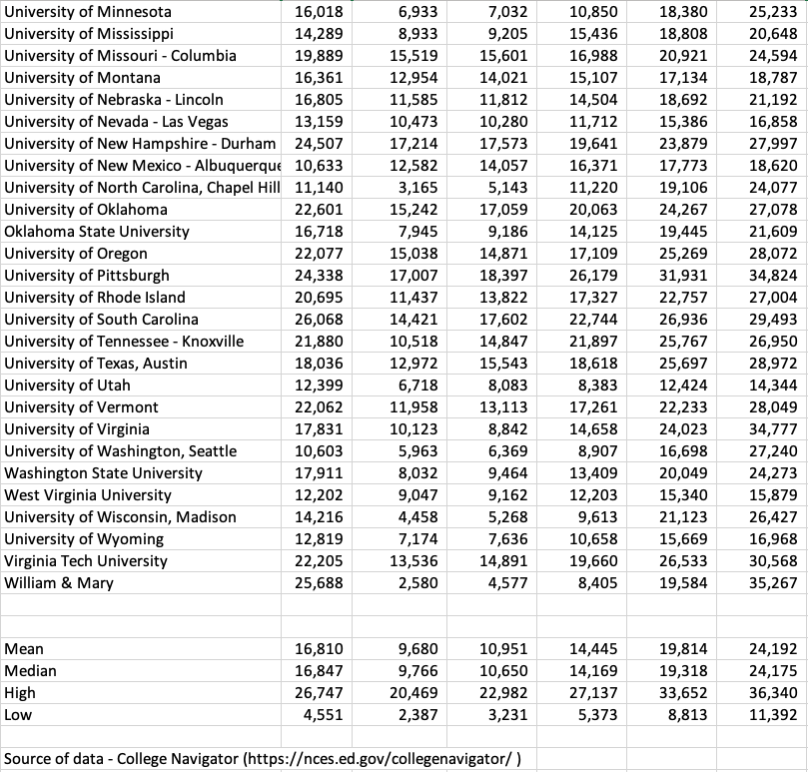
Major Public Universities
Table 3 provides the average net price and the average net price by income quintile for the Major Public Universities I selected in 2023. One significant point to note is that the average net price published in College Navigator is for full-time, in-state, beginning students. Their cost of attendance (COA) will be lower than the out-of-state students’ COA described by Mr. Burd. Out-of-state students are likely to have a higher average net price, but College Navigator does not publish that figure.
The average net price for in-state students at the public universities I selected is less than the average net price for the elite colleges and universities. The medians for all the income quintiles are lower as well. However, it’s important to note that this group’s median average net price for the $30,000 and less quintile exceeds the federally subsidized loan caps.
Parents who are unable to find cash will have to use Parent PLUS loans to fill the gap that federally subsidized loans do not cover. Mr. Burd’s argument that these colleges are offering merit aid to attract wealthy out-of-state students at a cost to lower-income students is confirmed.
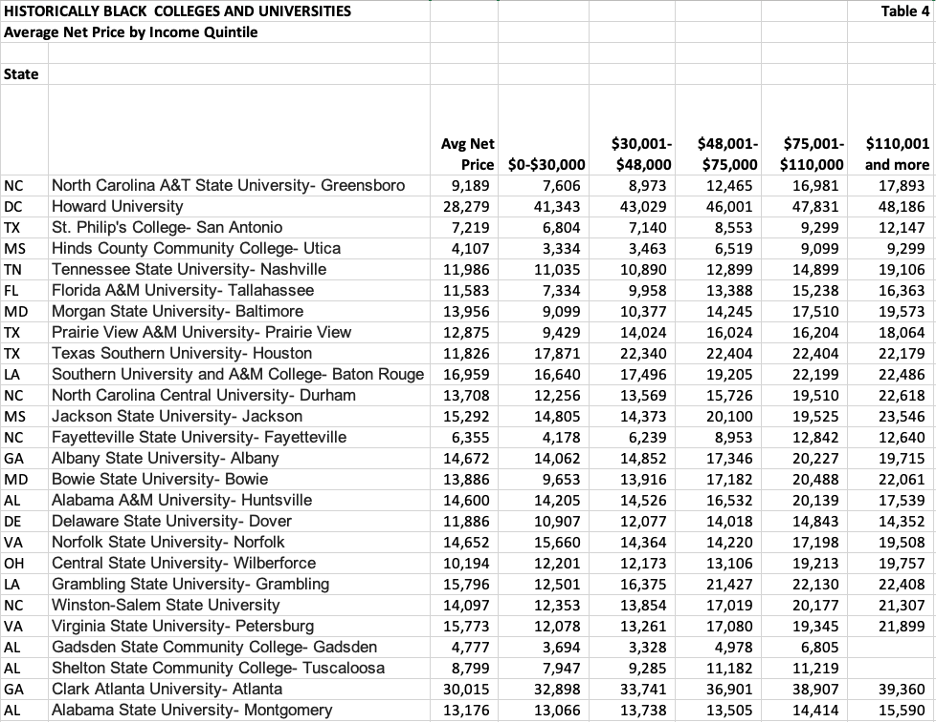
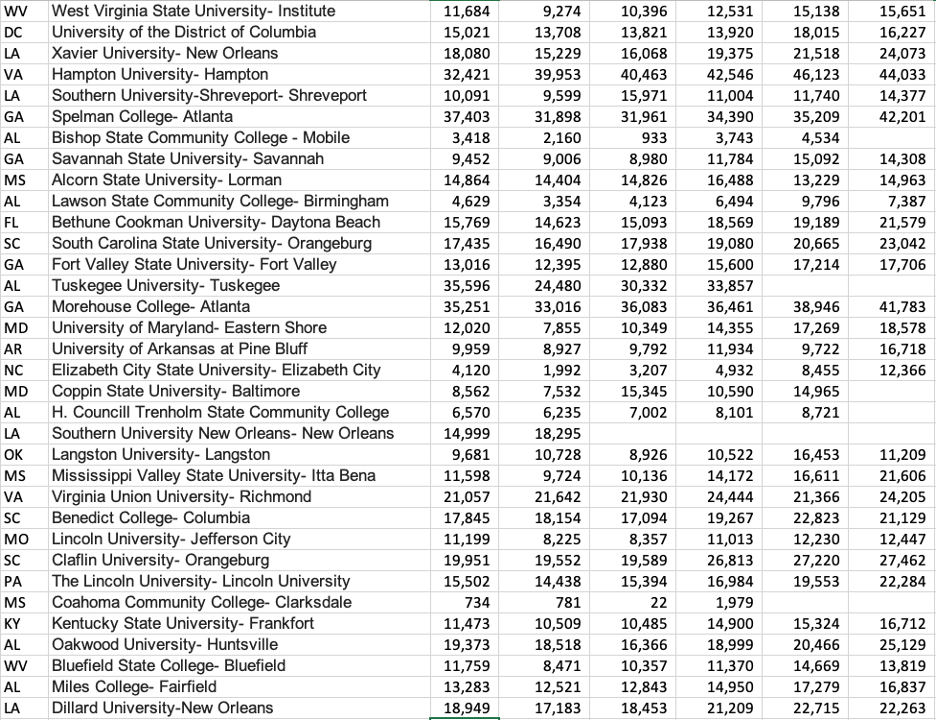
HBCUs
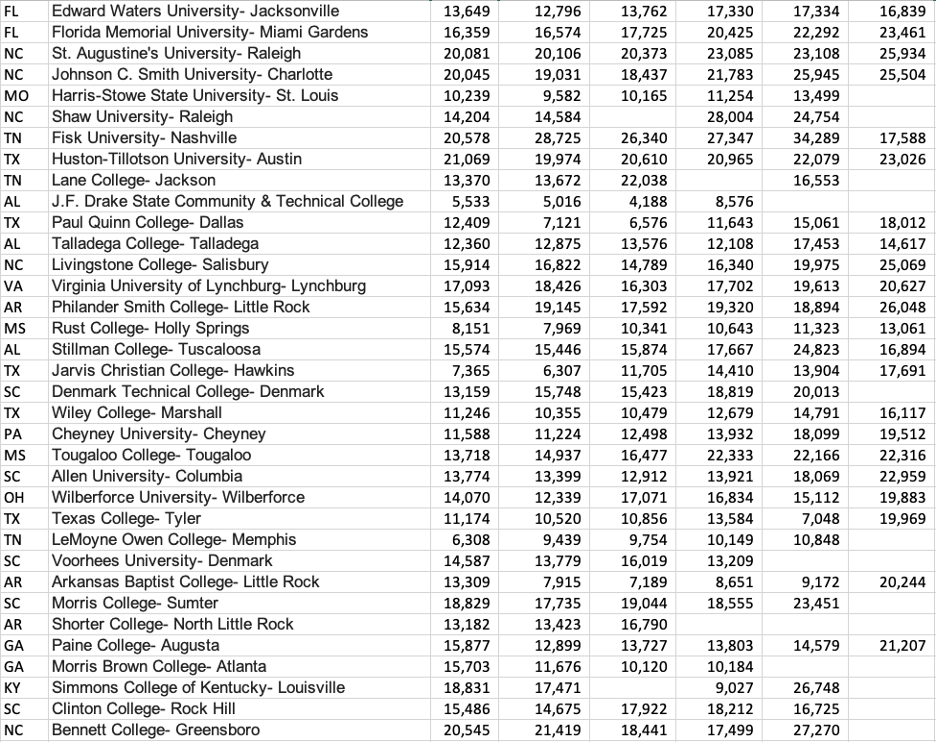
Table 4 includes the average net price and average net price per income quintile for all HBCUs in the U.S. A weakness of this grouping is that it includes both state colleges and universities and private colleges and universities. That mix could lower the mean and median across all categories, since the College Navigator data for public colleges reflect the in-state cost of attendance.
While the median average net price is lower than the median for the major public universities in Table 3, the median for the lowest-income quintile of $30,000 or less is $12,796, which is higher than the public university mean of $9,766. Again, almost all of the colleges and universities in this group have an average net price that will require the lowest-income students to use Parent PLUS loans (eight colleges have an average net price below $5,500, which would not require a student to use a Parent PLUS loan).
HBCUs have been historically underfunded in most states. In fact, they receive special institutional funding under Title IV. However, their average net prices are not significantly higher than those of the major public universities that are better funded and have more established brands that attract wealthy students.
A datapoint should be noted that has not occurred in the three previous groups. Six of the HBCUs have blanks in the highest income quintiles. That indicates that none of their students come from families with incomes in that bracket. It’s another indication of the population demographics that those six institutions serve.
Community Colleges
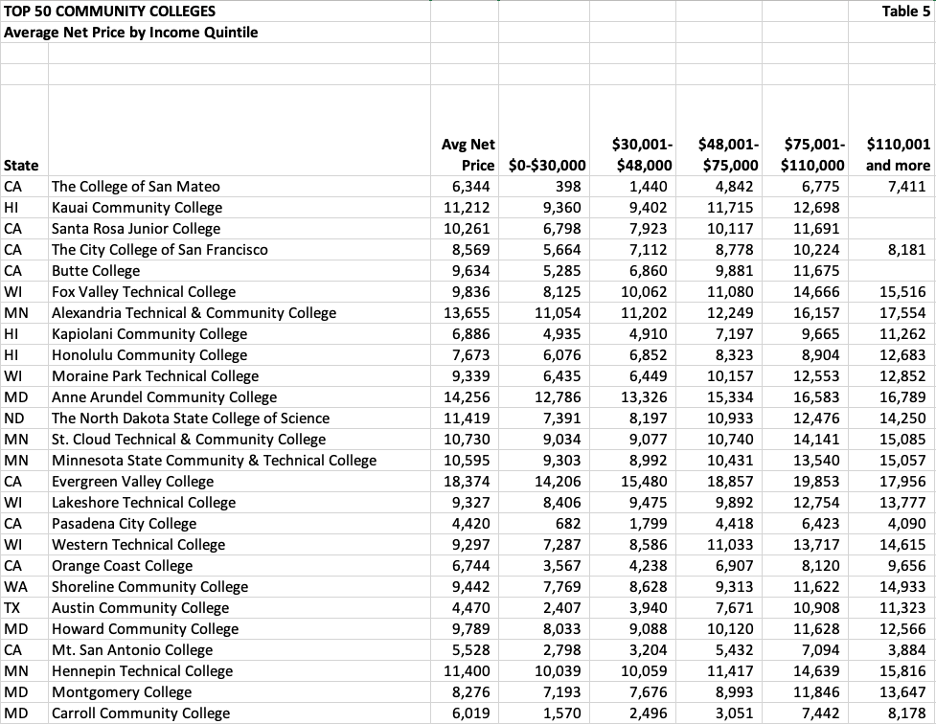
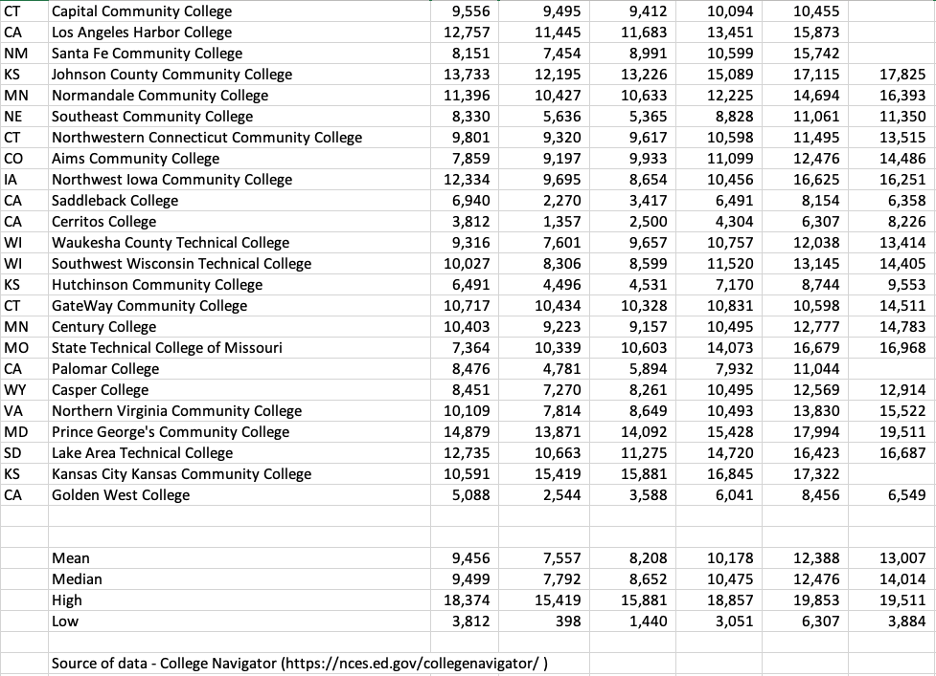
Table 5 provides the average net price per income quintile for the Top 50 community colleges. The group has the lowest overall net average price with a median of $9,499. That reflects the affordable tuition they charge, thanks to state subsidies. However, the median average net price for the lowest-income quintiles at these community colleges is higher than that of the Ivy Plus institutions. That’s because they do not have the generous financial aid policies and the endowments that fund them.
Theoretically, the median average net price of $7,792 for the $30,000 and less income quintile would require a community college student to fund the gap with Parent PLUS loans. However, the average net price is calculated by subtracting all grants from the weighted average cost of attendance.
While many community college students are commuters, costs of housing and other costs are included in an off-campus student profile. For a community college student with a full-time job who lives with their parents or lives in an apartment, the cost of attendance other than tuition is not an incremental cost of attendance. These students may not have to borrow, but that scenario is not reflected in the average net price calculation.
There are approximately 1,000 community colleges in the U.S., and roughly 20 percent do not participate in federal loan programs. One explanation is that Pell Grants will cover the expected cost of attendance for a student attending that institution and living at home. In the article that I published in 2023, I had a table listing the percentage of students at those community colleges who borrowed federal loans. The median was 7 percent with a mean of 12 percent.
Average Net Price Weightings
As I reviewed the data from my groupings of colleges and universities, I realized there was another observation to make.
I created five tables of the statistical summaries from each of the tables above. I have numbered and listed the tables from the lowest average net price for the grouping to the highest (the far left-hand column of numbers in each table).
I highlighted the median average net price, then the income quintile cells (or the single cell in one case) that the median average net price fell between or landed on. It’s important to note that the income quintiles are fixed brackets determined by the Department of Education. The number of students in each quintile varies and affects the institution’s average net price, depending on where the student concentration (weighting) is located.
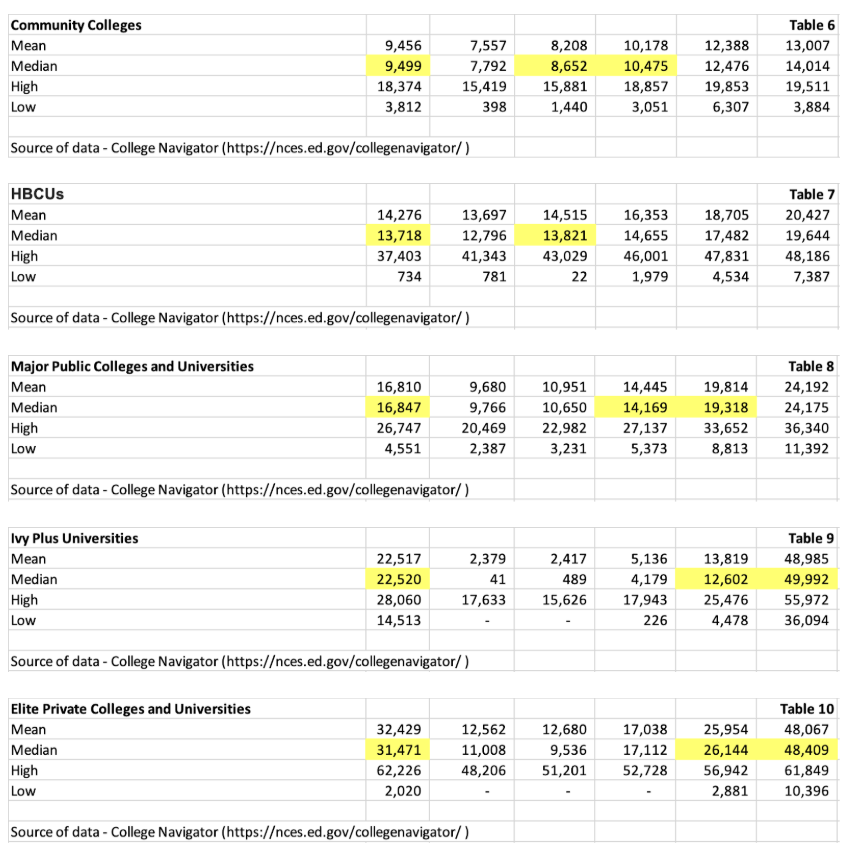
It’s no surprise that community colleges (Table 6 below) have the lowest median average net price (ANP) of $9,499. That ANP falls between the second-lowest and middle income quintiles.
HBCUs, a group that includes both state and private institutions (Table 7), have the second-lowest median average net price of $13,718. That ANP hits squarely on the average net price for the second-lowest ($30,001-$48,000) income quintile, implying that HBCUs serve a lower-income population than community colleges.
It’s not a surprise that major public universities (Table 8) have a median average net price of $16,847. That ANP falls between the third and fourth income quintile. That weighting may support Mr. Burd’s claim that the major public (and private) universities recruit wealthy students, or it may indicate that students from lower-income families choose to attend more affordable community colleges or HBCUs.
The fifteen Ivy Plus universities (Table 9) have the second-highest median average net price of $22,520. The average median ANP falls between the second-highest and highest income quintiles and aligns closer to the lower average of the fourth. Clearly, the large endowments and generous financial aid policies of this group enable the need blind admissions policies that most, if not all, have embraced.
The Elite Private Colleges and Universities (Table 10) have the highest median average net price of $31,471. While that ANP also falls between the fourth and fifth income quintile (like the Ivy Plus), the median average net price for the fifth (and highest) income quintile for the elite private colleges and universities is more than double the median average net price for the Ivy Plus institutions but it is about the same as the highest income quintile for the Ivy Plus group. The explanation lies in the fourth income quintile, where the ANP for the Ivy Plus group is $12,602 and for the Elite group is $26,144. That illustrates the power of the higher average endowment balances for the Ivy Plus group.
Final Thoughts
Mr. Burd made two recommendations from his analysis that I thought were outstanding. First, he would add an “ability to pay measure” that would prevent parents from borrowing beyond their means. Second, he recommends that colleges have “skin in the game” so that they are held accountable if former parents are unable to repay their Parent PLUS loans.
After reviewing the data in Tables 1 through 10, I’m not sure what the consequences would be if these recommendations were implemented. If the first recommendation is codified into regulations or laws, it would limit enrollment opportunities for many lower-income students to attend community colleges or the wealthiest institutions (assuming they qualify for their highly selective admissions). Unless Pell Grants are increased substantially, many lower-income families cannot afford to borrow for college.
If the second recommendation of “skin in the game” is implemented, wealthier institutions can afford to pay but may also choose not to participate in the Parent PLUS programs, leaving a lower-income family with no options to cover the gap between the ANP and the federal loan cap for first-year, full-time students. HBCUs would take a hit in enrollment, and some would likely close.
Part of the problem with any analysis of the adequacy of financial aid programs and policies is that the Total Cost of Attendance, as defined by the Department of Education, includes room and board or off-campus housing, as well as other living costs, in addition to tuition and fees. I do not believe that the maximum Pell Grant awards and the maximum federal loan amounts for undergraduates have kept up with the increases in room and board charges on campus or off-campus housing and other costs. I have known families whose children received full-tuition scholarships to major colleges and universities and could not afford the out-of-pocket expenses of on-campus room and board without taking out a Parent PLUS loan.
I hoped that Congress would eliminate the Parent PLUS loans when they made several budgetary adjustments through the One Big, Beautiful Bill last summer. I was aware that eliminating the program would impact institutions, but the discussion and passage of language in that bill would have alerted our politicians to the inadequacy of financial support for our lowest-income families.
I continue to believe that providing a quality education (including training) to all citizens is the great differentiator for a successful democracy. Mr. Burd’s analysis was useful, but it ignored the problems with the PLUS loans for all but the wealthiest institutions. We need an overhaul of our financial aid programs, and in many cases, that could include changes to some of our colleges’ business models. Kicking the problem down the road by merely capping the Parent PLUS loans is not a solution.