[Note: This article follows some of the format from three previous articles commenting on Daniel Greenstein’s analysis of more than 1,000 private colleges across the U.S., and my thoughts about his analysis utilizing data from 15 private colleges and universities in Maryland, 24 private colleges in Virginia, and 30 private colleges and universities in Florida. I opted to create additional data tables for 77 private colleges and universities in Pennsylvania to identify similarities and/or differences.
The Fragility of Small Scale
In October 2025, Daniel Greenstein (Chancellor Emeritus of PASSHE) published Part 1 of a three-part series about the financial status of public and private institutions. Titled The Fragility of Small Scale, Mr. Greenstein used an “analytical engine” to look at data from 2010 to 2023 to evaluate the financial trajectory of an institution.
A sentence in the introductory paragraph could have been the lead line, stating, “Below about 2,500 students, fragility becomes structural.” Mr. Greenstein wrote that 70-75% of the private colleges whose enrollments are below 2,500 fall into the highest risk category; between 2,500 and 5,000, the risk falls to 60%; at 10,000-20,000, the risk falls to 30%; and above 50,000, it falls to less than 15%.
Greenstein wrote that small colleges don’t fail because they’re poorly managed. He blames most failures on “unforgiving economics.” He further wrote that “the fixed costs of accreditation, compliance, technology, student services, and marketing vary only marginally with small size.” The smaller the student enrollment that these costs are spread across, the more any financial issue can have catastrophic consequences.
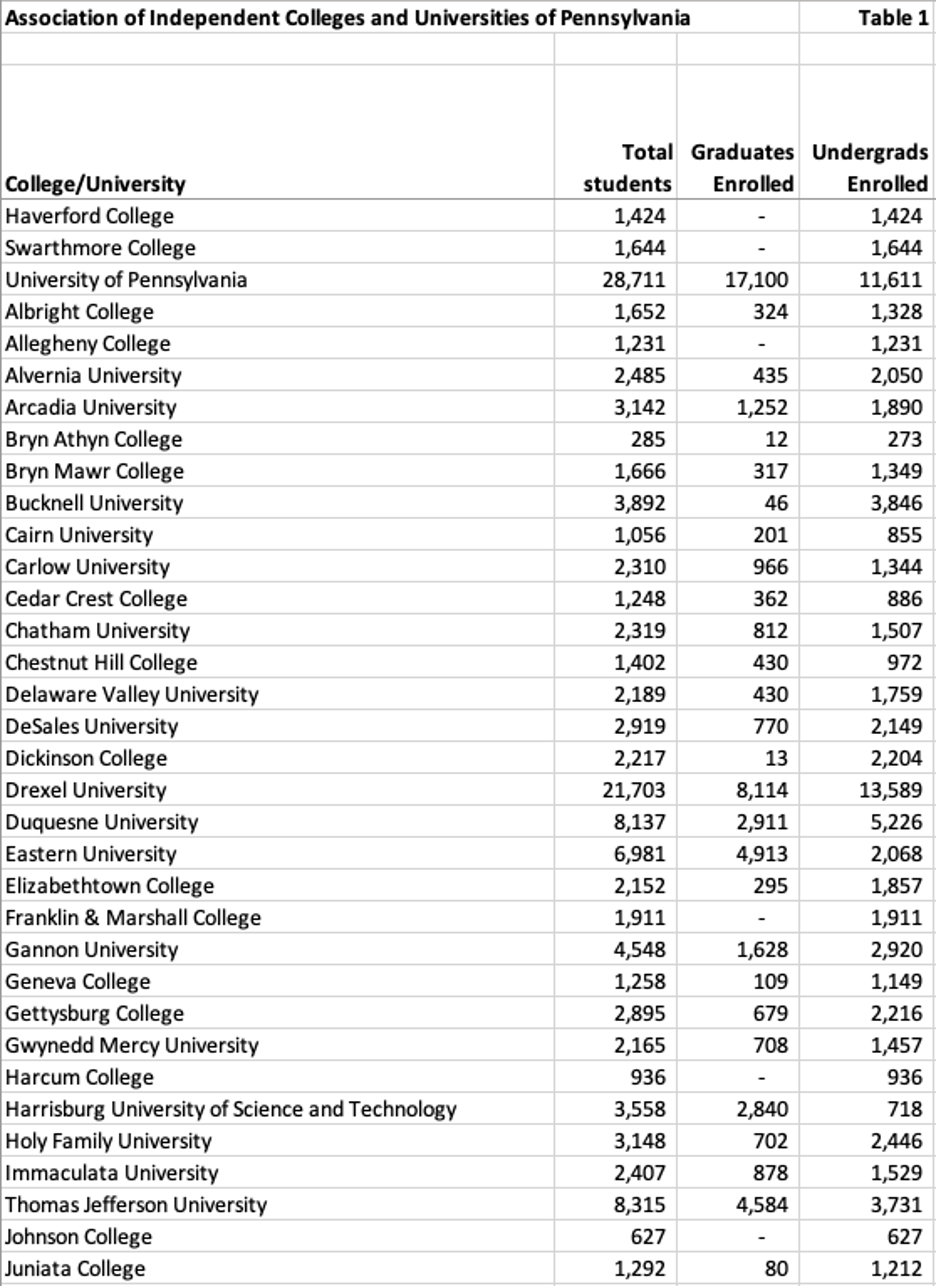
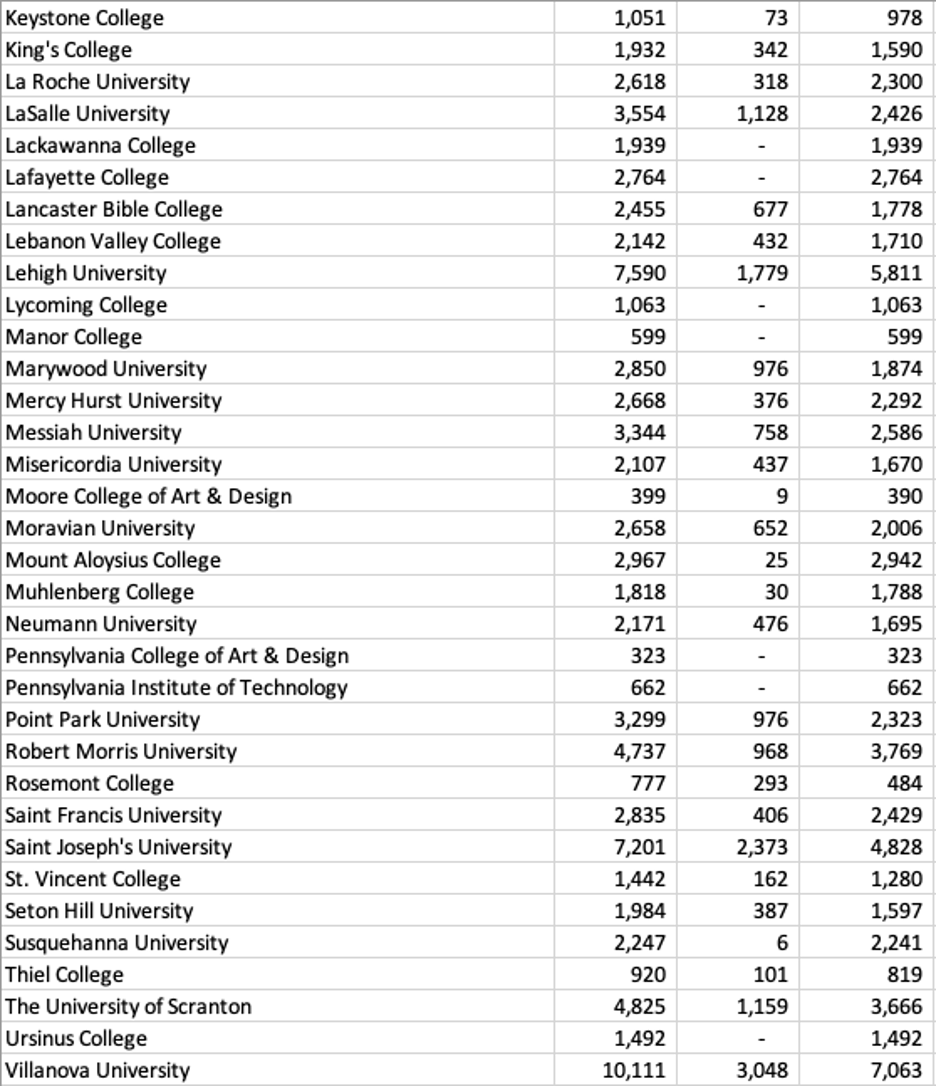
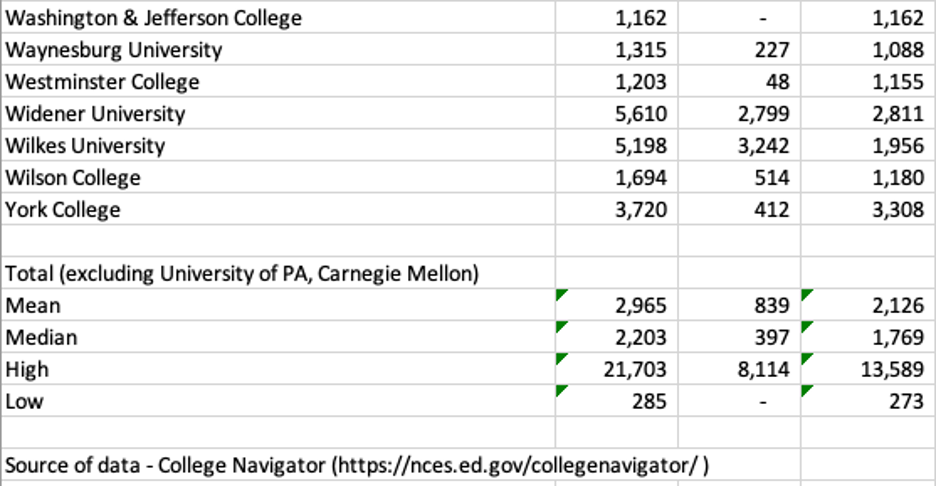
I was concerned about the enrollment breakouts for Mr. Greenstein’s risk analysis. I decided to look at 77 private colleges and universities with undergraduate students that comprise most of the membership of the Association of Independent Colleges and Universities of Pennsylvania (AICUP). I selected AICUP’s members because Pennsylvania is a state adjacent to Maryland, the first state I analyzed. I eliminated three universities with graduate-only enrollments.
I listed the remaining institutions and their total enrollment and undergraduate enrollment in Table 1 below. As you can see, 34 of Pennsylvania’s 77 private colleges and universities have enrollments that exceed 2,500. Only 10 exceed 5,000 in enrollment (the next tier of risk at 60%), and only 4 exceed 10,000 enrollments (the level at which the enrollment risk reduces to 30%).
The University of Pennsylvania and Drexel University have total enrollments exceeding 20,000 students, and Carnegie Mellon University (CMU) is the third largest, with approximately 15,500 total students. After Carnegie Mellon, the next highest enrollment belongs to Villanova University with 10,111 students.
Nine colleges have total enrollments under 1,000, with the lowest, Bryn Athyn College, having only 285 undergraduate students. I excluded CMU, the University of Pennsylvania, Haverford College, Swarthmore College, and Grove City College from calculations of the group’s mean, median, high, and low.
Grove City College was excluded because the college does not participate in the Federal financial aid program. The University of Pennsylvania, Carnegie Mellon University, Haverford College, and Swarthmore College were excluded due to their large endowments and high selectivity, which will be discussed later. Penn and CMU have much larger enrollments thanks to their graduate programs and reputation.
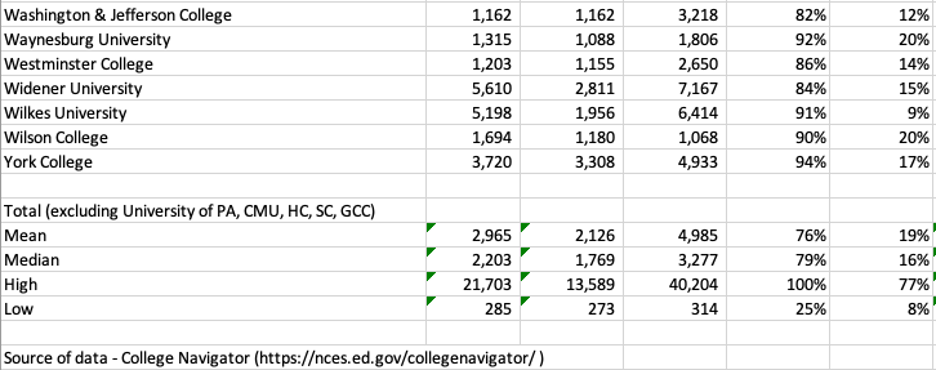
Excluding those five colleges and universities, the mean total enrollment for the remaining 72 colleges and universities is 2,965, and the median total enrollment is 2,203. The high is Drexel University at 21,703, and the low is Bryn Athyn at 285 students.
Liquidity
According to Mr. Greenstein, more than 60% of the sub-2,500 group of colleges and universities operate with less than a year of unrestricted net assets. This compares to two-to-three years for mid-sized institutions and five plus for large research universities. More than half of Pennsylvania’s private colleges and universities fall into this risk profile.
When a small private institution has a bad year of new student admissions, the downturn can set off a credit downgrade, pressure on debt-service, a draw on reserves, further tuition discounting to attract undecided and/or last-minute applicants, as well as further downturns.
Tuition Dependence and Price Compression
When 85-95 percent of your revenues are driven from tuition and fees, you expose yourself to even greater financial risks in a market with declining enrollments. I created two more tables of data for the 77 colleges and universities.
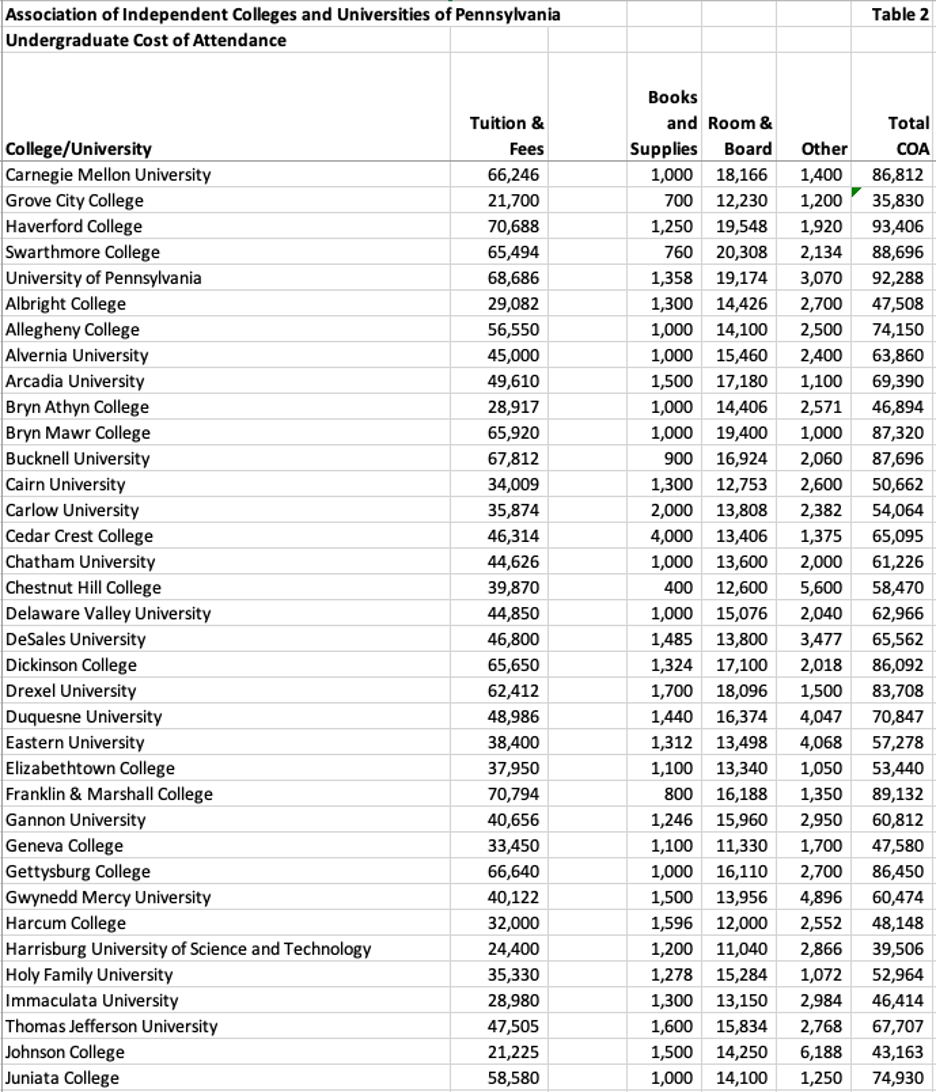
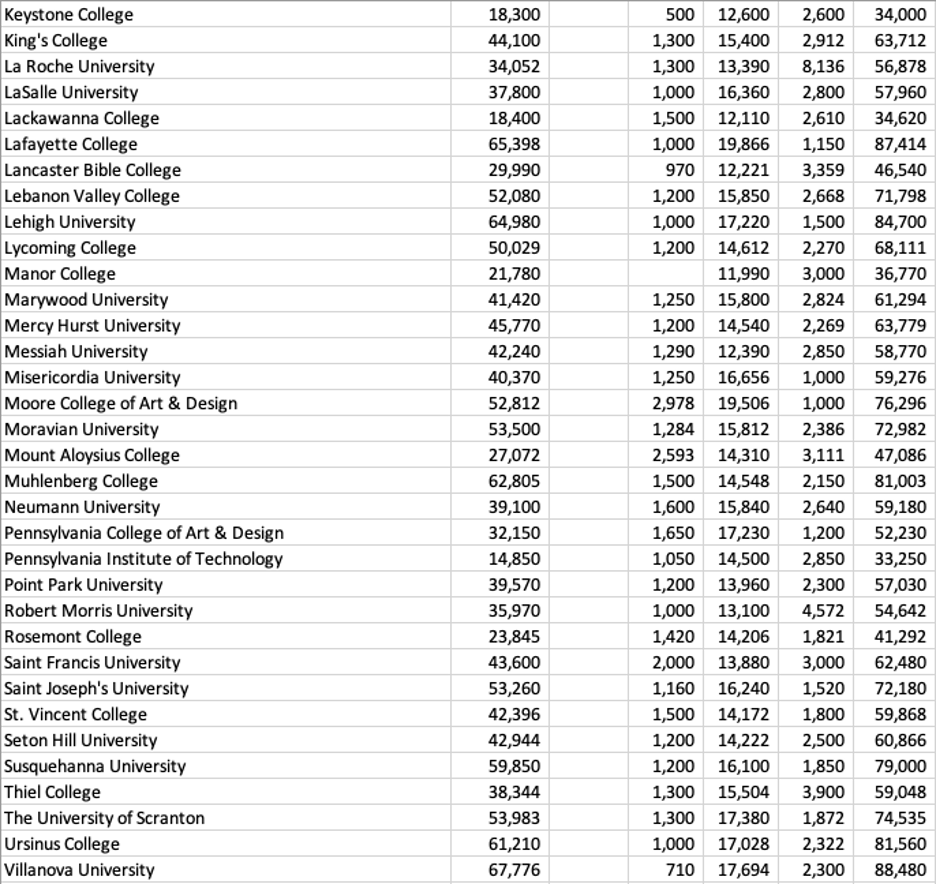
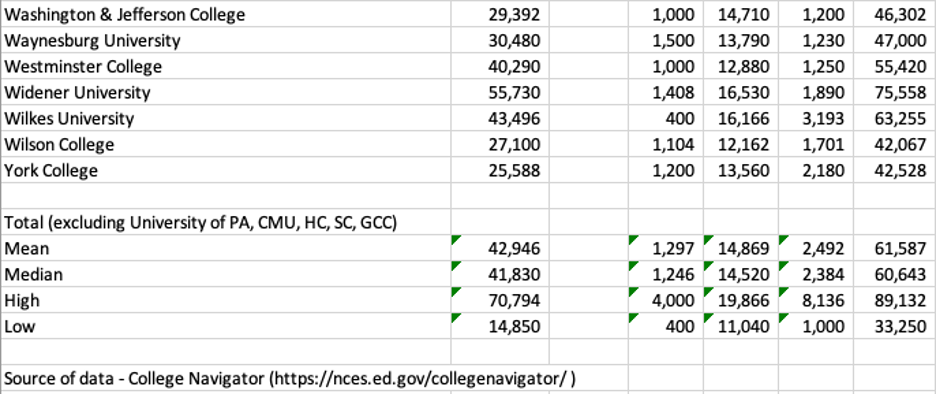
Table 2 illustrates the Total Cost of Attendance for each of these institutions as well as the mean, median, high, and low for the 72 institutions previously noted. The mean ($42,946) and median ($41,830) tuition are similar, although the group of 72 ranges from a low of $14,850 at Pennsylvania Institute of Technology to a high of $70,794 at Franklin & Marshall College.
The mean ($61,587) and median ($60,643) Cost of Attendance (COA) follow that pattern. The low COA ($33,250) is at Pennsylvania Institute of Technology, and the high COA ($89,132) is at Franklin & Marshall College.
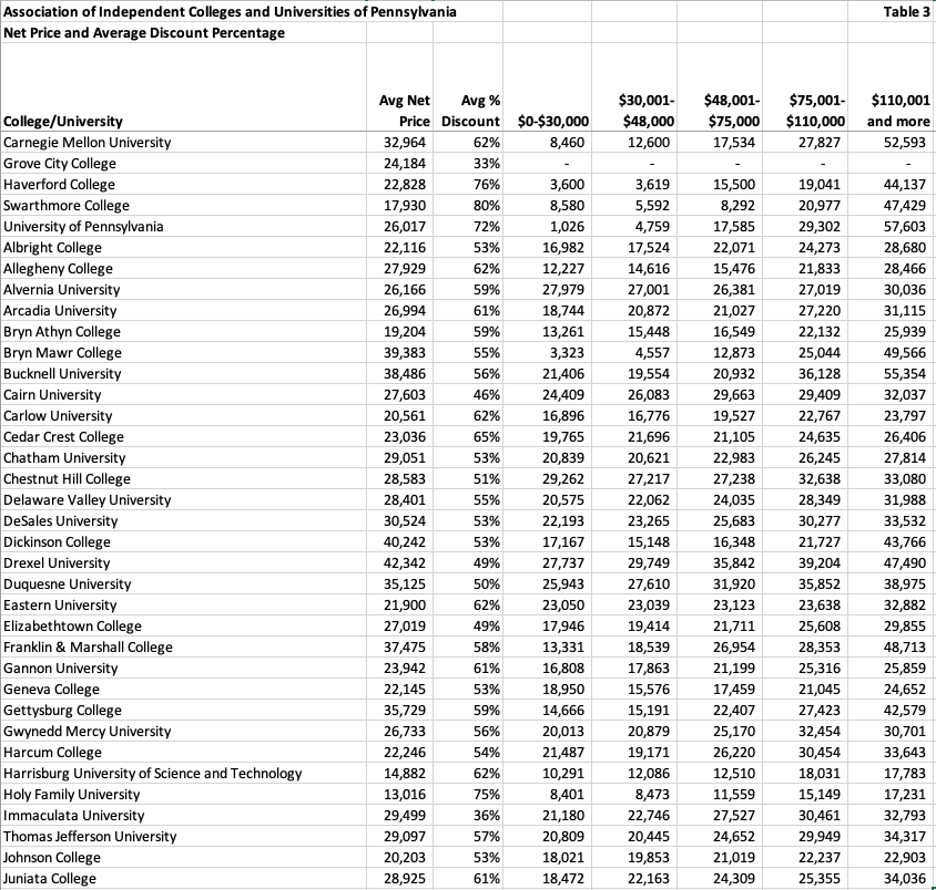
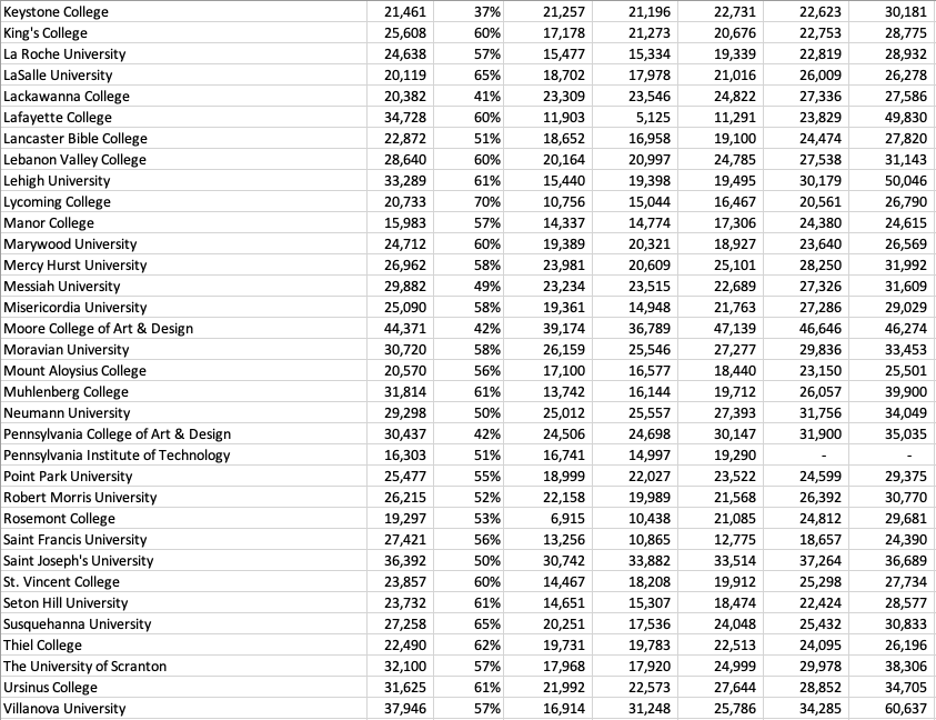
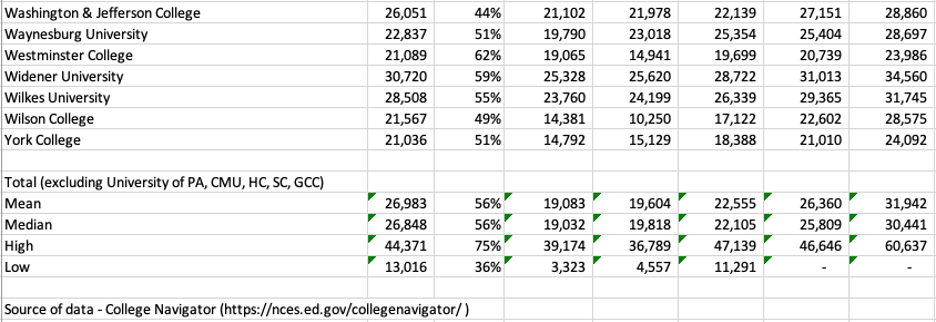
No analysis of the costs of private colleges is complete without looking at average net price, which is the Total COA minus all grants. Table 3 below illustrates these numbers for the group. The mean ($26,983) and median ($26,848) average net prices are close. The institutions, however, range from a low of $13,016 (Holy Family University) to a high of $44,371 (Moore College of Art & Design).
I also like to review the average net price in the lowest income quintiles. While the mean and median across all five quintiles are similar, a gap is evident in the range between the high and low in each category. It’s disappointing to me that the median is $19,032 for the $0-30,000 quintile and $19,818 for the $30,001-48,000 quintile. In a perfect world, it should be $0 given the low earnings for a family of four in these quintiles. The low of $3,323 for the $0-$30,000 quintile is at Bryn Mawr College. The high of $39,174 is at Moore College of Art & Design.
Notably, the average net price increases across the income spectrum as income rises. The biggest average net price jump is and should be from the fourth quintile to the highest quintile (from a median of $25,809 to $30,441). The highest jump from the fourth to the fifth quintile is at Villanova University, where the increase is from $34,285 to $60,637. This increase likely reflects a much higher income average in the $110,001 plus group at Villanova than the cap of $110,000 in the fourth quintile.
When the average net price is multiplied by the number of undergraduate students enrolled, the product accounts for 85-95% of total revenues for institutions without large endowment income or graduate students.
Although Mr. Greenstein emphasized the net price as the primary source of cash for institutions without large endowments, it’s also important to look at the discount percentage (1 minus the average net price divided by the total cost of attendance) to evaluate the impact of the market on pricing.
The mean and median average percentage discount is 56%. The institutions range from a low of 36% at Immaculata University to a high of 75% at Holy Family University. Institutions with very high admit percentages and single-digit enrollment percentages are clearly experiencing fierce market competition when they are offering discount percentages this high.
Enrollment and Market Reach
Small private colleges and universities recruit regionally, not nationally, writes Mr. Greenstein. Proximity matters. The number of high school graduates in Pennsylvania is not growing like it is in Southern states like Florida. From 2010 to 2023, institutions with fewer than 2,500 students lost an average of 15% of enrollment, whereas the largest institutions grew enrollments. The larger institutions can leverage scale in marketing and recruiting, something the smaller institutions cannot. As mentioned earlier, less than half of Pennsylvania’s private colleges and universities have more than 2,500 students. This is like the situation in Maryland and Virginia versus Florida.
Program Structure
Small colleges either have too narrow of an academic portfolio or too diffuse of an academic portfolio, notes Mr. Greenstein. College Navigator, the source of my data for these tables, has a section for each college/university titled Programs/Majors. Two examples illustrate his point.
Bryn Athyn College, the smallest in terms of undergraduate enrollment, had 56 graduates majoring in 9 unique degree programs. In the most recent year, Dickinson College had approximately 374 graduates across 47 program categories. A narrow focus can restrict the number of students interested in your college. Too diffuse of a portfolio may generate instructional cost inefficiencies.
What Scale Buys
When enrollments reach or exceed 10,000 students, something shifts according to Mr. Greenstein’s analysis. Operating margins are positive. Tuition dependency is less than 60%. Endowment balances per FTE student increase, and external funding increases.
The efficiencies from scale allow institutions to buy the following:
- Revenue diversification among graduate programs, auxiliaries, philanthropy, and research
- Fixed cost overhead spread across more students
- Market elasticity – national reach offsets regional/local decline
- Brand leverage – selectivity sustains price integrity
The Leadership Paradox
There are a few small enrollment institutions that are not at risk, according to Mr. Greenstein. These are wealthy liberal arts colleges with large endowments and loyal alums.
Most presidents of small private colleges face the following challenges:
- Raise price and risk yield
- Cut price and erode margin
- Diversity and dilute mission, and/or
- Consolidate and lose identity.
The math doesn’t work well without scale. Collaborations offer some relief, but most colleges don’t have the flexibility to initiate those partnerships in a reasonable amount of time. Waiting deepens the financial decline, and few partnership opportunities are available to financially distressed institutions.
The Price of Admission
Daniel Greenfield followed up his research piece on scale with an article on admissions selectivity at private colleges and universities. He opens with, “Across nearly 1,000 private institutions, we see a simple, if sobering, pattern: as acceptance rates rise, financial resilience collapses.” He further writes that the relationship is not linear but is exponential. “Beyond 50% acceptance, the decline becomes a free fall. By the time acceptance exceeds 75%, nearly 9 out of 10 institutions are considered high risk.
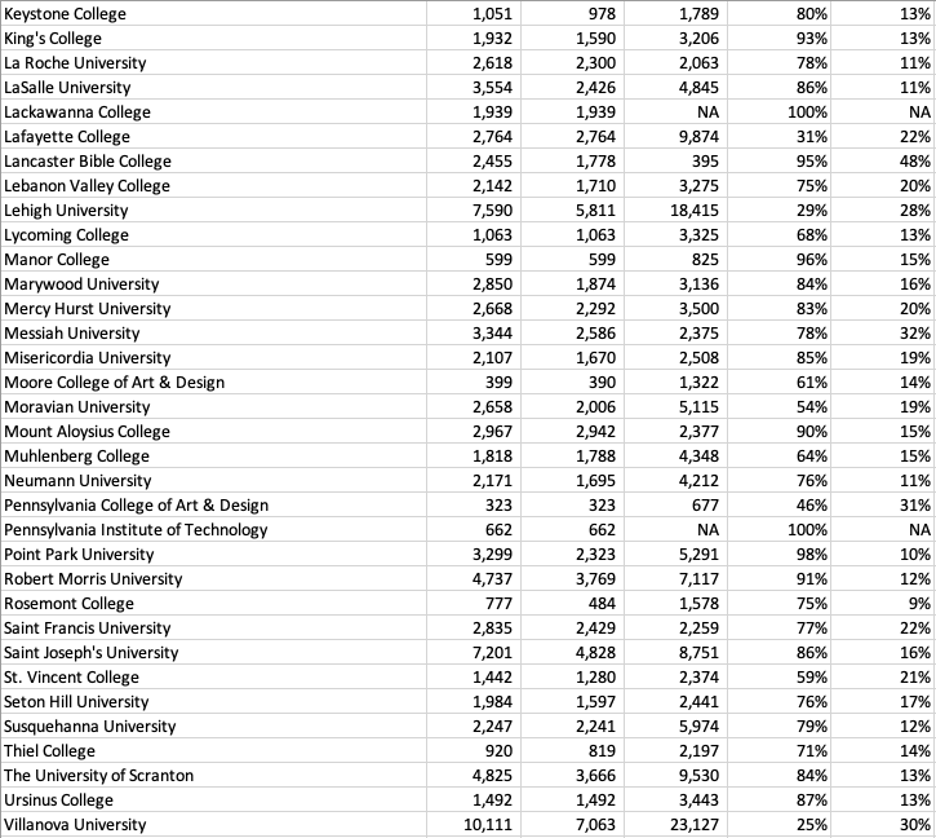
I added to the tables of data for the 77 institutions that I created for his earlier paper. In Table 4 below, I have included College Navigator statistics for the number of applications, the percentage accepted, and the percentage that enroll for each of the institutions. Again, I did not include the five previously mentioned schools in the mean and median statistics for the group. Four colleges have “NA” in their columns, indicating they did not provide admissions data but stated they have an open enrollment policy (meaning they admit all who apply).
Based on Greenfield’s research on admissions selectivity, many of Pennsylvania’s private colleges and universities could be considered high risk. Excluding the five institutions previously mentioned, the lowest acceptance rate is 25% at Villanova University, and four institutions are open enrollment, meaning they accept 100% of all applicants. The mean for the group is 76% and the median is 79%.
With such low aggregate selectivity, these institutions are high risk, according to Mr. Greenstein, because of their susceptibility to market forces. The market’s impact is evident in the group’s mean and median enrollment percentages of 19% and 16%, respectively.
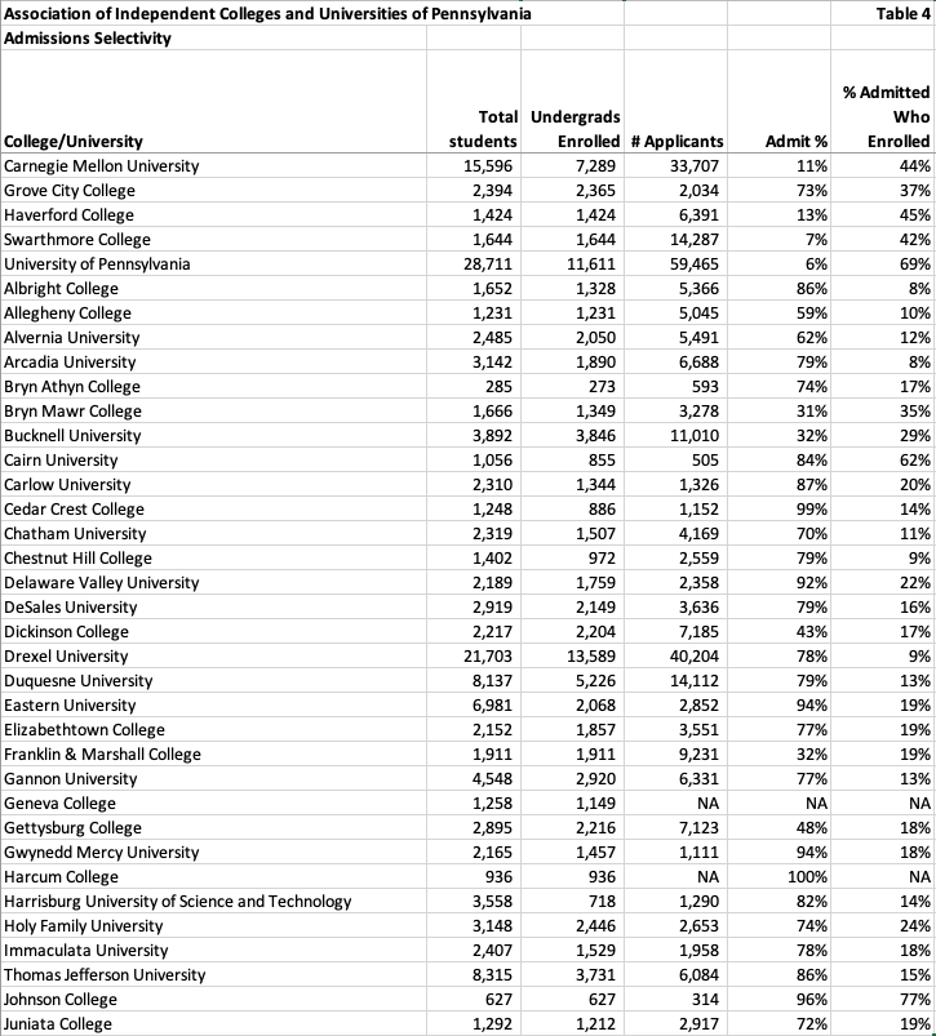
Greenstein’s paper discusses differences in financial risk among institutions with acceptance rates below 10%, between 10% and 25%, between 25% and 50%, and above 50% and above 75%. I excluded the two institutions (Penn and Swarthmore) with single-digit acceptance rates, and Carnegie Mellon and Haverford are the next two closest in selectivity, at 11% and 13%, respectively. Villanova University (25%), Lehigh University (29%), and Lafayette College (31%) are the next most selective.
When the acceptance rate goes above 50%, Greenstein writes that liquidity falls below 75% and tuition dependency exceeds 80%. Institutions are trapped in a spiral of shrinking enrollment, rising discounts, eroding net tuition, and collapsing unrestricted assets. By 75-85% acceptance, most institutions exhibit 3-5 signs of financial decline. At 85-100% acceptance, tuition accounts for 90% of revenue, reserves are almost nonexistent, and financial distress is structural rather than cyclical.
Selectivity matters because “it is a proxy for pricing power and brand elasticity.” Institutions have the power to control pricing without offsetting demand. Beyond 50% acceptance, the market sets tuition prices, and institutions’ margins decline as net price falls. Institutions with acceptance rates above 50% are in the higher education market segment that is overcrowded and price-sensitive.
Some of this market effect is evidenced by the percentage of those admitted who enrolled. The median percentage for the group of 72 is 16%. Six of the colleges and universities have single-digit enrollment percentages. At the same time, three of the colleges have enrollment percentages of 50% or better.
Mr. Greenstein discusses that each of the 1,000+ institutions in his dataset was scored across approximately 36 different financial and operational metrics. Among those were: liquidity, margin, tuition dependency, enrollment trend, and cost structure.
Risk archetypes appear in layers when institutions have low selectivity, writes Greenstein. Enrollment fragility and tuition dependency appear in nearly every institution. Academic program sprawl and financial distress appear as liquidity erodes.
Greenstein writes that the conclusion from this data analysis should not be that colleges need to increase their selectivity. Selectivity defines the institution’s structural position and the extent of its pricing power and market elasticity. Strategy should be guided by understanding that position, not trying to increase selectivity.
Greenstein recommends that institutions with an acceptance rate of more than 70% should consider scale initiatives such as:
- Collaborating with other institutions to share administrative and technology costs
- Specializing in mission or program areas where competition is low
- Diversifying through adult, online, or workforce-aligned programming
- Partnering with states or systems to simulate the economies of scale that you lack
He also recommends looking at financial restructuring or mergers before financial reserves are exhausted. Greenstein did not recommend adding graduate programs, but the third bullet could theoretically include graduate programs (in my opinion).
Where an institution is on the selectivity curve matters, writes Greenstein. Elite colleges have room to adjust their operating models without breaking. Open enrollment (100% acceptances) institutions do not. Institutions in the middle have too much cost to shrink and too little market to grow. Once the market takes over, the odds of recovery diminish rapidly.
Revenue Streams
Tuition-dependent institutions should be resourceful in their quest for stable or increasing revenues. In Capitalizing on College, author Joshua Travis Brown cites a college president who referred to his quest for diversifying revenues as his “Tabletop Strategy.” Additional markets, modes of operation, or degrees were referred to as adding legs to the existing table of operations. The more legs, the stronger the institution.
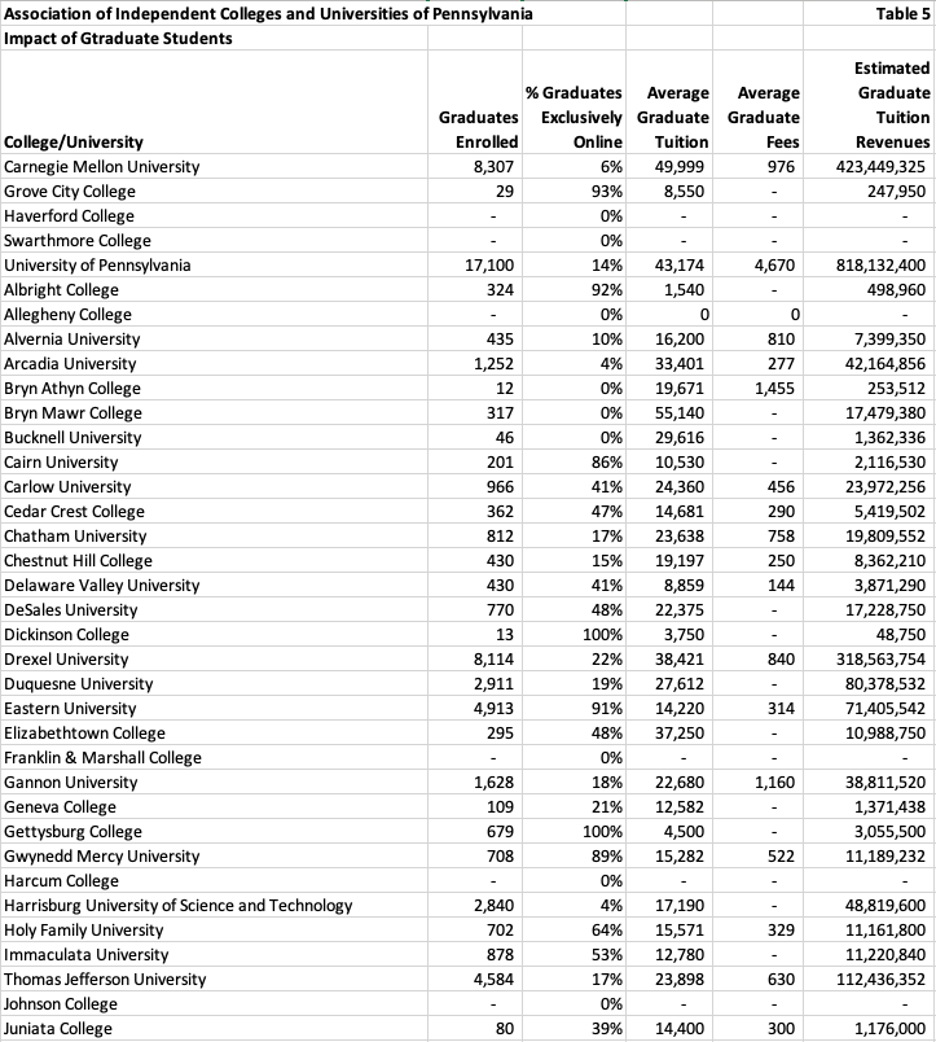
Many of the AICUP institutions appear to be offsetting non-selective undergraduate enrollments with graduate enrollments. In Table 5 below, I used the average graduate tuition and fees for each institution and multiplied them by the number of graduate students to derive an estimated graduate tuition revenue. While this may not account for financial aid or discounts, it’s a useful tool for seeing how much revenue each institution is generating from its graduate programs.
It’s worth noting that, even though I excluded them from the group’s mean and median analyses, Carnegie Mellon and the University of Pennsylvania have over $1.2 billion in aggregate graduate student tuition revenue.
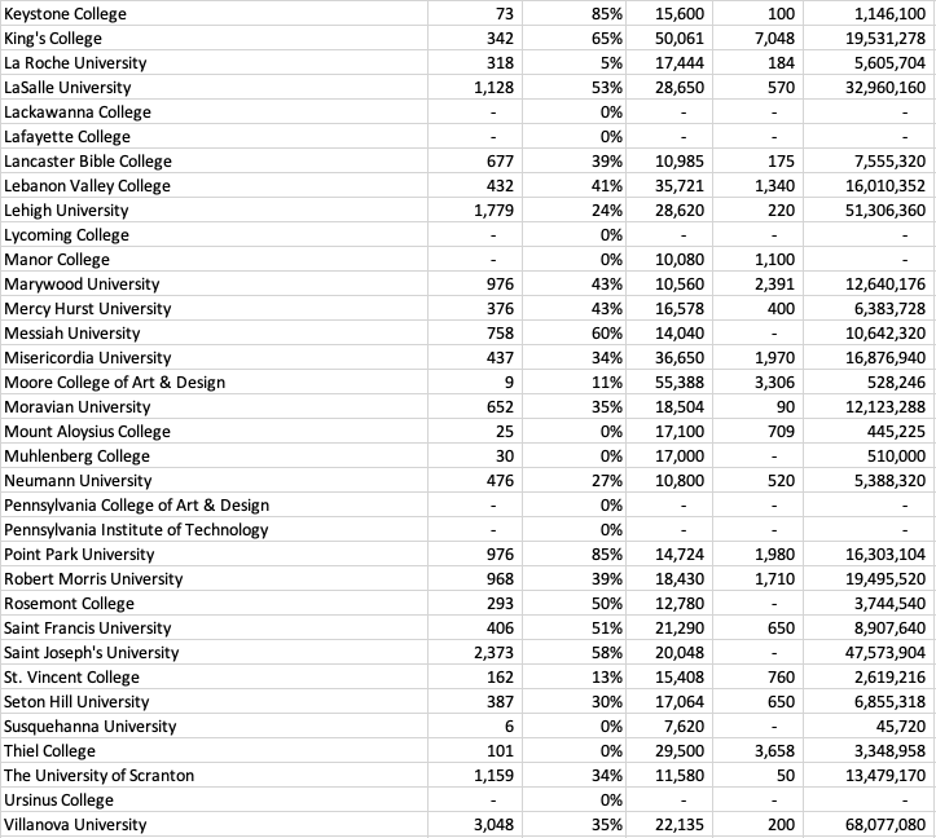
With 8,114 graduate students, Drexel University has an estimated $318 million in graduate revenues. The mean ($19,947,174) and median ($5,994,716) estimated graduate tuition revenues for the other 71 colleges and universities are quite different but indicate how graduate tuition revenues can enhance the colleges’ financial situation. Duquesne University, one of the least selective schools with a 13% enrollment rate, receives about $80 million in graduate tuition revenue.
The range of estimated graduate tuition revenues across the other 71 institutions goes from a high of $318,563,754 at Drexel University to a low of $0 at 14 colleges with no graduate students.

One of the first colleges or universities to receive accreditation approval for its online degrees was the University of Phoenix approximately 30 years ago. While many colleges are familiar with the online format (and even the holdouts adapted during the recent COVID pandemic), very few have successfully implemented it on a large scale.
College Navigator provides data regarding the percentage of undergraduate and graduate students who are studying exclusively online, partially online, or not online at all. I also included the percentage of graduate students who are completing their studies exclusively online in Table 5.
Two of the 72 colleges and universities enroll 100% of their graduate students exclusively online. Wilkes University, Grove City College, and Eastern University enroll more than 90% of their graduate students exclusively online. Six more colleges and universities enroll at least 80% of their graduate students exclusively online.
Another source of revenue diversification is adult education. Since many of these students enroll exclusively online, I did not attempt to create a chart from the enrollment age data included in College Navigator.
A Few More Thoughts
I found both of Mr. Greenstein’s studies to be informative. While some of the findings are intuitive (increased tuition discounting leads to decreased operating margins, for example), having a 1,000-plus institutional dataset to use for analysis is impressive.
Building my own small dataset using enrollment, tuition, net price, and admissions selectivity for 77 private institutions in Pennsylvania, plus 39 in Maryland and Virginia, and 31 in Florida, helped me grasp the significance of Greenstein’s findings and the market conditions affecting many of our private institutions.
Most senior administrators working for at-risk private institutions are aware of many of these challenges. Some may have found enrollment and revenue solutions, and others may still be treading water in a competitive market. Greenstein’s findings may be more relevant to their board members as they consider strategies for success or survival.


