I have been a college affordability advocate for decades. When I was an undergraduate at Duke in the 1970s, I graduated with only $2,100 in student loan debt thanks to scholarships, Basic Educational Opportunity Grants (the predecessor of Pell Grants), Work Study jobs, summer jobs, and a small expense allowance from my parents. I estimate that student loans comprised approximately 15 percent of my four-year cost of attendance.
Over the years, I’ve written about the cost of attending college. More recently, I’ve focused on net price per income quintile as an indicator of an institution’s capability to provide grant aid to its lowest income students.
In 2023, I wrote about the affordability of Ivy Plus institutions, elite private colleges and universities, major public universities, HBCUs, and community colleges. A segment of each of those articles highlighted the differences in net price for the lowest income students. The articles included data from approximately 300 institutions.
The One Big Beautiful Bill mandated specific changes to the Federal Financial Aid System, including capping borrowings under the Parent PLUS and Grad PLUS loan programs. When the net price for undergraduates exceeds the annual cap for student loans (use $6,000 as an average for dependent freshmen and sophomores and $10,000 for independent freshmen and sophomores), many institutions offer a Parent PLUS loan to cover the difference instead of providing institutional grants. I have never been a fan of unsubsidized student loans, particularly for our lowest income students. Earlier this year, I wrote an article about the Parent PLUS loan crisis.
Financial Aid at the Broader Set of Colleges and Universities
I downloaded the College Scorecard Most Recent Institution-Level Data file to my computer and decided to upload it to my ChatGPT Pro account. The file contained data from 6,273 institutions, of which 6,243 are currently operating. I prompted the AI agent to build a spreadsheet that examined net price per income quintile for each of the operating institutions that report a net price for those quintiles. Approximately 1,900 institutions were eliminated, leaving 4,343 institutions in the dataset under review.
For some time, I have believed that families earning less than $50,000 per year cannot afford to pay for college. I prompted the AI to use the net price for the two lowest income quintiles, which are $0-$30,000 and $30,001-$48,000, and rank institutions from highest to lowest. ChatGPT Pro suggested averaging the two lowest income quintiles for each institution. It also suggested grouping institutions in four categories of concern. The Extreme category represented institutions with a mean net price greater than or equal to $30,000 (the high end of the lowest income quintile and the low end of the second lowest quintile). The High category grouped institutions with a mean net price between $20,000 and $29,999. The Moderate category grouped institutions with a mean net price between $10,000 and $19,999. With these cutoffs, Extreme, High, and Moderate would represent institutions that charge more than the Independent loan cap average of $10,000 and much more than the dependent loan cap average of $6,000.
The Lower category represented institutions with a mean net price of less than $10,000. The Summary table of the spreadsheet data is appended below.
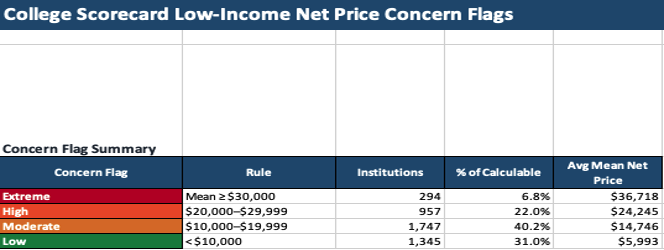
The Extreme, High, and Moderate groups consisted of 2,998 institutions, approximately 69 percent of current operating institutions. I was aghast. More than two-thirds of all colleges have a net price ranging from $10,001 to $90,000+, substantially more than the annual borrowing cap for undergraduates. It’s likely the only payment option for families in these income quintiles is to borrow additional money from the Parent PLUS program (I assume that they receive Pell Grants and subsidized and unsubsidized federal loans).
With the new caps to the Parent PLUS program, any dependent student attending an institution in the High and Extreme categories (1,251 institutions) will be unable to borrow more than $20,000 per year, with a lifetime cap of $65,000.
Institutions with an Extreme Rating
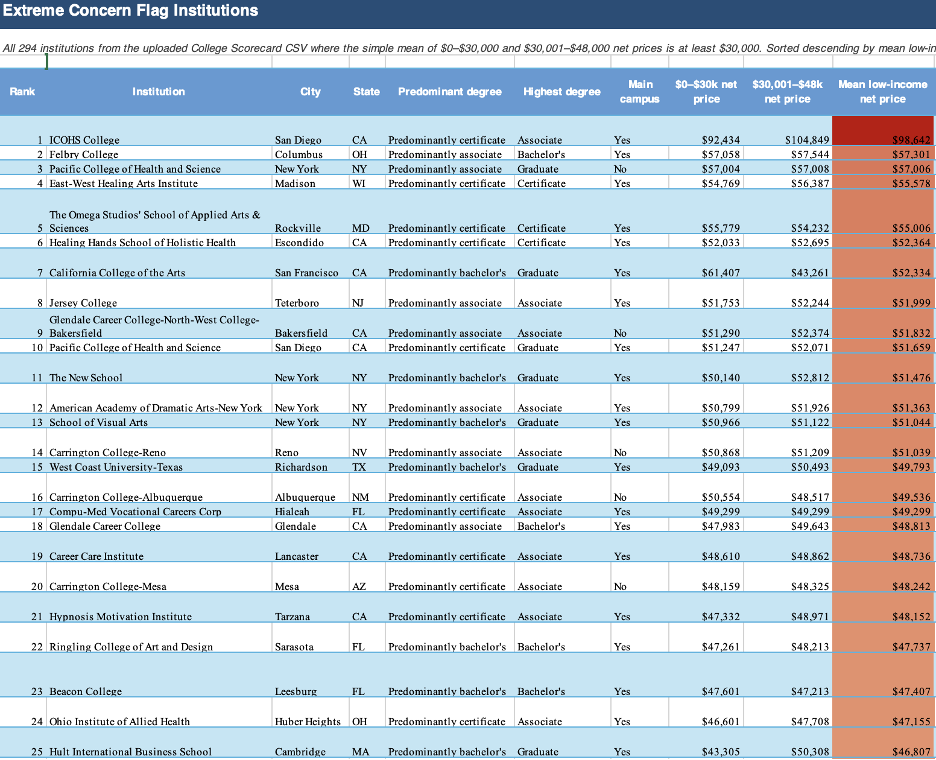
I prompted ChatGPT Pro for a separate Excel file for the 294 institutions classified as Extreme. I validated the spreadsheet data for the 10 highest-ranked schools by reviewing the data published for those institutions in College Navigator. I was impressed by the AI’s accuracy and the organization of the spreadsheet it produced. Appended below is a screenshot of some of the data from the top 25 institutions.
I was appalled at how high the mean low price is for these 25 schools. All these schools will be capped at providing no more than $20,000 in Parent PLUS loans to the parents of students who enroll or have enrolled at these schools after July 1, 2026. In fact, all 294 Extreme schools and the 957 High schools will have their students’ Parent PLUS loans capped at $20,000 per year with a $65,000 lifetime cap.
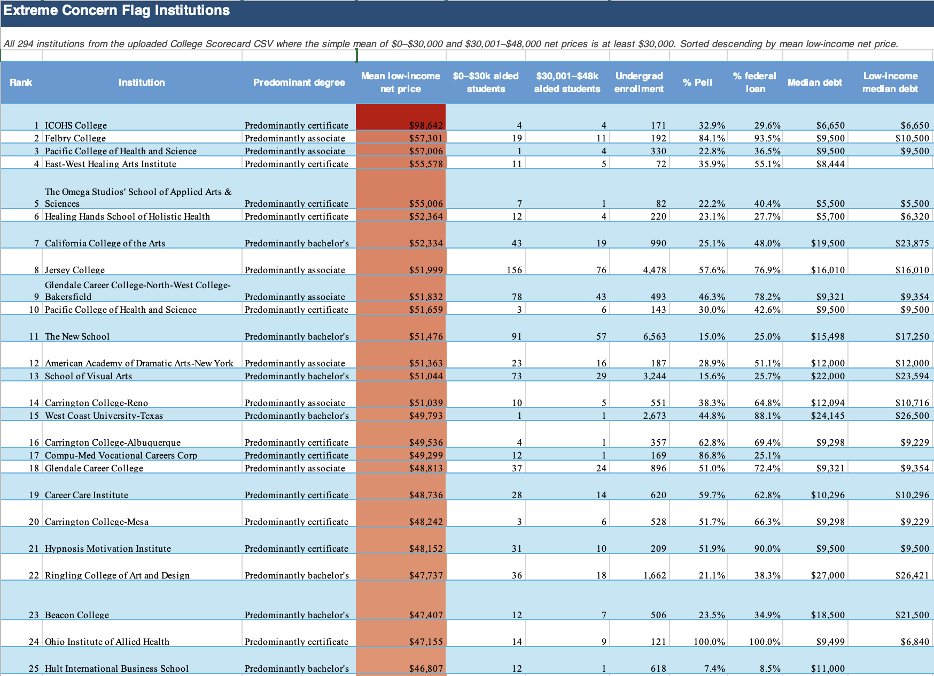
An additional screenshot for the same 25 institutions is appended below. This view provides enrollment data and data related to financial aid. The number of students in each of the income quintiles was insightful. Requiring any students, much less your poorest, to borrow substantial sums of money to pay for these degrees or certificates is beyond belief. Some of the institutions on this list have fewer than 10 students in the lowest income quintile. Nonetheless, at these net prices, they shouldn’t have any.
The percentage of Pell Grant recipients is another interesting statistic that highlights the profile of the institutions’ students. I was surprised to see The New School in the top 25 (number 11) in this list. I noted that the number of students in the two lowest income quintiles is 2.25% of The New School’s students, while the percentage of its Pell Grant-receiving students is 15.0%.
The average loan amounts reported are clearly the standard subsidized and unsubsidized undergraduate student loans, which are capped. The data extracted did not include Parent PLUS loan amounts, which is what I assume were used to fund most of these additional amounts.
I noted that a substantial percentage of the schools on this top 25 Extreme list have more than a 50% Pell Grant-receiving student population, and more than 50% of their students receive federal loans. I am speechless that these low-income students cannot find more affordable options.
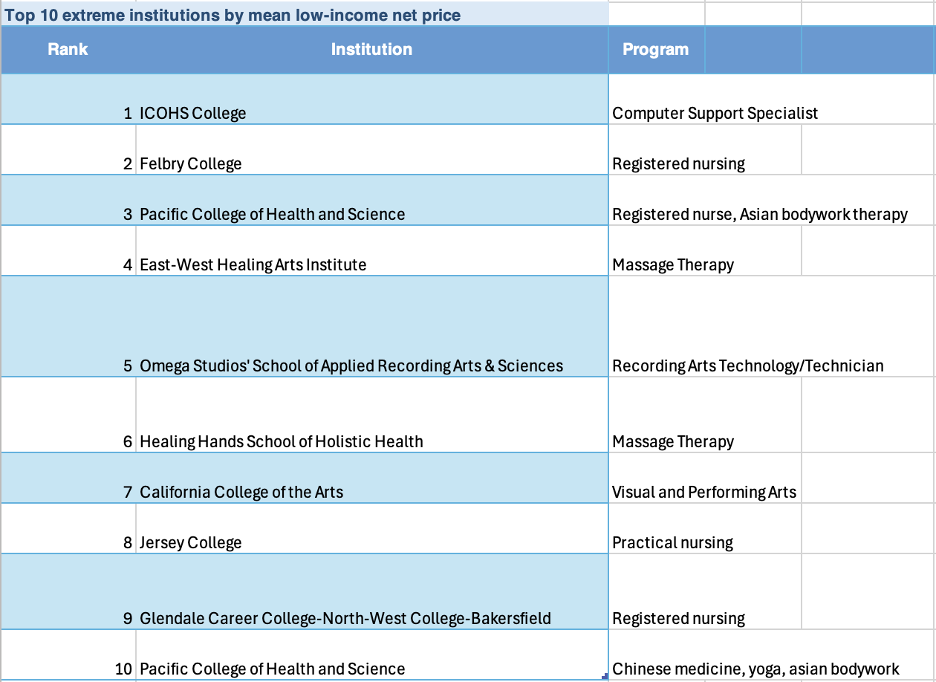
When I validated the net prices for each of the top 10 institutions, I reviewed the programs/majors data to identify the dominant program. The screenshot appended below indicates that many of the majors are healthcare-related.
High-priced institutions that offer healthcare degrees frequently justify their costs by stating that graduates will earn a high income, enabling them to repay their student loans. That may be true, but it doesn’t mean that they deserve to pay these loans for 25 or 30 years because they chose to attend a higher-cost institution instead of a lower cost community college.
Institutions with a Low Rating
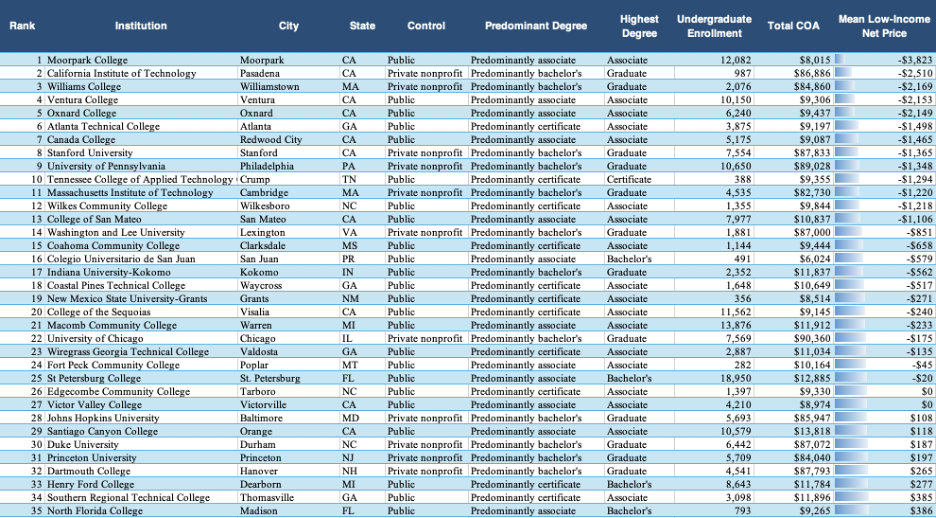
As previously mentioned, there were 1,247 institutions with a Low rating of concern. This group represented approximately 30 percent of all institutions. I prompted ChatGPT Pro to create a separate Excel spreadsheet ranking these institutions. A screenshot of the top 35 is appended below.
It was not surprising to find that many of the institutions in the top 35 of Low concern institutions were public institutions. Public institutions generally have the lowest cost of attendance, which makes it easier to cover the net price with institutional aid or subsidized loans.
The other group that completes this group in the lowest of the Low institutions are the private elite institutions with large endowment balances and generally high cost of attendance. Caltech, Williams, Stanford, UPenn, MIT, Washington and Lee, UChicago, Johns Hopkins, Duke, Princeton, and Dartmouth have the financial resources to cover 100 percent of the need for students in these income quintiles. They are also high-cost-of-attendance schools that are highly selective in their admissions.
A Few Final Thoughts
I knew that very few colleges fund 100 percent of the financial need for students. Usually, it’s the wealthiest institutions that are highly selective or the lowest-cost community colleges that have a low net price for the lowest income quintile students. I was surprised that approximately 70 percent of all institutions have a mean net price for the two lowest quintiles at $10,000 per year and above.
In my opinion, that finding demonstrates that the financial aid system is not doing its job. It doesn’t change my opinion about the Parent PLUS loan program. I believe the Parent PLUS program has enabled colleges to increase the cost of attendance and have indicated my belief that it should be eliminated, not capped.
Knowing how many institutions fall into the $10,000+ category was not enough. I wanted to find out how many students could possibly be impacted, as well as the percentage of students that they represented at their institutions. That was a trickier number to determine.
I prompted ChatGPT Pro to provide me with the number of students in each of the two lowest income quintiles for each of the four classifications compared to the numbers of students in the other three higher income quintiles. That data is appended in Table 1 below. I noted that slightly more undergraduate students attend institutions in the Extreme, High, and Moderate classifications (7,199,347) than attend institutions in the Low classification (6,853,297). That finding appears to be the same across most income quintiles, except the highest ($110k+), where the number of students attending the Extreme, High, and Moderate institutions exceeds that attending the Low institutions by more than threefold.
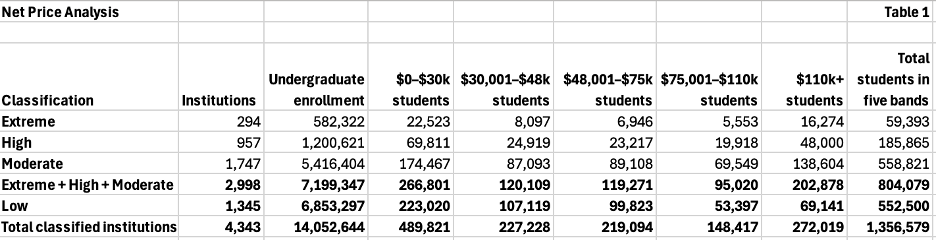
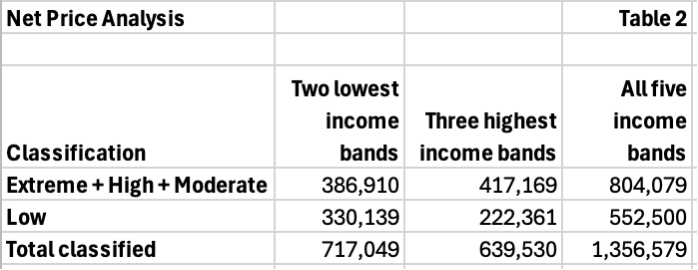
Looking at the data from another perspective, 46% of the students in the two lowest bands attended the institutions classified as Low. The Extreme, High, and Moderate institutions accounted for 54% of students in the two lowest income quintiles but 65.2% in the three highest income quintiles. See Table 2 below.
When I first reviewed this data, I was puzzled by the low total number of students in all five bands compared to the total undergraduate enrollment. I remembered that the net price per income quintile data reports the number of first-time, full-time freshmen. Multiplying the aggregate total by four (representing all four undergraduate years) did not approximate the total undergraduate enrollment.
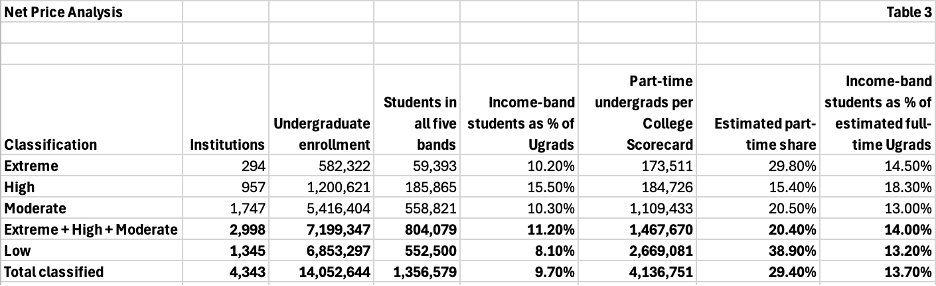
I prompted ChatGPT Pro to provide the estimated number of part-time students attending the institutions across these four classifications. That data is appended in Table 3 below.
The part-time student total and the first-time, full-time freshmen total do not add up to even 50% of the reported undergraduate enrollments. The College Scorecard database does not report net price data for students who do not receive federal financial aid (Pell Grants and loans). Part-time students who fall below half-time status, non-certificate or degree students, transfer students, and international students would not be included either.
NASFAA (National Association of Student Financial Aid Administrators) reported that 596,698 parent borrowers used the Parent PLUS program in 2024-25 with an average loan of $20,830. That’s the entire group, not just the parents of first-time, full-time freshmen. Going forward, parent borrowers from July 1, 2026, until the foreseeable future will be subject to the lifetime cap of $65,000.
Given the available data and the five forces exerting pressure on college enrollments, I predict that students and their parents will benefit from the cap on the Parent PLUS loan program. Institutions classified as Extreme, High, and Moderate will have to find creative ways to fund students, cut their excess tuition, or find legal ways to not admit low-income students. Unfortunately, the lag in reporting means that we’ll hear more from institutions cutting costs to offset the PLUS funding caps before we are able to read the evidence provided by the Department of Education.