An antitrust lawsuit filed last week against 32 colleges and two college application platforms challenges the financial fairness of Early Decision admissions. Inside Higher Ed’s Sara Weissman reported that the complaint claims that early-decision admissions policies “prevent students from comparing financial aid packages by requiring them to attend the college where they applied early, if admitted.”
In addition, the allegations include the statement that “colleges and universities have an agreement not to admit or accept students accepted Early Decision at other institutions.”
Ms. Weissman added that “students feel locked into a decision before knowing their financial aid packages – and institutions can offer less aid since they don’t need to compete for these students.”
Wow! Higher ed must be the new area where class action attorneys feel like sitting down at the laptop and filing a case or two, just because they can. I decided to look at the merits of the case from a financial viewpoint. I believe the judge should throw out the two defendants that host college application platforms. Those platforms are designed to carry out the practices of their members and do not make any admissions decisions. I also note that none of the 32 colleges and universities listed are public colleges and universities. It’s not that public colleges and universities don’t have Early Decision programs, but more likely because most states ban class action lawsuits (a status that the plaintiffs are seeking for their case) against their public colleges and universities.
The Ivy Plus Institutions
Nine of the fifteen Ivy Plus institutions (allegedly the most prestigious and selective colleges and universities in America) are among the 32 institutions being sued (Full Disclosure: I am an alum of two of these schools, Duke and UPenn. I was a financial aid recipient at Duke. I did not apply early decision to college. I am not an employee of any of these schools. My opinions and my research are my own). I’ve written about these institutions in the past and built a spreadsheet to collect some of their enrollment and financial data. I updated the data as of August 16th, added a few fields, and analyzed it.
In Table 1 below, I listed each of the 15 Ivy Plus institutions, whether they were named in the class action lawsuit, whether they participated on the Common App platform, whether they had an early admissions policy, whether they have a financial aid policy of meeting 100% of all students’ needs, and any other aid policies. I also included the most recent U.S. News Best National Universities ranking for each.
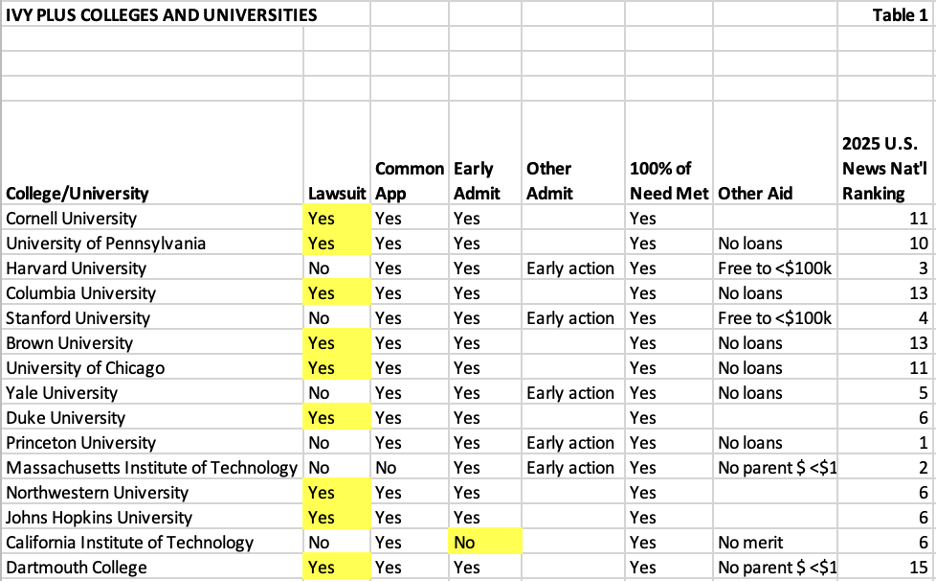
Table 1 illustrates the primary reason why six schools are excluded from the lawsuit. One of those schools (CalTech) does not offer an Early Decision program. The other five institutions offer early action, a non-binding program. The other data is insightful.
Every institution indicates on its website that it will meet 100% of a prospective student’s financial need. All but four of the colleges offer a no-loans policy to undergraduates. Two of the institutions (Harvard and Stanford) offer a free education (tuition, books, room and board, and other costs) to any student whose family earns less than $100,001. Two of them have a policy not requiring parent funding for any student whose family earns less than $100,000-$125,000 annually.
The argument that a student who opts for Early Decision is foregoing a better financial offer is suspect when all the colleges state that they will provide 100% of an accepted student’s financial need. All 15 of these colleges are ranked in the top 15 of U.S. News & World Report’s 2025 National rankings.
Table 2 below highlights the most recently published enrollment and admissions data for these universities in College Navigator. I have also included the percentage of the most recent first-year undergraduates who received no financial aid funding (also known as full-pay students).
These 15 institutions are among the most selective in the U.S. The mean and median admit rates are 5% and 5% on mean and median annual applications received of 45,397 and 51,316, respectively. The admit rate ranges from a low of 3% to a high of 8%. If I were one of the platform defendants, like Common App, I would want to find out how much overlap there is between the applications received by each college. In my estimation, it could be as high as 80%. I am willing to wager that there are very few applicants who are accepted to more than two of these prestigious universities.
It’s also important to note that the mean and median percentages of first-year students receiving no financial aid are 38% and 39%, respectively. That number ranges from a low of 28% at Harvard to a high of 47% at the University of Chicago.
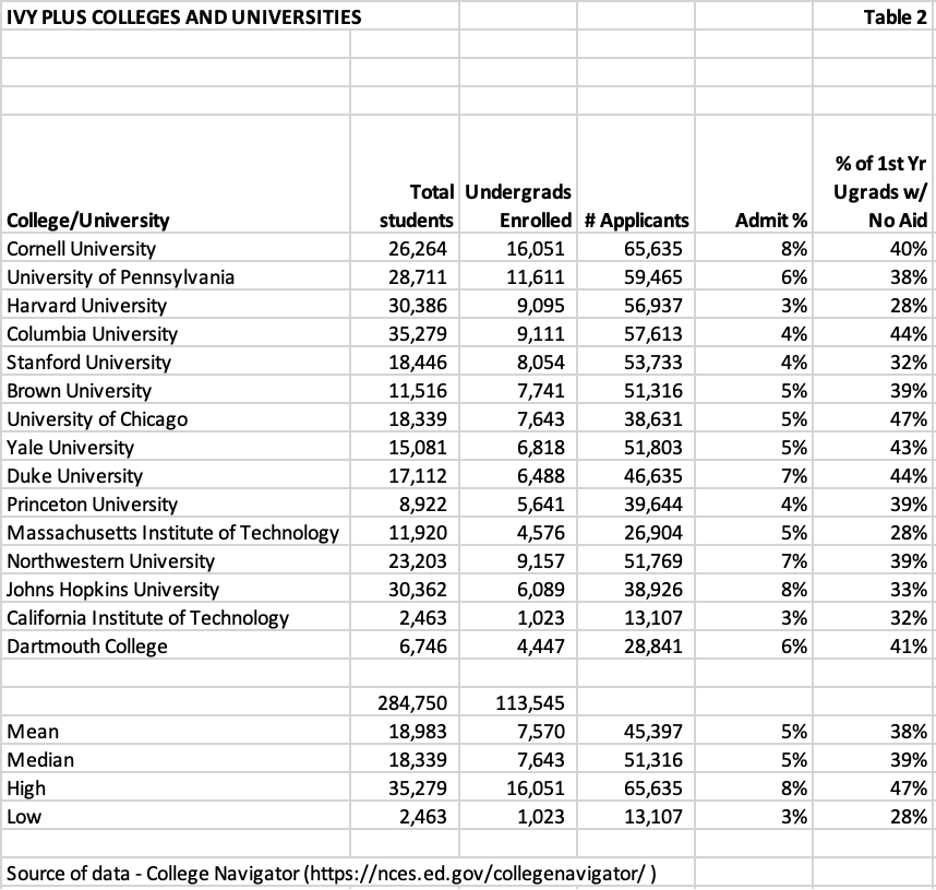
Table 3 below provides the most recently published data from College Navigator regarding the total cost of attendance (COA) as well as its major components for each of the colleges and universities. These are arguably the most selective (and elite) institutions in the U.S.; their mean and median total cost of attendance are $91,150 and $91,676, respectively. Just looking at the price tag might dissuade more than a few applicants whose families do not have the means to pay.
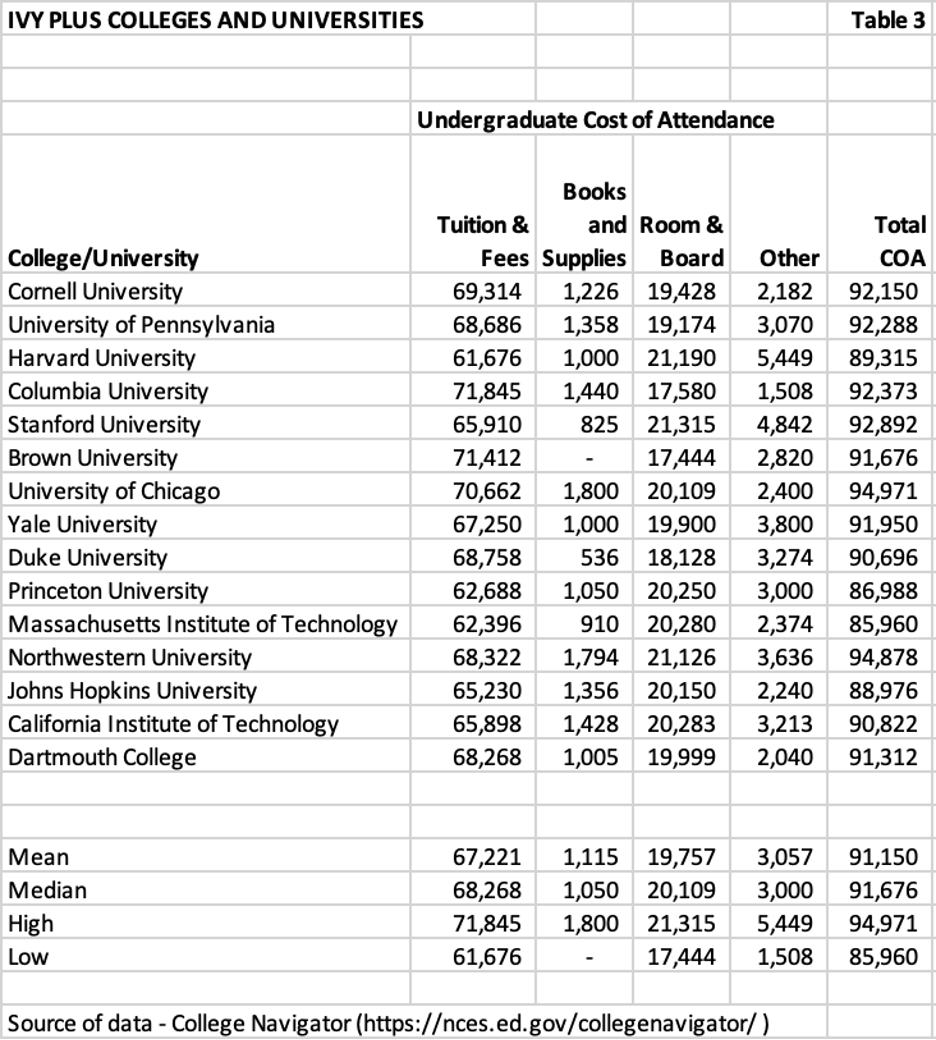
Most policymakers and fortunately, many parents, know that the list price of tuition and other costs of attendance are not the price that the average person pays to attend an institution. Even though approximately 40% of undergraduate students attending these institutions are full-pay, it’s important to know their net price.
According to College Navigator, “average net price is generated by subtracting the average amount of federal, state/local government, and institutional grant or scholarship aid from the total cost of attendance.” Table 4 below provides the average net price for each institution as well as the average net price by income quintile as established by the U.S. Department of Education.
This group’s mean and median average net price are $22,768 and $23,341, respectively. This illustrates the significant size and number of grants awarded to applicants. Given that many of these institutions have no-loan financial aid policies and/or the institutions meet 100% of a student’s aid requirements, it’s important to look at the average net price for each of the first four quintiles. The medians of the first four quintiles are $1,667; $2,496; $6,487, and $14,059, respectively. That’s an even more impressive indication of substantial financial aid grant awards. Surprisingly, more of them are not $0 in the first two income quintiles. There may be anomalies in reporting for Yale, a school with a no-loans policy.
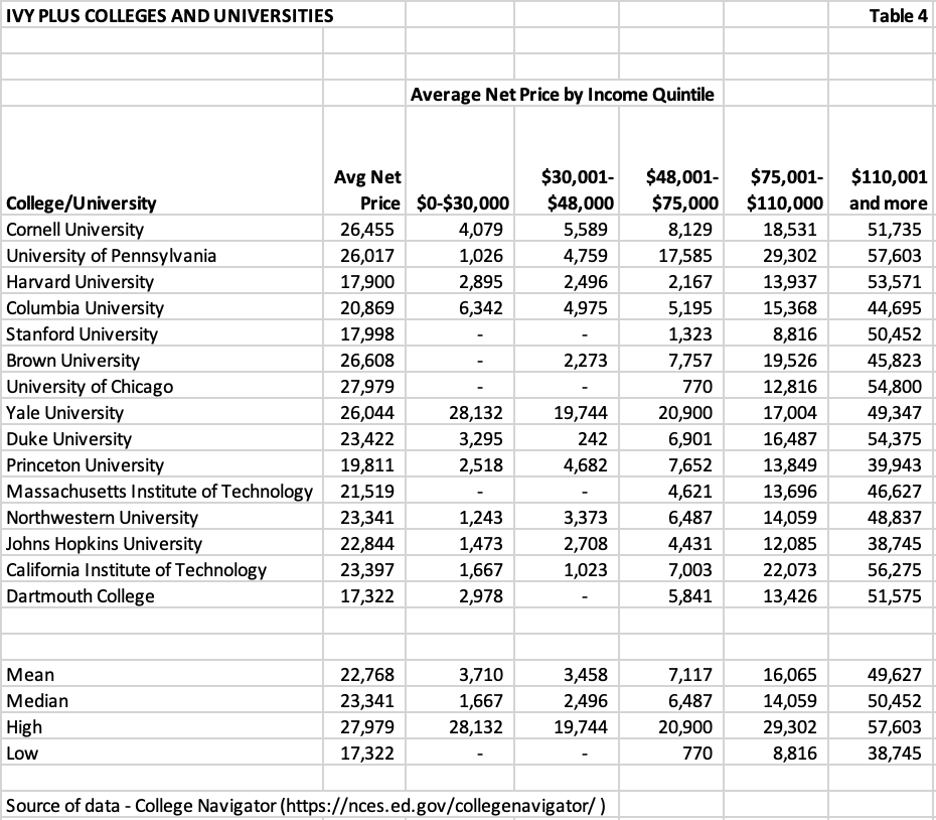
Table 5 below illustrates the numbers and percentages of students who receive institutional grants and scholarships at these institutions. The mean and median percentages of these students are 56% and 54%, respectively. The mean and median grant awards at these institutions are $55,657 and $55,827, respectively. The grants are possible because of the institutions’ large endowment balances and their relatively high percentage of families who are full-pay.
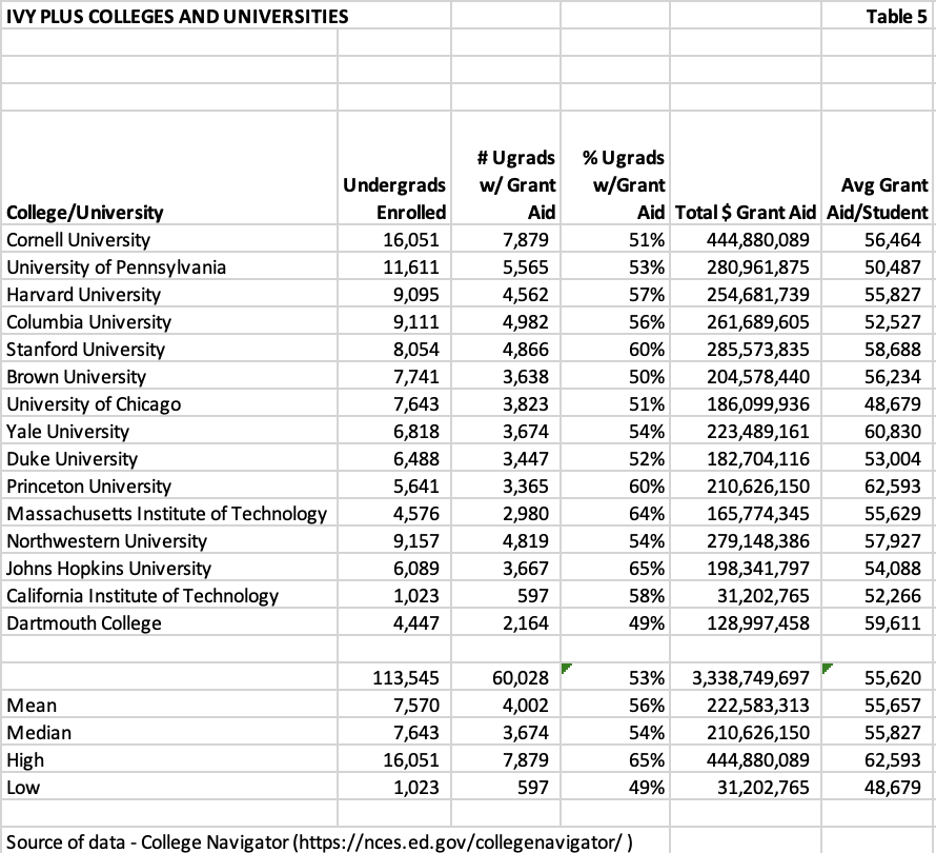
Table 6 below illustrates the number and percentage of undergraduates at each institution receiving Pell grants. Pell grants are need-based grant awards provided by the federal government to the poorest students. The mean and median percentage of students at Ivy Plus institutions receiving Pell grants are 18% and 19%, respectively.
Because most of these institutions have no-loan policies for lower-income families and Pell grants were capped at $6,895 in 2022-2023, the institutional grants and scholarships for students receiving Pell grants are most likely the difference between the COA and Pell grant, less an offset for work-study aid.
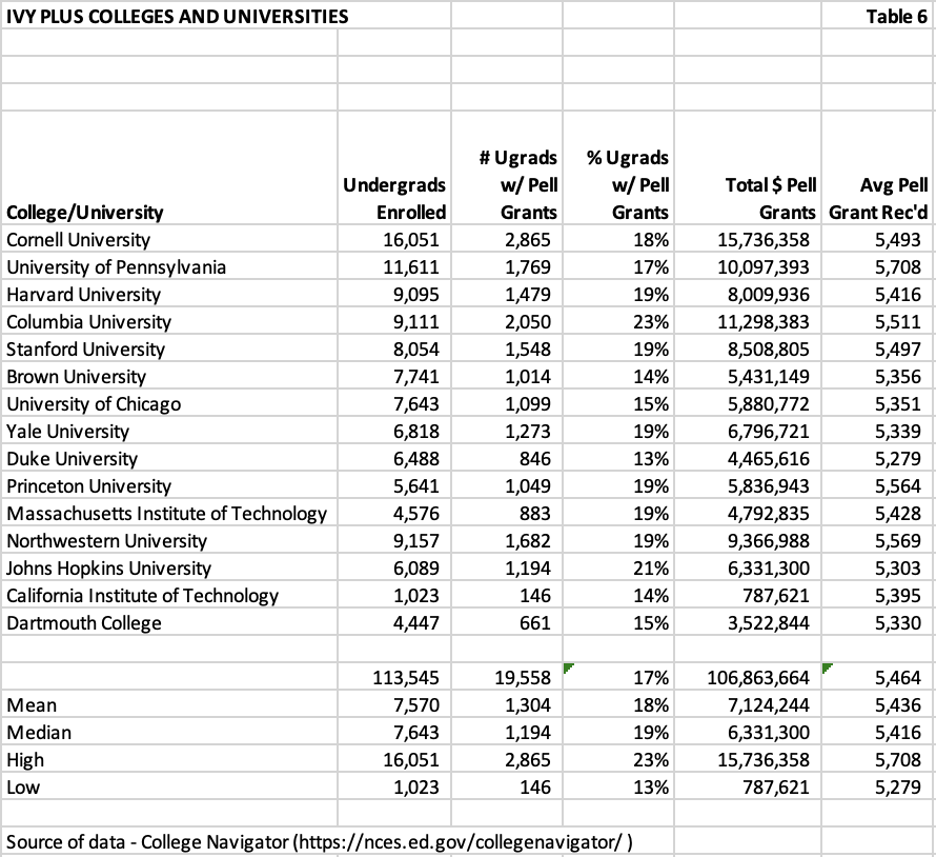
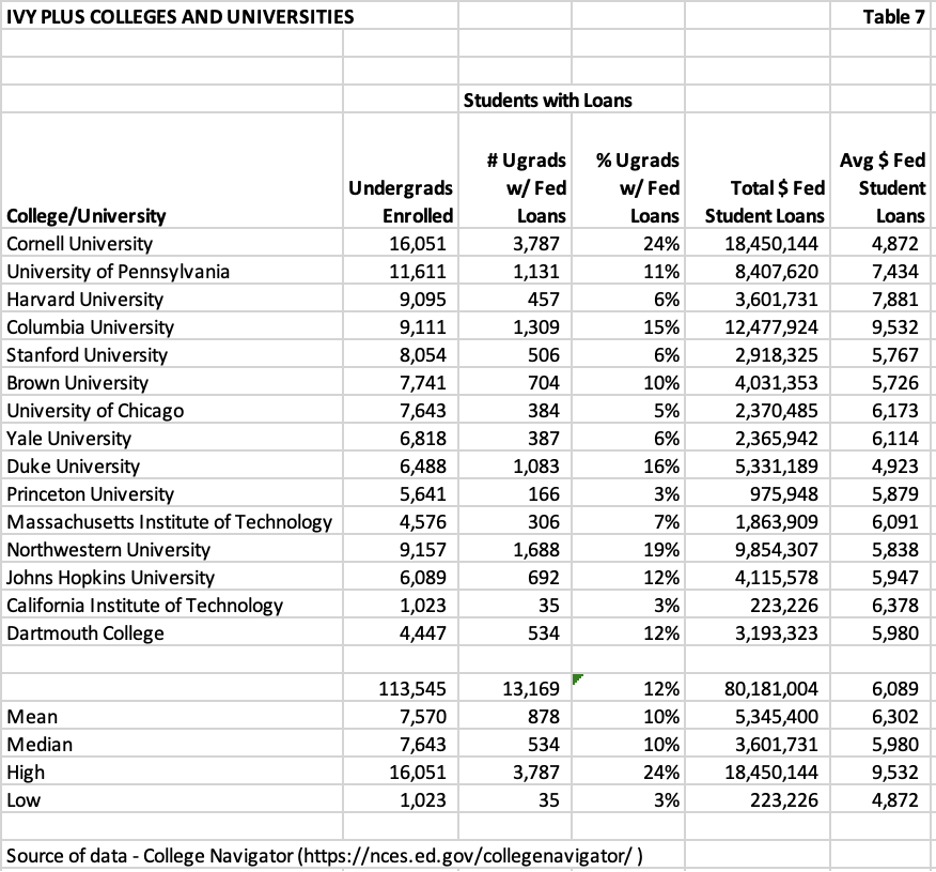
Table 7 below illustrates the number and percentages of students borrowing to pay for some of the costs of attending these institutions. The mean and median average loan amounts are $6,302 and $5,980, respectively. In all but one institution (Columbia University), the average loan borrowed is less than 10% of the cost of attendance.
Elite Private Colleges and Universities Not Considered Ivy Plus
The remaining 23 colleges and universities named in the lawsuit are part of a group of institutions that I have written about previously. I classify these institutions as Elite Private Colleges and Universities (that are not Ivy Plus).
In Table 1-A below, I listed each of the remaining 23 institutions that were named in the lawsuit, note their use of the Common App, and that they offer Early Admission. All but two (Mount Holyoke and University of Rochester) indicate on their website that they provide funding for 100% of an admitted student’s financial need.
Eleven of the 23 institutions indicate that they provide no-loan policies, either for all undergraduates who have demonstrated financial need or for undergraduates whose families earn less than a specific amount.
All 23 institutions were either ranked by U.S. News & World Report in the 2025 National Liberal Arts Colleges rankings or the 2025 Best National Universities rankings (highlighted in yellow).
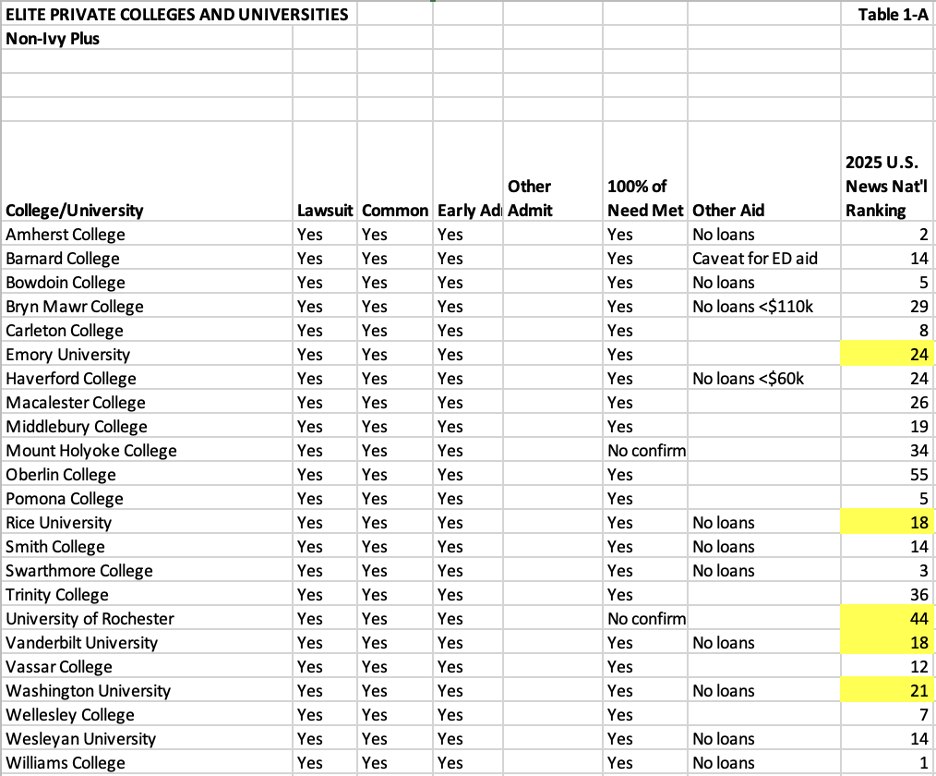
Table 2-A below highlights the most recently published enrollments and admissions data for these colleges and universities from College Navigator. Also included are the percentages of first-year undergraduates who received no financial aid funding (also known as full-pay students).
Less than 100 colleges and universities in the U.S. have less than a 50% admit rate. These 23 institutions are all in that select group. The mean and median admit rates are 17% and 13% respectively, on mean and median annual applications received of 14,799 and 11,803. The admit rate ranges from a low of 6% to a high of 38%.
Because the first part of the analysis isolated the members of the Ivy Plus group of colleges and universities from other private institutions, the Common App applications overlap that may exist between members of this group is likely more nuanced. For example, the five universities highlighted may overlap more with the Ivy Plus group than the 18 smaller-enrollment liberal arts colleges.
The mean and median percentages of first-year students receiving no financial aid are 33% and 34%, not far off from the Ivy Plus mean and median percentages of 38% and 39%. Many children of wealthy parents apply to Ivy Plus and other elite private colleges and universities. The number ranges from a low of 1% at Oberlin College (Oberlin offers every student who accepts their offer a $10,000 institutional grant) to a high of 57% at Wesleyan University.
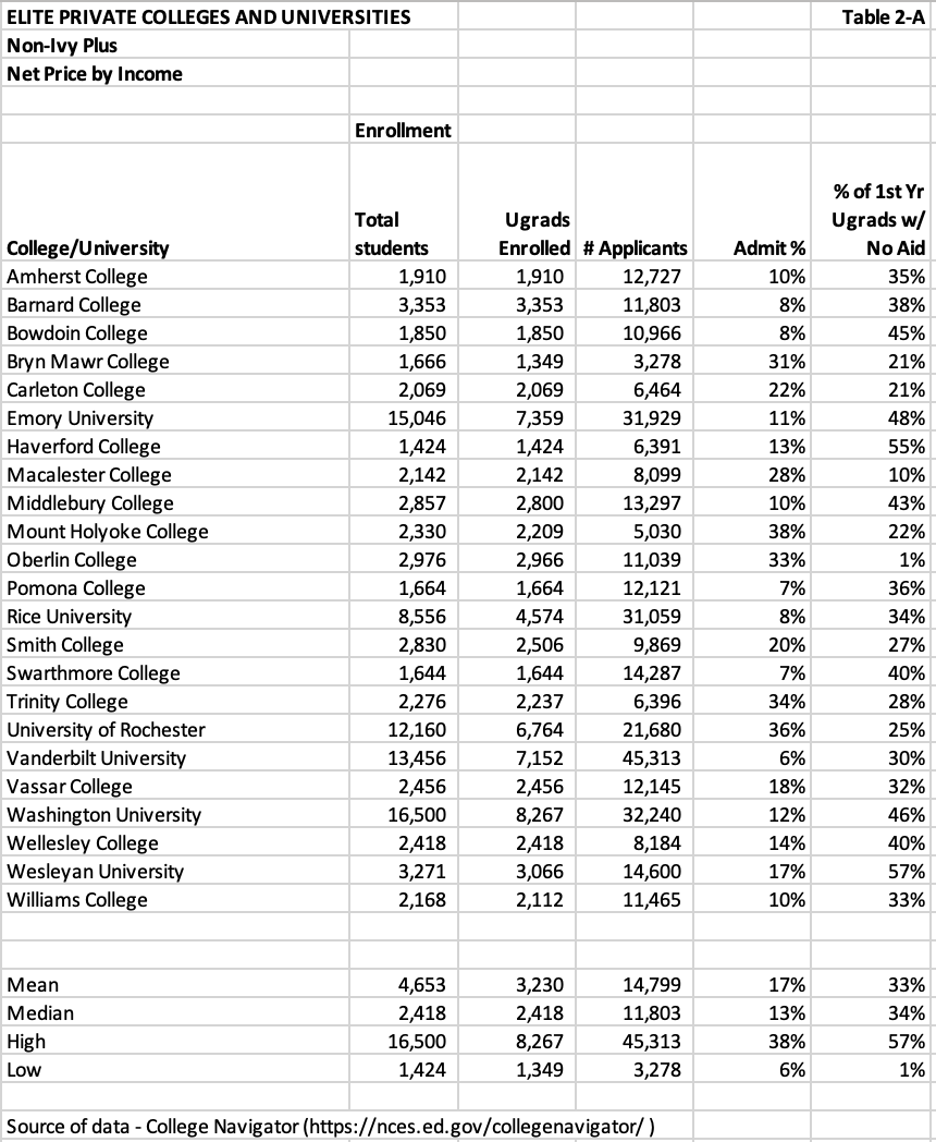
Table 3-A below provides the most recently published data from College Navigator regarding the total cost of attendance (COA) as well as its major components for each of the colleges and universities. As mentioned previously, these are very selective colleges, and their mean and median total cost of attendance are $90,260 and $89,562, respectively. These COAs are within 1-2% of the mean and median COAs for the Ivy Plus institutions.
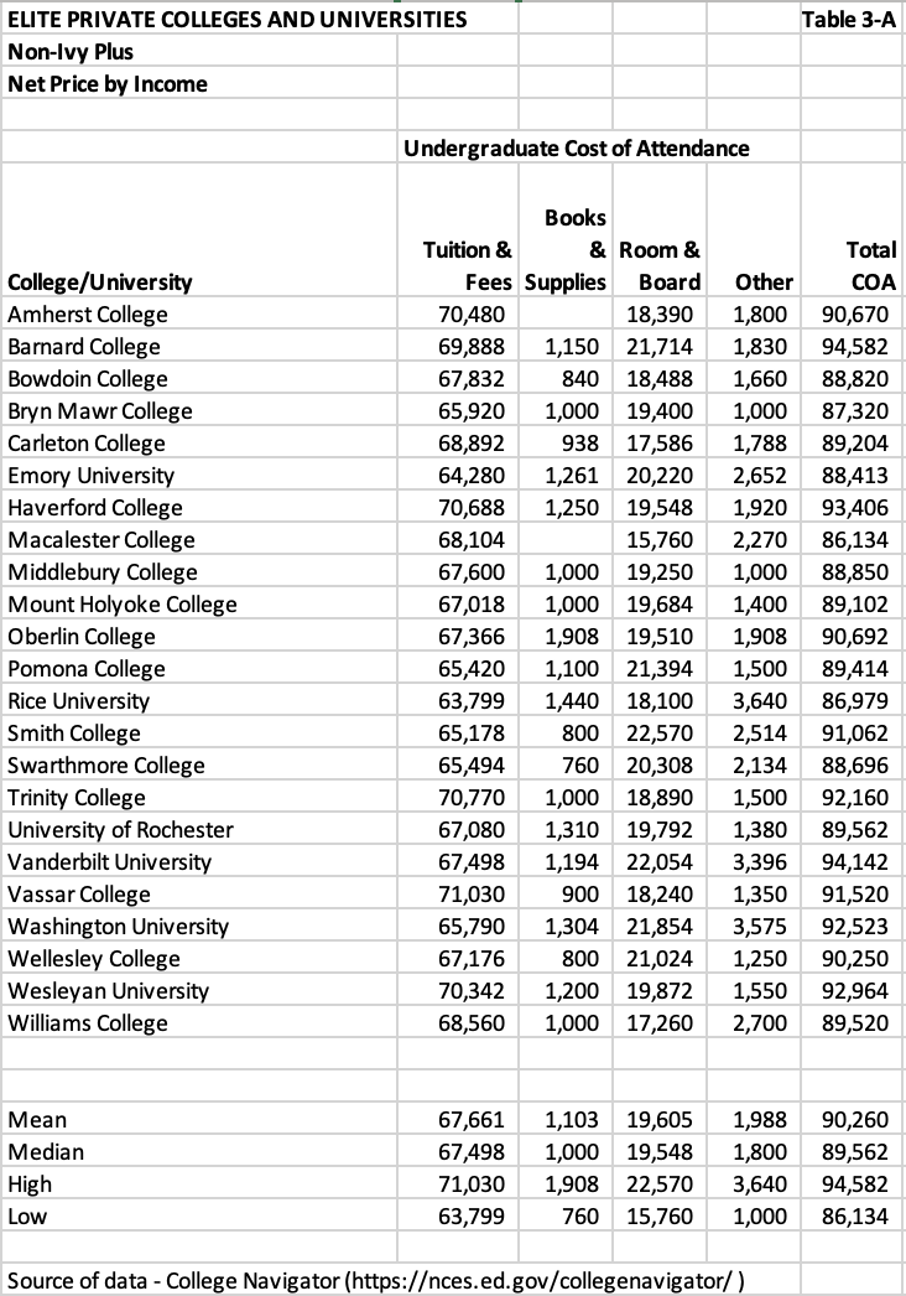
Table 4-A below provides the average net price for each institution as well as the average net price by income quintile as established by the U.S. Department of Education. The mean and median average net price for the remaining 23 are $27,412 and $26,689. These net prices are 20.4% higher (mean) and 14.4% higher (median) than those of the Ivy Plus group, suggesting that their abilities to support increased financial aid are not on par with the Ivy Plus group. This is likely due to lower endowment funds to cover institutional aid since the COA for each group is relatively the same.
Several institutions in this group have no-loan financial aid policies. That percentage is less than the percentage for the Ivy Plus group (another indication of lower endowment funds). While the net prices by income quintile range from low to high, they are not as low as the Ivy Plus group, with a few notable exceptions like Amherst and Williams.
The only income quintile where the remaining 23 mean and median net price is lower than the Ivy Plus group is the $110,001 and more quintile. The Ivy Plus mean and median net prices for this quintile were $49,627 and $50,452. The remaining 23 colleges’ mean and median net prices for this quintile are $47,176 and $48,245. There could be several explanations for that difference: (1) wealthier people send their children to the Ivy Plus institutions, (2) the competition for the full-pay students is greater with this slightly less prestigious group, or (3) institutional grants are awarded to a higher percentage of upper-income students with this group.
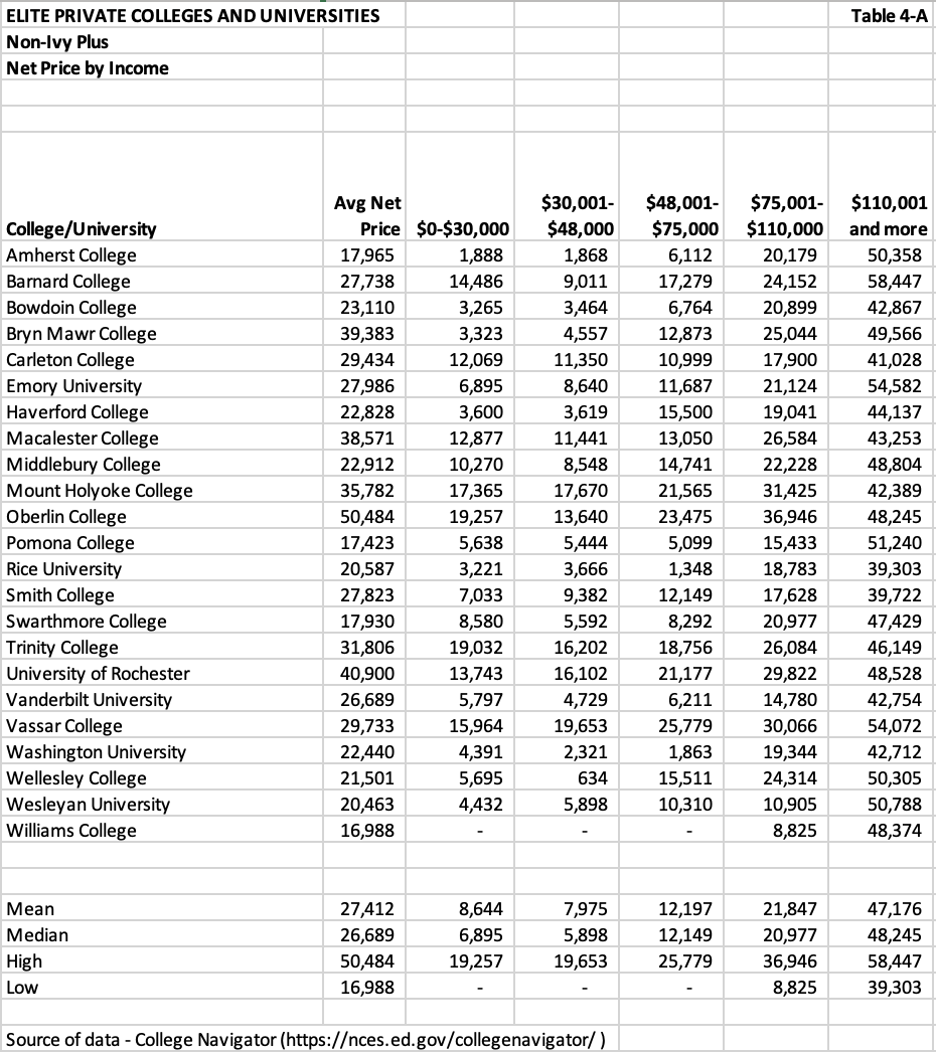
Table 5-A below illustrates the numbers and percentages of students at these institutions who receive institutional grants and scholarships, as well as federal and state grants. The mean and median percentages of these students are 61% and 60%, with the mean and median average grant at $52,061 and $53,335, respectively.
The mean and median percentages of students receiving grants for these 23 colleges and universities are higher than the mean (56%) and median (54%) for the Ivy Plus institutions. At the same time, the mean and median average grant is lower than the Ivy Plus of $55,657 and $55,827. The lower average grant for this group is likely due to fewer lower-income students receiving a full-grant package. This is evident in the higher net prices for the lower-income quintiles for the group of 23.
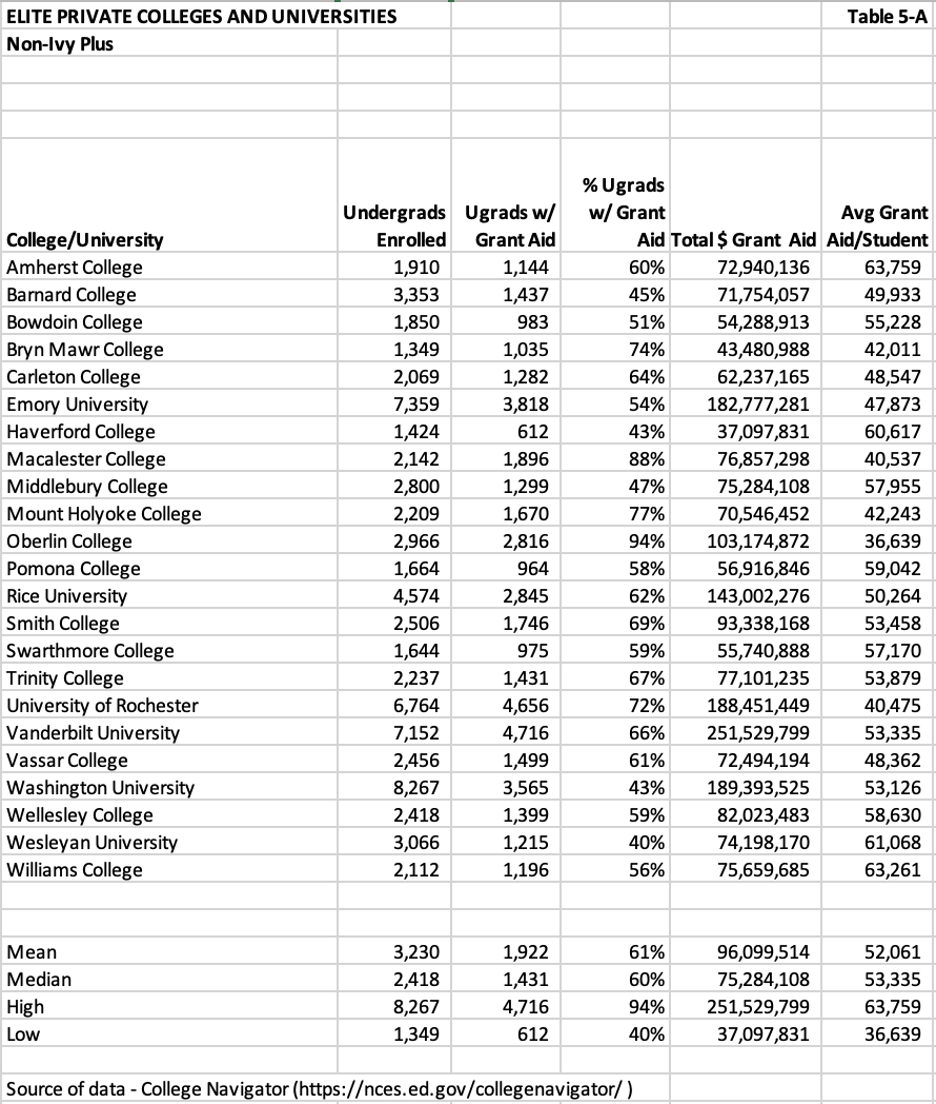
Table 6-A below provides the numbers and percentages of undergraduates at each institution receiving Pell grants. The mean and median percentage of students receiving Pell grants at the group of 23 is 17% for both. This ranges from a low of 9% at Oberlin College to a high of 22% at Amherst College. The Ivy Plus mean and median percentages are 1% and 2% higher.
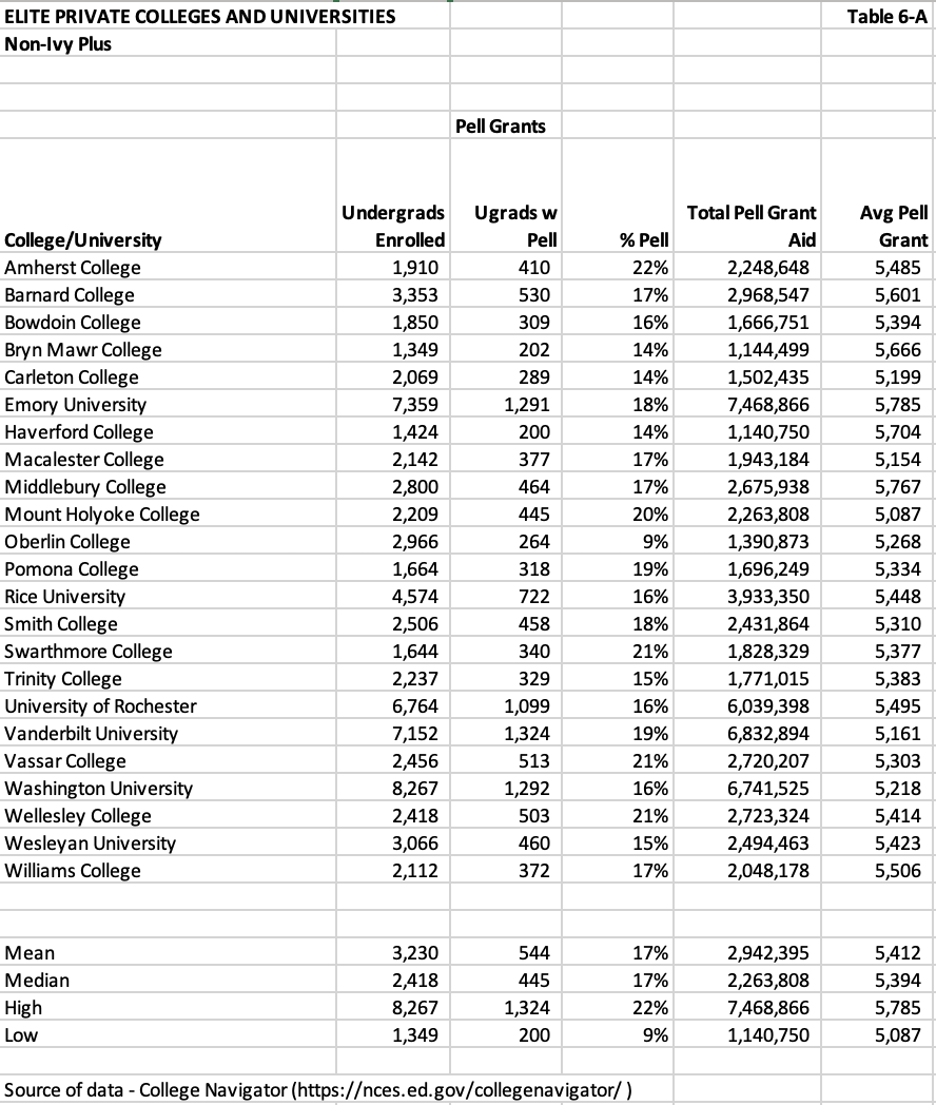
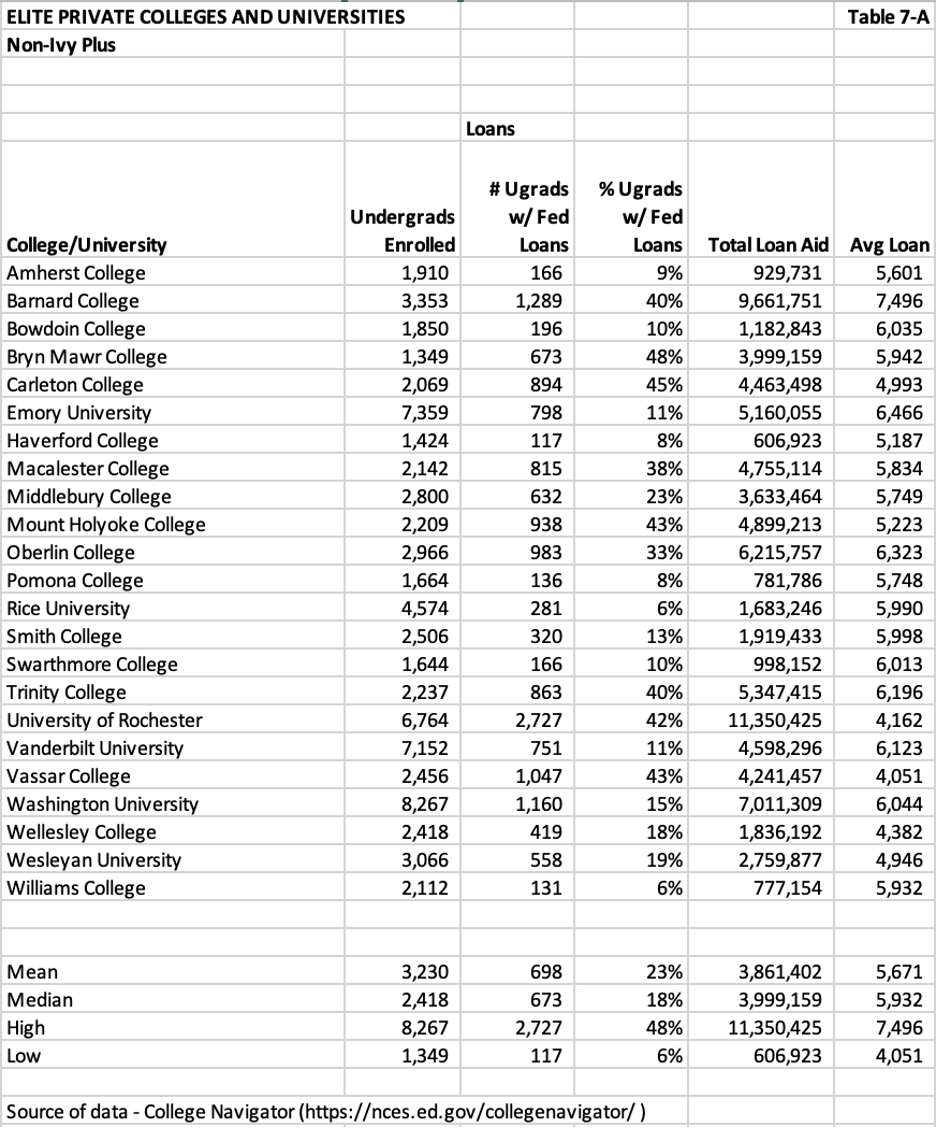
Table 7-A below illustrates the number and percentages of students borrowing to pay for some of the costs of attending these institutions. The mean and median percentage of students borrowing federal loans are 23% and 18%, significantly higher than the mean (10%) and median (10%) for the Ivy Plus institutions. The mean and median average loan borrowed is $5,671 and $5,932, slightly less for the mean (-$600) and approximately the same for the median of the Ivy Plus institutions. In these 23 institutions, the average loan borrowed was less than 10% of the average cost of attendance.
Final Thoughts
College Navigator provides a great deal of information for the average person, but not necessarily enough for researching issues like Early Decision. Its Undergraduate Admissions section includes information regarding the number of applicants, the percent admitted, the percent admitted who enrolled, admissions considerations such as the GPA, references, work experience, etc., that a college may consider, and whether admissions test scores such as SATs or ACTs are required.
Inside Higher Ed’s Liam Knox wrote an article about colleges using Early Decision as an enrollment tool in December 2024. Knox noted that approximately one in eight institutions (450) offer Early Decision programs, many of which are at selective liberal arts colleges. He also wrote that critics say the process gives a leg up to wealthy applicants who don’t have to worry about how to pay for college.
Indeed, wealthy applicants don’t have to worry about paying for college. However, at the 15 Ivy Plus institutions (nine of which were included in the class action lawsuit) and the 23 other elite private institutions illustrated in this article, most have generous financial aid programs, particularly for students in the lowest three quintiles. The 15 Ivy Plus institutions have an average Cost of Attendance (COA) of $91,150 (Table 3 above). Yet, the average Net Price (COA minus grants) at these 15 institutions is $22,768 (Table 4 above). Twenty of the 38 private schools included in this review have no-loan guarantees for all students admitted.
Knox provides other interesting information, such as the percentage of an entering first-year class admitted through Early Decision. He cites Duke (40%), Dickinson College (49%). Bates College (81%), Middlebury College (69%), Grinnell College (67%), Emory University (66%), Tulane University (68%), and Washington University (62%) as colleges and universities with high Early Decision acceptances.
Knox also cites James Murphy, director of postsecondary policy at Education Reform Now, stating, “The universities with the highest Early Decision admit rates are frequent ‘second choices,’ backup schools for applicants casting a wide net among selective colleges. If students must commit, institutions’ yield rates will surely increase.” This statement provides support for my recommendation that the Common App sort through the applications of the colleges named in the lawsuit to see if there are notable overlaps in applications among some of the institutions. I suspect there are. At the same time, I believe the percentage of overlapping applicants accepted at more than two institutions is very small.
The evidence is strong that the most selective institutions have the most generous financial aid programs. I don’t believe this lawsuit has merit on its claims, given the 32 institutions named. If I led an institution that was included in the lawsuit, I would defend it vigorously. On the other hand, if the lawsuit focused on institutions with Early Decision programs, low institutional grants, and high loan balances, my observations and recommendations might be different. I suspect that another reason for filing this lawsuit is to eliminate the practice of early decision admissions.