After updating my December 2025 report about a few enrollment, operating, and financial statistics for Maryland private colleges, I thought I should follow through with an update for Virginia’s private colleges. In case you missed the recent Maryland update, you can find it here.
My original Virginia private colleges post was in December 2025, a week after my post about Maryland’s private colleges. I compiled data about the member colleges of the Council of Independent Colleges in Virginia from the College Navigator website. I repeated that process for updating my data for this article.
Just as I excluded data from Johns Hopkins University from the Maryland mean, median, high and low statistics, I excluded data from three Virginia private universities. These are: the University of Richmond, Washington and Lee University, and Liberty University. The first two were excluded based on their admissions selectivity and endowment balances. Liberty was excluded based on its very high enrollments, the majority of which are online.
Enrollment
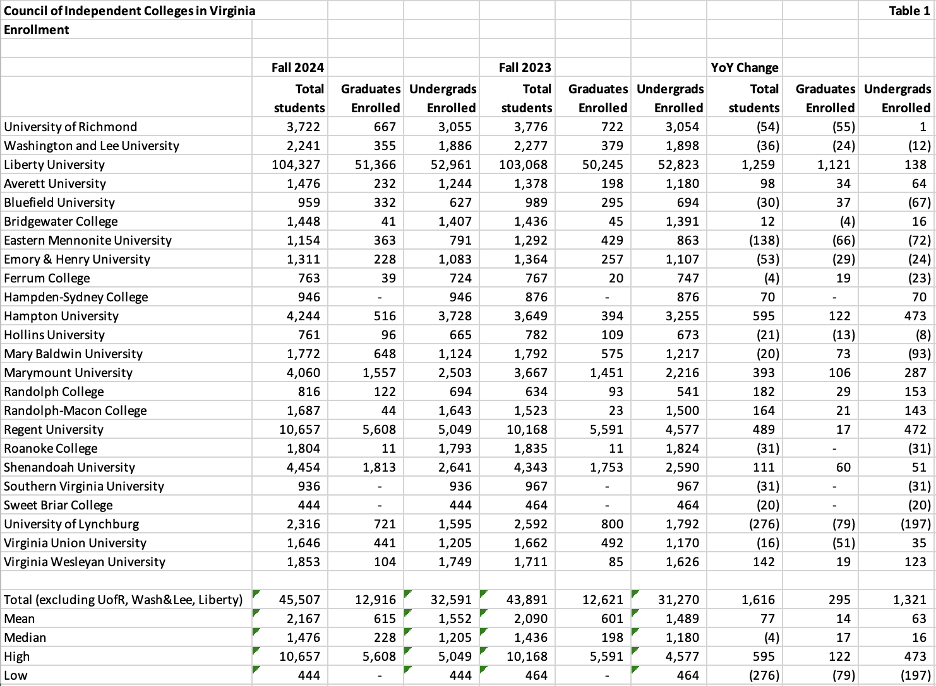
I listed the CICV member institutions and their enrollment totals for undergraduate and graduate students in Table 1 below. The first set of three columns represents Fall 2024 enrollments, the current data provided by College Navigator. The second set of three columns represents Fall 2023 enrollments, the data that was available as of 12/18/25 when I published my previous article.
The means, medians, highs, and lows for the group of 24 excludes Liberty University for good reason. Each of Liberty’s graduate and undergraduate student populations on a standalone basis eclipses the combined enrollments of the other 23 colleges and universities.
The remaining 21 colleges and universities saw their aggregate enrollments increase by 1,616 year-over-year, with most of that increase represented by an aggregate gain of 1,321 undergraduates. The aggregate number of grad students enrolled increased by 295. The mean change for the group was an average increase of 77 students versus a median change of -4 students.
Individual colleges varied widely, with the highest total enrollment gain at Hampton University (+595 students) followed by Regent University (+489 students), Marymount University (+393 students), Randolph College (+182 students), Randolph-Macon College (+164 students), Virginia Wesleyan University (+142 students), Shenandoah University (+111 students), Averett College (+98 students), and Hampden-Sydney (+70 students).
The University of Lynchburg experienced the greatest decline in enrollment (-276 students), followed by Eastern Mennonite University (-138 students), Emory & Henry University (-53 students), Roanoke College (-31 students), Southern Virginia University (-31 students), Bluefield University (-30 students), Hollins University (-21 students), Mary Baldwin University (-20 students), and Sweet Briar College (-20 students).
There are more private colleges in Virginia with low or no graduate student enrollment than there are in Maryland. These include Randolph-Macon College (44 students), Bridgewater College (41 students), Ferrum College (39 students), Roanoke College (11 students), Hampden-Sydney College (none), Southern Virginia University (none), and Sweet Briar College (none).
Admissions Selectivity
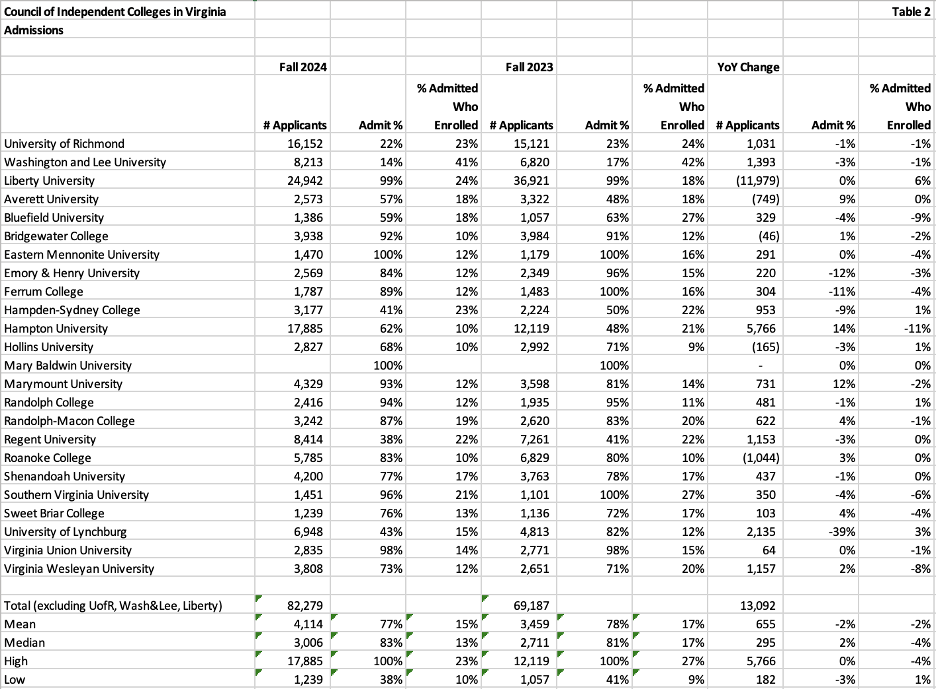
Table 2 below compares the change in application volume, the percentage of students admitted, and the percentage of admitted students who enrolled on a year-over-year basis (note that the most recent data is for Fall 2024, data from two years ago).
The 19 percent increase in applications for the group excluding Richmond, W&L, and Liberty did not affect their selectivity, with the mean acceptance rate of 77 percent declining by only 1 percent. The percentage of those admitted who enrolled declined from 17 percent to 15 percent year over year. A major reason for this increase in applications with no reduction in acceptances can be explained by the forces identified by Geoff Baird and Teege Mettille in their book, The Signal Solution. Thanks to the Common App and direct admissions programs, applications are up substantially, while yield is down for most institutions.
Greenstein wrote that “As acceptance rates rise, financial resilience collapses” and that the relationship is not linear but exponential. He added, “Beyond 50% acceptance, the decline becomes a free fall. By the time acceptance exceeds 75%, nearly 9 out of 10 institutions are considered high risk.” Approximately two-thirds of the 21 schools have an admit rate of 75% or higher, and the group median is 83%.
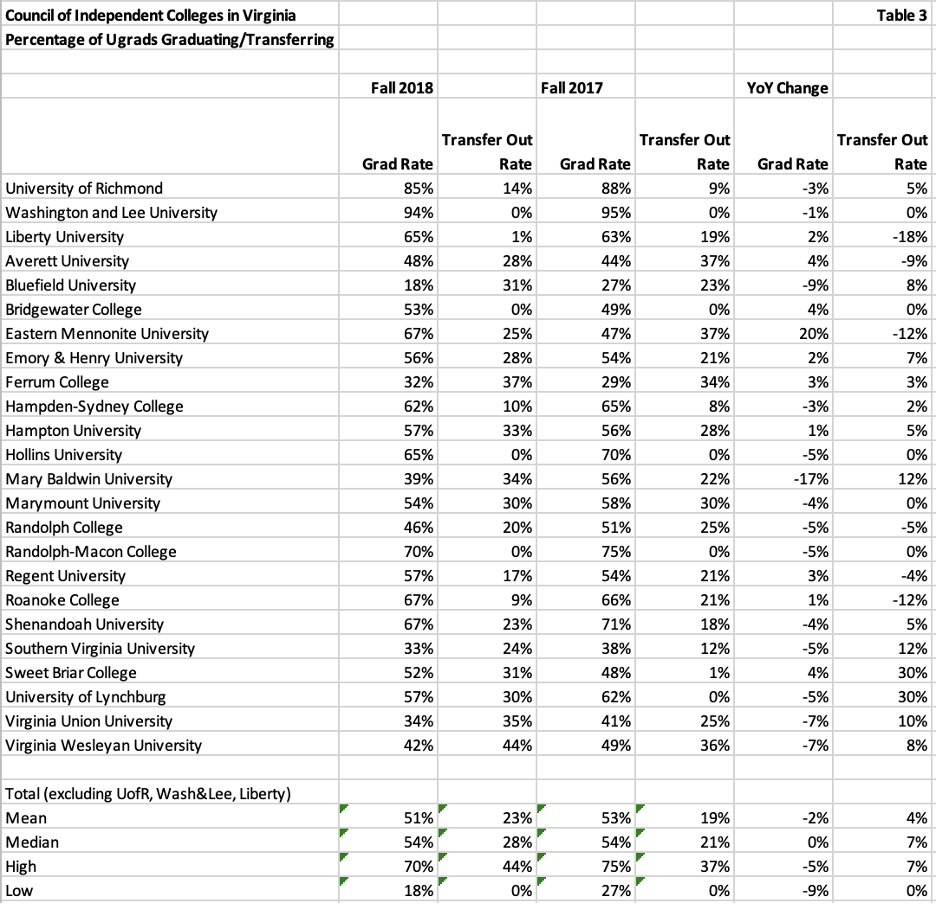
With low selectivity, the first thing that comes to mind is the percentage of students enrolling who graduate. Table 3 below illustrates the percentage of first-time, full-time undergraduates who graduated in six years, as well as the percentage of first-year students from that starting cohort who transferred out.
The group of 21 has a few colleges with what appear to be major swings, but the year-over-year change is not significant for the group. In the cases of a couple of colleges, the percentage is likely high because of enrollments below 1,000 students. It is important to note that the percentage of first-time, full-time students included in this calculation also varies widely. For example, 24 percent of Regent University’s students are first-time, full-time, whereas 95 percent of Sweet Briar College’s students are first-time, full-time.
Because the most recent starting date was Fall 2018, any targeted improvements to increase the percentage of students graduating or reduce the percentage of students transferring out from that Fall 2017 cohort have not yet been disclosed or possibly achieved. It is more than likely that the senior leadership teams at each of these institutions are aware of these trends and have processes in place to improve them.
Graduate Student Enrollment and Tuition Revenues
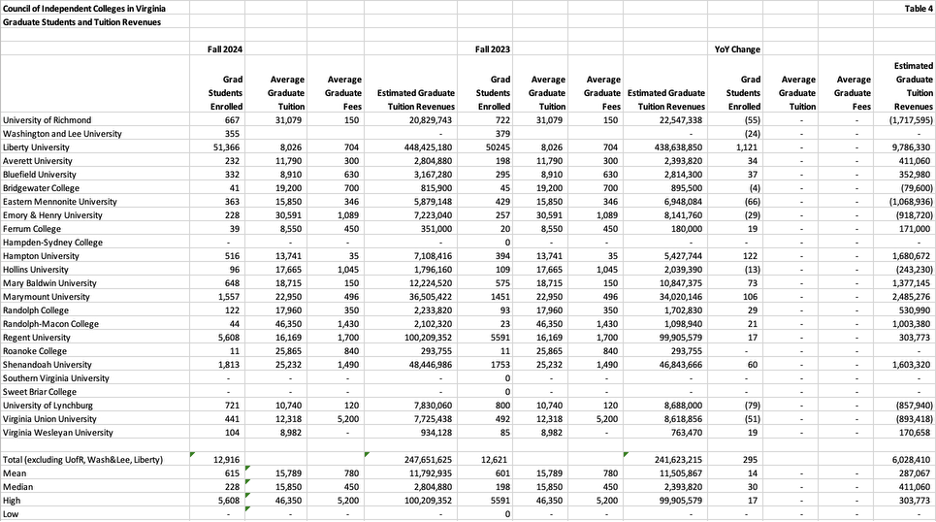
One important item to note is that most of the CICV institutions have graduate student enrollments that generate incremental tuition revenues for the institution. Table 4 illustrates the year-over-year impact of increases or decreases in graduate tuition revenues for each institution. Note that the year-over-year comparative impact for average tuition per student and average graduate fees per student are zero because the Department of Education has not updated College Navigator’s tuition since November 30, 2025. The net change for the table, as currently displayed, accounts only for changes in enrollment based on the most recently published tuition.
Increases in grad student enrollment positively impacted Marymount University (+2,485,276), Hampton University (+1,680,672), Shenandoah University (+1,603,320), Mary Baldwin University (+1,377,145), and Randolph-Macon College (+$1,003,380).
Decreases in grad student enrollment negatively impacted Eastern Mennonite University (-1,068,936), Emory & Henry University(-918,720), Virginia Union University (-893,418), and University of Lynchburg (-857,940). As mentioned earlier, four colleges have no graduate student enrollment at all.
Tuition, Cost of Attendance, and Net Price
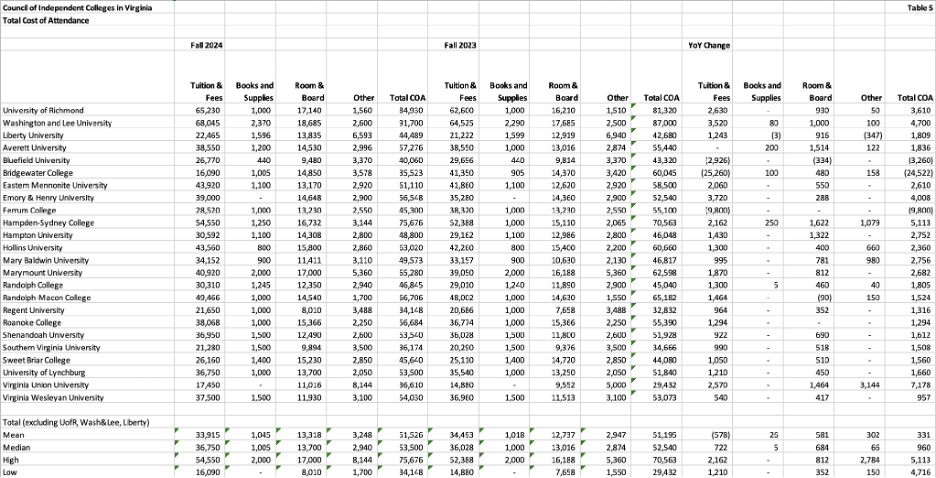
In Table 5, the major components of the published cost of attendance are listed for each institution for Fall 2024 and Fall 2023, the most recent published years in College Navigator. The year-over-year change is also calculated.
As usual, tuition is the largest component in the total cost of attendance. All institutions other than Bluefield University, Bridgewater College, and Ferrum College posted aggregate increases in Total Cost of Attendance, with tuition generally accounting for the single-largest dollar increase. The bulk of the decrease for Bluefield, Bridgewater, and Ferrum was in the tuition category, likely a tuition reset, with Bridgewater’s being the most significant.
There are “groupings” of Total COA with the following institutions:
- University of Richmond and Washington and Lee – 85,000-90,000
- Hampden-Sydney University – $75,000
- Eastern Mennonite University, Hollins University, Marymount University, and Randolph-Macon College – 60,000-65,000
- Averett University, Emory & Henry University, Roanoke College, Shenandoah University, University of Lynchburg, and Virginia Wesleyan University – 53,000-57,500
- Liberty University, Bluefield University, Ferrum College, Hampton University, Mary Baldwin University, Randolph College, and Sweet Briar College – $40,000-49,500
- Bridgewater College, Regent University, Southern Virginia University, and Virginia Union University – 34,000-37,000
Without a detailed analysis of admissions and marketing materials, as well as a demographic analysis of enrolling students, it is difficult to explain the differences in Total COA other than that they are likely based on “positioning” each institution to its targeted demographic group. There are more groupings (six) among the Virginia private colleges than there were with the Maryland private colleges (five). The low end of the Virginia groupings is approximately 5,000-7,000 lower than the low end of the Maryland groupings.
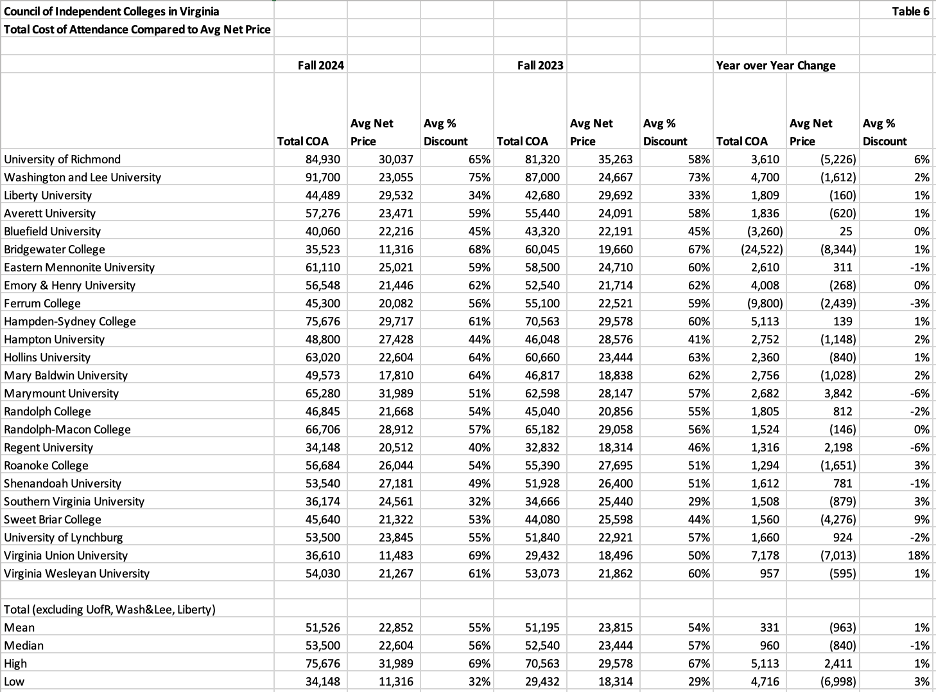
The published cost of attendance rarely matches the net price. Table 6 compares the total cost of attendance to the overall average net price and the average discount percentage for the last two years, along with the year-over-year change. Note that the average discount percentage is calculated as a percentage of the Total COA, not just tuition.
The median average net price for the group is $22,604 (this includes room and board and fees). The median average percentage discount for the group is 56%. The mean Total COA for the group increased only $331, while the mean average net price for the group decreased by $963. This implies that while the average “list prices” included in Total COA increased, the average discount increased more than the average list price. A negative change in average net price indicates that an institution is receiving less cash per student. Thirteen of the twenty-one institutions had negative changes in average net price. Richmond and Washington and Lee experienced declines in average net price, but some or all of these changes could be offset by their much larger endowments.
The average net price ranged from a low of $11,316 (Bridgewater College) to a high of $31,989 (Marymount University). Most of the net prices were in the $20,000 range, with a few, besides Bridgewater, in the under-$20,000 group. Overall, the average net price for Virginia private colleges is approximately $3,100 lower than that of Maryland private colleges. Unless enrollments increase quickly, I don’t see how tuition-dependent private colleges with net prices below $20,000 will survive in the long run.
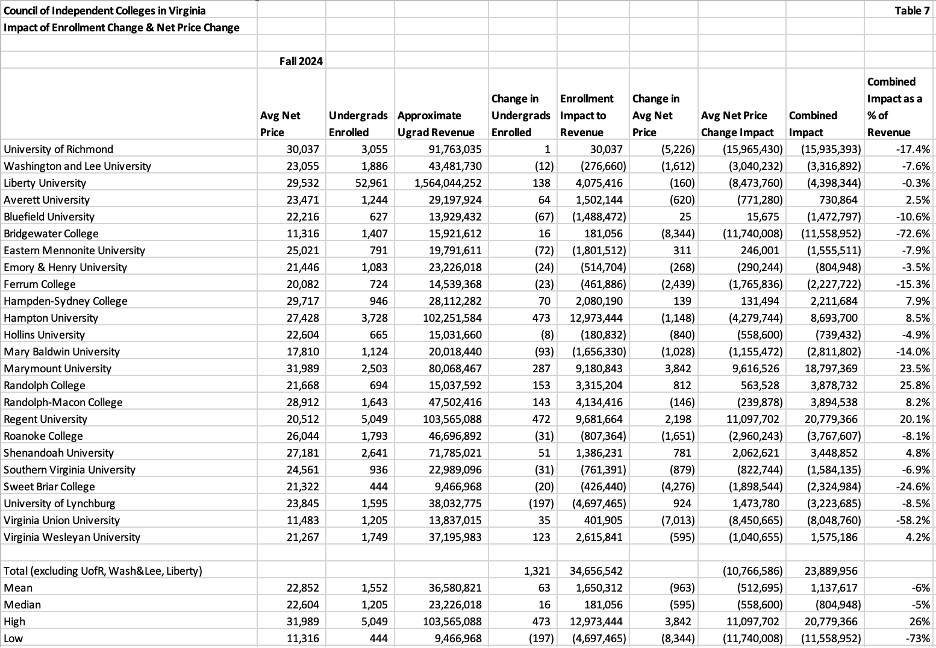
When undergraduate enrollments are increasing, a negative change in average net price may be okay. Table 7 below calculates the impact of enrollment changes and changes in average net price for each of the institutions in this group. Excluding the three institutions previously mentioned, the overall increase in undergrads enrolled of 1,321 improved the group of 21’s revenue by $34,656,542. The decrease in average net price of $963 due to an increase in the average discount rate negatively impacted the group by $10,766,586.
Reviewing individual schools, the results vary widely. Richmond and W&L, the two most selective institutions, decreased their aggregate revenues by $19,005,662, driven by lower average net prices. In the case of both institutions, draws from their multi-billion-dollar endowments, charitable donations, or other factors could cover that decline.
Bridgewater College, which saw its average net price decline by $8,344, was negatively impacted by an $11,740,008 decline in undergraduate revenues. Bridgewater maintained its enrollment (+16), but leadership obviously believes increased enrollments are needed given the substantial adjustment in tuition and need to increase enrollments to cover that substantial decline in undergraduate revenues.
Lynchburg experienced a decline of 197 undergrads, but an increase of $924 in average net price reduced its overall revenue decline by $1.4 million to a net decline of $3.2 million.
Virginia Union reduced its net price by $7,013, resulting in an $8.4 million decline in revenue. Its increase in enrollment of 35 undergraduates only resulted in a $400,000 increase in revenue, obviously not what the leadership team was hoping for when they lowered the net price.
Virginia Wesleyan achieved an increase of 123 students, increasing its revenue by approximately $2.6 million. However, its average net price declined by $595, creating a $1 million offset for a net revenue gain of $1.6 million.
Undergraduate enrollment at most of these private colleges and universities is campus-based, so adjusting expenses to offset declines in net revenues is not easy. Given that the enrollment and tuition data are two years old, only the institutions know how well they have managed through an ongoing demographic cliff impacting enrollment, as well as a very competitive environment impacting the average tuition discount rate.
A Few More Thoughts
Most colleges must be resourceful these days to survive, let alone thrive. You don’t have to have an MBA to realize that small, declining enrollments combined with higher tuition discount rates leading to lower average net prices are a disastrous combination.
The aggregate decline in undergraduate net price had a lesser impact (-$10.8 million) on the CICV members (excluding Richmond, W&L, and Liberty) than the increase in undergraduate enrollments (+$34.7 million). However, the impact did not affect the institutions equally.
The median impact on institutional revenue was a $804,948 decline. Three institutions (Regent +$20.8 million, Marymount +$18.8 million, and Hampton +$8.7 million) drove the mean impact on institutional revenue to an average revenue increase of $1.1 million. One of those three institutions (Hampton) increased its enrollment by 473 students but experienced a $1,148 decline in its average net price. The other two institutions increased enrollment and increased average net price. That’s clearly difficult to do in this environment.
It’s important to remember that the average net price differs from the average net price by income quintile. Usually, though not always, the highest-income quintile has an average net price higher than the overall average net price. Depending on how much merit aid an institution awards to attract higher-income students, the discount for the highest bracket may exceed the overall average.
One point Daniel Greenstein made in his original analysis was that by the time acceptance rates reach 75 percent, nine out of ten institutions are at high financial risk. The admissions data for these institutions is two years old. Approximately two-thirds of CICV institutions had acceptance rates around 75 percent or higher. Given the impact of the demographic cliff on eligible students and the widespread use of tuition discounting to attract students, most of these schools will have to work hard to maintain aggregate net revenues, let alone increase them at a high enough rate to cover rising expenses.
Most of the colleges in this group have enrolled graduate students to increase revenues. Almost all have added business programs to their traditional liberal arts programs to attract new students. Tuition resets, in which the college deliberately cuts its tuition across the board (and the size of its merit aid awards), are increasing, according to a recent Wall Street Journal article. Some private colleges are offering in-state students an “in-state” rate to be more price-competitive.
Small college presidents facing enrollment and tuition-discounting issues have a daunting challenge. If they raise their price, they risk decreasing their yield. If they cut prices, they erode their margin. Highly selective institutions like the University of Richmond and Washington & Lee don’t have those risks. Online universities able to scale and offer a low cost of attendance like Liberty, don’t have those risks either.
In the aggregate, Virginia’s private colleges did not experience the enrollment decline that Maryland’s private colleges did. That could be related to the perceived warmer weather in Virginia, which is Maryland’s southern neighbor, or it could be related to the overall lower cost of attendance for Virginia’s colleges. It may also be related to a lower Demographic decline in Virginia’s college student population than Maryland’s. College Navigator reports the percentage of in-state versus out-of-state students for each institution, but I did not review that statistic.
The analysis and reviews that I conducted almost a year ago also included data from private colleges in Florida, Pennsylvania, and Iowa. I suspect that I’ll continue to update my data and compare the year-over-year results for these states. Looking at the institutions that continue to experience low enrollments, declines in first-year class enrollments, and declines in average net price, it’s easy to understand why a few researchers and reporters are estimating that some colleges will go under or merge.